Geosci. Model Dev., 4, 901–917, 2011 www.geosci-model-dev.net/4/901/2011/ doi:10.5194/gmd-4-901-2011 © Author(s) 2011. CC Attribution 3.0 License.
Geoscientific Model Development
Modeling anthropogenically controlled secondary organic aerosols in a megacity: a simplified framework for global and climate models A. Hodzic1 and J. L. Jimenez2 1 National 2 Dept.
Center for Atmospheric Research, Boulder, CO, USA of Chemistry and Biochemistry, and CIRES, University of Colorado, Boulder, CO, USA
Received: 18 March 2011 – Published in Geosci. Model Dev. Discuss.: 19 April 2011 Revised: 29 September 2011 – Accepted: 12 October 2011 – Published: 24 October 2011
Abstract. A simplified parameterization for secondary organic aerosol (SOA) formation in polluted air and biomass burning smoke is tested and optimized in this work, towards the goal of a computationally inexpensive method to calculate pollution and biomass burning SOA mass and hygroscopicity in global and climate models. A regional chemistry-transport model is used as the testbed for the parameterization, which is compared against observations from the Mexico City metropolitan area during the MILAGRO 2006 field experiment. The empirical parameterization is based on the observed proportionality of SOA concentrations to excess CO and photochemical age of the airmass. The approach consists in emitting an organic gas as lumped SOA precursor surrogate proportional to anthropogenic or biomass burning CO emissions according to the observed ratio between SOA and CO in aged air, and reacting this surrogate with OH into a single non-volatile species that condenses to form SOA. An emission factor of 0.08 g of the lumped SOA precursor per g of CO and a rate constant with OH of 1.25 × 10⁻¹¹ cm3 molecule−1 s−1 reproduce the observed average SOA mass within 30 % in the urban area and downwind. When a 2.5 times slower rate is used (5 × 10⁻¹² cm3 molecule−1 s−1 ) the predicted SOA amount and temporal evolution is nearly identical to the results obtained with SOA formation from semi-volatile and intermediate volatility primary organic vapors according to the Robinson et al. (2007) formulation. Our simplified method has the advantage of being much less computationally expensive than Robinson-type methods, and can be used in regions where the emissions of SOA precursors are not yet available. As the aged SOA/1CO ratios are rather consistent globally for anthropogenic pollution, this parameterization could be
Correspondence to: A. Hodzic (
[email protected])
reasonably tested in and applied to other regions. The evolution of oxygen-to-carbon ratio was also empirically modeled and the predicted levels were found to be in reasonable agreement with observations. The potential enhancement of biogenic SOA by anthropogenic pollution, which has been suggested to play a major role in global SOA formation, is also tested using two simple parameterizations. Our results suggest that the pollution enhancement of biogenic SOA could provide additional SOA, but does not however explain the concentrations or the spatial and temporal variations of measured SOA mass in the vicinity of Mexico City, which appears to be controlled by anthropogenic sources. The contribution of the biomass burning to the predicted SOA is less than 10 % during the studied period.
1
Introduction
The representation of sources and formation processes of organic aerosols (OA) in chemistry and climate models is currently highly uncertain. This leads to inaccurate estimates of OA mass and the radiative forcing associated with atmospheric aerosols (Kiehl, 2007), as well as the difficulty to distinguish between naturally and anthropogenically controlled OA (Carlton et al., 2010; Hoyle et al., 2011). Accurate predictions of OA mass and its sources are key to predicting aerosol evolution and radiative forcing under future climate and emission scenarios. OA is composed of a mixture of primary emitted organic matter (POA) and secondary organic aerosols (SOA) formed by gas-to-particle conversion. The spatio-temporal distribution of OA concentrations depends on their primary emission sources, atmospheric transport and mixing, chemical processing, and removal by deposition. While significant uncertainties exist at all levels of OA processing, the largest unknowns reside in the representation of the formation and ageing of SOA (Hallquist et al., 2009).
Published by Copernicus Publications on behalf of the European Geosciences Union.
902
A. Hodzic and J. L. Jimenez : Modeling anthropogenically controlled secondary organic aerosols in a megacity
Comparisons with data from recently developed fast instrumentation have confirmed the tendency of models to greatly underpredict the levels of SOA formed in urban plumes when only the SOA formation from volatile organic compounds (VOCs) is considered (e.g. de Gouw et al., 2005; Dzepina et al., 2009; Hodzic et al., 2009; Shrivastava et al., 2010; Lee-Taylor et al., 2011). Hodzic et al. (2009) estimated the missing SOA mass production as ∼20 tons day−1 in the Mexico City afternoon boundary layer when using a traditional SOA model. Implementing SOA formation from primary semi-volatile and intermediate volatility species through the volatility basis set formalism (VBS, Robinson et al., 2007; Grieshop et al., 2009) substantially increases the predicted SOA to levels similar to those observed (Dzepina et al., 2009; Hodzic et al., 2010a; Shrivastava et al., 2010). However, substantial uncertainties persist in terms of the identity and sources of the SOA precursors and the mechanism parameters, as well as on the influence of other proposed SOA formation mechanisms (e.g. Hodzic et al., 2010a). In particular, the VBS approach requires adding the emissions of primary organic vapors as they are not included in current inventories. For Mexico City, this missing mass was added to models as 7.5 times the emissions of POA (Dzepina et al., 2009; Tsimpidi et al., 2010; Hodzic et al., 2010a). This emission amount is considerable and highly uncertain although it is the main driver for the predicted SOA mass. In addition, the full VBS approach is computationally very costly, as it requires keeping track of organic vapor and particle-phase species over 9 volatility bins and multiple particle size bins commonly used to represent the aerosol size distribution. A reduced VBS approach has been recently proposed by Shrivastava et al. (2010) which reduces the computational burden of the method while maintaining a link to the originally-proposed parameterization. In the aerosol field measurement community, the formation of SOA in polluted airmasses has been recently studied and parameterized by considering ratios of OA to a chemically quasi-inert species such as carbon monoxide (CO), which allows removing the effect of dilution and emissions on timescales of several days (de Gouw et al., 2005; DeCarlo et al., 2010). Indeed, in urban and regional scales, CO is approximately conserved with regard to OH oxidation on timescales of hours to several days which are relevant to SOA formation, and its main sources are the combustion from traffic and from biomass burning, and long-range transport. Chemical production of CO from anthropogenic VOCs makes a very small contribution to polluted airmasses (Griffin et al., 2007). Although production from biogenic VOCs can make a major contribution to background CO levels in biogenically influenced areas (Hudman et al., 2008), this source does not result in narrow plumes with several hundred ppb of CO, where the SOA vs. CO parameterizations for pollution and biomass burning sources have been derived (e.g. Kleinman et al., 2008; DeCarlo et al., 2010).
Geosci. Model Dev., 4, 901–917, 2011
To remove the influence of background (long range transport) CO, it is common to consider 1CO as the measured CO minus the CO background. As CO and POA have similar or generally collocated emission sources, their ratio (POA/1CO) is relatively constant when averaged over a source region, and can be estimated from ambient measurements. The continuing good correlation between OA and CO and the large measured increase in OA/1CO ratios downwind of urban areas can then be attributed to the rapid growth of secondary organic aerosols due to anthropogenic pollution. de Gouw and Jimenez (2009), DeCarlo et al. (2010), and Cubison et al. (2011) summarize the observed OA/1CO enhancement ratios from studies at multiple worldwide locations for fresh and aged urban and biomass burning emissions. Urban POA/1CO ratios were found to range from 5– 12 µg m−3 ppmv−1 , with the lower values likely to be more correct as the higher values may have some SOA contamination (de Gouw and Jimenez, 2009). Total OA/1CO ratios in aged urban air are systematically higher than those measured in the source region by about an order-of-magnitude. Very similar OA/1CO evolution and asymptotic levels ranging from 50–110 µg m−3 ppmv−1 in aged air were found for various polluted locations in the Northeast US, Central Mexico, Tokyo and the Po Valley. In plumes influenced by biomass burning, POA/1CO ratios are initially much higher (50–240 µg m−3 ppmv−1 ) than for urban airmasses, and net OA/1CO enhancement during aging appears to vary from a small reduction to a gain comparable to the POA emissions (de Gouw and Jimenez, 2009; Yokelson et al., 2009; Cubison et al., 2011). For example in the forest fires that dominated biomass burning impacts in the Mexico City region during the MILAGRO experiment the net OA/1CO enhancement seems to be in the same range as for the urban emissions (40–60 µg m−3 ppmv−1 , DeCarlo et al., 2010). As these studies suggest a rather consistent behavior and evolution of the OA/1CO ratios in polluted plumes regardless of their geographic location, we investigate in the present study whether a simplified empirical parameterization based on the observed OA vs. 1CO relationship could be used to predict the amount of anthropogenic SOA. Using CO as a proxy is a particularly convenient choice as CO is typically well reproduced by models, can be measured from satellites, and also has similar or collocated emissions sources as SOA precursors. A similar approach has recently been applied to a global model by Spracklen et al. (2011). By adjusting the strength of the different SOA sources to optimize the agreement between modeled and measured OA and non-fossil carbon, these authors reported that the optimized global SOA budget appears to be dominated by an anthropogenically controlled source, due to both SOA formation from anthropogenic VOCs (∼10 Tg yr−1 ) and a very large contribution (∼90 Tg yr−1 ) from anthropogenic pollution enhancement of SOA from biogenic VOC. However, the Spracklen et al. (2011) study was performed at a very coarse horizontal resolution (2.8◦ × 2.8◦ ∼ 300 km × 300 km), and www.geosci-model-dev.net/4/901/2011/
A. Hodzic and J. L. Jimenez : Modeling anthropogenically controlled secondary organic aerosols in a megacity using monthly mean SOA observations, which do not have sufficient detail to resolve polluted urban conditions. Thus there is a need to explore whether the conclusions of that global study hold when evaluated with a regional model at much higher spatial and temporal resolution. Therefore the goal of the present study is to test and optimize a first order SOA parameterization for anthropogenic pollution based on the observed SOA/1CO ratios that best describes the observed OA. We also propose a simple parameterization to estimate the oxygen-to-carbon ratio (O/C) of OA in polluted regions. For that purpose the regional chemistry-transport model predictions are evaluated against ground and aircraft data from Mexico City during the major MILAGRO 2006 field project. Although this type of empirical parameterization does not have mechanistic detail, or allow predicting some OA properties such as volatility, being able to estimate SOA with a simple scheme is of great interest for global and climate modeling studies that need to evaluate the transport and radiative impact of aerosols. The optimized parameterization is compared with SOA predictions from the more complex volatility basis set approach. Finally, we also test two simplified parameterizations of biogenic SOA enhancement due to anthropogenic pollution.
2 2.1
Modeling approach General model description
For this study, the mesoscale chemical transport model CHIMERE was run from 15 to 31 March 2006 over the Mexico City region at both regional (35 km × 35 km) and urban (5 km × 5 km) grid scales using the same configuration and the same forcing (i.e. meteorology, emissions, boundary and initial conditions) as described by Hodzic et al. (2009, 2010a, b). Here we provide a brief summary of sources and processes that influence the levels of organic aerosols, and introduce the simplified SOA modeling approach that was applied in the present study. The terminology used in the paper is summarized in Table 1. The CHIMERE model simulates the emissions of primary OA, the chemistry and gas/aerosol partitioning of secondary organic species and their gaseous precursors, in addition to their transport, boundary layer mixing, and dry and wet deposition processes. Similar to Hodzic et al. (2009, 2010a, b), primary gaseous and aerosol species are emitted from (i) anthropogenic sources as reported by the 2002 official Mexico City Metropolitan Area emission inventory (CAM, 2004) and the National Emissions Inventory (NEI) of 1999 emissions outside of the city (http://mexiconei.blogspot.com/), (ii) biomass burning emissions as estimated from satellite data by Wiedinmyer et al. (2006), and (iii) biogenic VOC emissions calculated online using the MEGAN model (Guenther et al., 2006). www.geosci-model-dev.net/4/901/2011/
903
As CO is an important model component for this study, it is important to evaluate whether the model can reproduce the measured CO levels. Hodzic et al. (2009) have shown that CO inside Mexico City is generally well captured by the model in comparison to the RAMA monitoring stations, suggesting that the Mexico City emissions are reasonable with the regard to CO, which is consistent with several previous evaluations of the CO emissions inventory (Zavala et al., 2006; Molina et al., 2007, 2010). However, comparison with aircraft measurements (Hodzic et al., 2010a) suggested the model tendency to underpredict regional CO levels. This underprediction may be due to too low emissions in urban areas outside Mexico City, which are taken from the Mexico NEI inventory. CO boundary conditions from the monthly climatology of the LMDZ/INCA global chemistry-transport model could also be too low and contribute somewhat to this gap. However as the population in Mexico City is 20 million, but in other urban areas in Central Mexico is about 10 million, or about 1/2 of the population in Mexico City (Molina et al., 2010), the regional emissions of CO are expected to be significant. We evaluated these emissions using the measured CO at the cities of Puebla (19.05◦ N, 98.2◦ W) and Toluca (19.29◦ N, 99.67◦ W), and concluded that the initial model underpredicts the observed CO levels inside the urban areas by a factor of ∼5 (Fig. S1, Supplement). Therefore the regional NEI emissions of CO outside of Mexico City have been increased by a factor of 5. This adjustment results in a small increase the regional background levels with a very minor effect on the Mexico City plume (Fig. S1, see Supplement). The increase in the regional CO levels of ∼50 ppb provides a slightly better agreement with the observed CO levels along the C130 flight track of 29 March 2006 (during a period with very low biomass burning, Aiken et al., 2010). The SOA treatment in the CHIMERE model that was previously based on Pun et al. (2006) and Hodzic et al. (2009) for anthropogenic and biogenic VOC precursors, and on Hodzic et al. (2010a) for primary organic vapors, has been revised for the purpose of this study. SOA formed from anthropogenic and biomass burning precursors has been replaced by the new empirical approach based on field measurements of SOA/1CO ratios. Besides the previous traditional biogenic SOA (BSOA) from OH oxidation of isoprene and terpene precursors, an alternative parameterization has been included in the model in order to evaluate the differences between current BSOA parameterizations and to account for NOx -dependent BSOA yields. Anthropogenic and biomass burning POA is modeled as a non-volatile species that can now convert to OOA by heterogeneous ageing in the atmosphere. The details of these parameterizations are discussed in sections below. In this study the model does not account directly for the gas-phase chemistry and partitioning of semi-volatile and intermediate-volatility primary organic vapors described by Hodzic et al. (2010a), rather this process is now lumped in the SOA/1CO parameterization and the POA aging. In addition to OA, CHIMERE also Geosci. Model Dev., 4, 901–917, 2011
904
A. Hodzic and J. L. Jimenez : Modeling anthropogenically controlled secondary organic aerosols in a megacity
Table 1. Terminology used for the various types of organic compounds, and for model simulations. Gas-phase organic compounds VOC VOCA (VOCBB )
Volatile Organic Compounds: gas-phase organic species of relatively high volatility (e.g. toluene, isoprene, terpenes). Volatile Organic Compounds from anthropogenic (biomass burning) origin: used here as a lumped surrogate anthropogenic (biomass burning) VOC species for the empirical SOA treatment, and emitted proportionally to anthropogenic (biomass burning) CO.
Condensed-phase organic species OA POA
SOA ASOA BBSOA BSOA
Organic Aerosol: includes both primary and secondary fractions. It includes carbon mass (OC) and also the oxygen, hydrogen, and nitrogen mass. Primary Organic Aerosol: emitted directly into the particle phase. Here it is treated as a non-volatile species that can however age into SOA after 2 days of atmospheric processing Secondary Organic Aerosol (from all sources) Secondary Organic Aerosol from anthropogenic sources Secondary Organic Aerosol from biomass burning sources Secondary Organic Aerosol from biogenic sources
Model Simulations OPT
ROB
ROB-like
SPR
TEST
Model simulation based on the empirical parameterization for SOA formation from anthropogenic and biomass burning sources, with VOCA and VOCBB emission rates of 0.08 g per g of CO, and a reaction rate with OH of 1.25 × 10⁻¹¹ cm3 molecules−1 s−1 . Model simulation that includes SOA formation from semi-volatile and intermediate volatility primary organic vapors according to the volatility basis set of Robinson et al. (2007) as reported in Hodzic et al. (2010a). Model simulation based on the empirical parameterization for SOA formation using VOCA and VOCBB emission rates of 0.08 g per g of CO, and a reaction rate with OH of 5 × 10⁻¹² cm3 molecules−1 s−1 . This run has a similar time scale as the ROB volatility basis set as shown in Fig. 1a and Table S3 (see Supplement). Similar to the OPT model, but with a VOCA emission rate of 0.20 g per g of CO and a rate constant of 5 × 10⁻¹² cm3 molecules−1 s−1 as used in Spracklen et al. (2011). Similar to the OPT model, with a pollution enhancement of biogenic SOA, based on SO2 and VOCA concentrations. The biogenic SOA formation is treated using Lane/Tsimpidi NOx -dependent yields.
Other notation VBS AMS OOA
Volatility Basis Set approach Aerodyne Aerosol Mass Spectrometer Oxygenated Organic Aerosols: an OA component identified with Positive Matrix Factorization method, which is characterized by its high oxygen content. It is generally understood as a surrogate for SOA.
accounts for wind-blown dust, secondary inorganic species (sulfate, nitrate and ammonium), particulate water, and other primary anthropogenic particles. The size distribution of all species is represented using a sectional approach with 8 size bins (40 nm to 10 microns in physical diameter) with internal mixing within each bin. Further information on the model formulation and related publications can be found on http://www.lmd.polytechnique.fr/chimere. Geosci. Model Dev., 4, 901–917, 2011
2.2
Alternative NOx -dependent SOA formation from biogenic precursors
A 4-species volatility basis set treatment has been included in order to test the effect of alternative parameterizations for the oxidation by OH of biogenic VOCs, including the effect of low- and high-NOx conditions following Lane et al. (2008). Three categories of biogenic precursors are www.geosci-model-dev.net/4/901/2011/
A. Hodzic and J. L. Jimenez : Modeling anthropogenically controlled secondary organic aerosols in a megacity 850
905
Figures
considered including isoprene, terpenes and sesquiterpenes. The stoichiometric mass yields that determine the amount of oxidation products in both low- and high-NOx regimes use the updated values from Tsimpidi et al. (2009) as summarized in Table 2, without additional gas-phase “aging” for the oxidized organic vapors as this is not well-supported by the literature (e.g. Dzepina et al., 2011). SOA is formed via both low- and high-NOx pathways based on the fraction of organo-peroxy radicals that react with NO (Lane et al., 2008). The four oxidation products are then partitioned to the aerosol phase according to their volatility, using the saturation concentrations of 1, 10, 100, and 1000 µg 851 m−3 at 300 K, respectively. The enthalpies of vaporization are set to 88 kJ mol−1 for all four species. Using a similar NOx dependent approach Shrivastava et al. (2010) reported that the biogenic SOA predicted in Mexico City was 4–5 times lower than predicted in our previous studies (Hodzic et al., 2009, 2010a) which used higher yields for isoprene under low-NOx conditions based on Henze and Seinfeld (2006) and which showed good correspondence with tracer-derived estimates of biogenic SOA (Hodzic et al., 2009). The sensitivity of the model results to the choice of the biogenic SOA parameterization is discussed in Sect. 3.5.1. 852
2.3
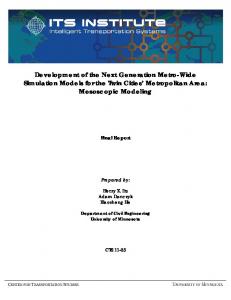
853 Figure 1: A schematic representation of the evolution of (a) the SOA/∆CO and (b) oxygen-to-carbon Simplified SOA parameterization for anthropogenic Fig. 1. A schematic representation of the evolution of (a) the 854 ratios as a function of photochemical age. For the SOA mass, the observed ratios (gray polygons) and biomass burning sources 855 are takenSOA/1CO from de Gouwand and (b) Jimenez (2009) and DeCarloratios et al. (2010) urban airmasses, oxygen-to-carbon as a for function of pho-whereas
856 for the O/C ratios the observed ratios are those summarized in Dzepina et al. (2011). Curves tochemical age. For mass, the observed (gray poly857 represent the estimated ratios for the OPT,SOA SPR and ROB-like simulationsratios for typical daily average OH 6 -3 858 in Mexico Cityde of Gouw 1.5x10 molecules cm . (2009) and DeCarlo et parameterizedconcentrations gons) found are taken from and Jimenez
SOA from anthropogenic sources has been based on the observed behavior of OA/1CO ratios vs. photochemical age that were reported in the literature, and in particular for Mexico City (Kleinman et al., 2008; DeCarlo et al., 2010). As SOA is a secondary pollutant (unlike 1CO) that forms from the oxidation of VOC precursors, SOA cannot be emitted directly proportionally to CO emissions for the purposes of regional modeling (although some global models do treat SOA in this way for simplicity, which is more reasonable for their large spatial and temporal scales, e.g. Textor et al., 2006). The implementation used here is similar to that of Spracklen et al. (2011). The first step of the approach consists in emitting a VOC precursor surrogate (VOCA for anthropogenic sources) that will gradually oxidize to form SOA downwind of the source region. The ratio of VOCA to anthropogenic CO emissions is assumed to be equal to the observed ratio in concentrations in very aged air under low biomass-burning conditions: Emis(VOCA )/Emis(CO) = SOA/1CO. The SOA/1CO reported in the literature for aged polluted air (and also for Mexico City) range from 40 to 110 µg m−3 ppmv−1 at standard temperature and pressure (de Gouw and Jimenez, 2009; DeCarlo et al., 2010) which translates into approximately 0.032 to 0.088 g g−1 as summarized in Fig. 1a. We note that ratios for very aged air are very difficult to evaluate with field data, due to the effect of dilution and the difficulty of determining the CO background when 1CO is small, therefore slightly higher asymptotic ratios are possible. This www.geosci-model-dev.net/4/901/2011/
al. (2010) for urban airmasses, whereas for the O/C ratios the observed ratios are those summarized in Dzepina et al. (2011). Curves represent the estimated ratios for OPT, SPR and ROB-like simulations for typical daily average OH concentrations found in Mexico City of 1.5 × 10⁶ molecules cm−3 .
parameterization has been derived using data from regions and plumes dominated by anthropogenic pollution. However, since it was derived by fitting ambient observations, it may include a small contribution from biogenic SOA to the regional background. To explore this plausible range, we evaluate the model predictions for several emission factors including 0.025, 0.050, 0.075, 0.100 and 0.125 g g−1 . A much higher ratio of 0.20 g g−1 was obtained by Spracklen et al. (2011) when optimizing the agreement of their global model with global monthly mean observations, although only 0.02 g g−1 (10 %) were thought to be due to pollution sources and the rest to anthropogenic enhancement of biogenic SOA. Once the VOCA has been emitted, it undergoes oxidation with OH to produce a single non-volatile product that condenses to the aerosol phase assuming a mass yield of 100 %: VOCA +OH→ASOA. The rate constant of this reaction is inversely proportional to the e-folding timescale to form pollution SOA and to reach (after several e-folding timescales) the asymptotic SOA/1CO ratio that was used for the emissions (minus any losses to aerosol deposition). Geosci. Model Dev., 4, 901–917, 2011
32
906
A. Hodzic and J. L. Jimenez : Modeling anthropogenically controlled secondary organic aerosols in a megacity
Table 2. Reactions leading to the production of SOA and its precursors. Reaction rate (molecule−1 cm3 s−1 )
Reaction Production from biogenic precursors at high-NOx conditionsa 1 2 3
ISOP + OH → 0.001*BSOA1 + 0.023* BSOA2 + 0.015*BSOA3 TERP + OH → 0.012* BSOA1 + 0.122*BSOA2 + 0.201*BSOA3 + 0.5*BSOA4 SESQ + OH → 0.075* BSOA1 + 0.15*BSOA2 + 0.75*BSOA3 + 0.9*BSOA4
2.5 × 10⁻¹¹ exp(408/T ) 1.21 × 10⁻¹¹ exp(444/T ) 1.21 × 10⁻¹¹ exp(444/T )
Production from biogenic precursors at low-NOx conditionsa 4 5 6
ISOP + OH → 0.009*BSOA1 + 0.03*BSOA2 + 0.015*BSOA3 TERP + OH → 0.107*BSOA1 + 0.092*BSOA2 + 0.359*BSOA3 + 0.6*BSOA4 SESQ + OH → 0.075*BSOA1 + 0.15*BSOA2 + 0.75*BSOA3 + 0.9*BSOA4
2.5 × 10⁻¹¹ exp(408/T ) 1.21 × 10⁻¹¹ exp(444/T ) 1.21 × 10⁻¹¹ exp(444/T )
Anthropogenically controlled and biomass burning SOA production 7 8
VOCA + OH → ASOA VOCBB + OH → BBSOA
b
1.25 × 10⁻¹¹ 1.25 × 10⁻¹¹
POA ageing 9 10
POAA + OH → OH + ASOA POABB + OH → OH + BBSOA
3 × 10⁻¹² 3 × 10⁻¹²
Acid-enhanced biogenic SOA production 11 12
TERP (SESQ) + SO2 → SO2 + 0.65*BSOAEN ISOP + SO2 → SO2 + 0.65*BSOAEN
c
1 × 10⁻¹⁴ c 1 × 10⁻¹⁴
Anthropogenic pollution-enhanced SOA production 13 14
TERP (SESQ) + VOCA → VOCA + 0.50*BSOAEN ISOP + VOCA → VOCA + 0.50*BSOAEN
c
5 × 10⁻¹⁶ c 5 × 10⁻¹⁶
a : following Lane et al. (2008) methodology, and using the updated mass yields from Tsimpidi et al. (2009). The four oxidation products i.e. BSOA1, BSOA2, BSOA3, BSAO4, have saturation concentrations of 1, 10, 100, and 1000 µg m−3 at 300 K, respectively, and the enthalpies of vaporization of 88 kJ mol−1 for all four species. b : this rate is consistent based on field observations reported by de Gouw et al. (2008) and De Carlo et al. (2010). The value indicated here correspond to the OPT simulation. See
text for details. c : these rates are taken from Spracklen et al. (2011), and resulted in a large amount of enhanced biogenic SOA in their global model simulations.
Typically, the timescale is of the order of one day (de Gouw et al., 2005; Brock et al., 2008; Kleinman et al., 2008; DeCarlo et al., 2010). In the Mexico City region the average 24-h OH concentrations are ∼1.5 × 10⁶ molecules cm−3 both for the observations (C. Cantrell, NCAR, personal communication, 2008), and for the model (Hodzic et al., 2009, Fig. 9). Given these values, the reaction rate derived by Spracklen et al. (2011) results in a time constant of ∼1.5 days which is somewhat larger than observations. In order to cover a wide range of possible values and assess the sensitivity to this parameter, three rate constants are considered: k1 = 5 × 10⁻¹² cm3 molecules−1 s−1 , −12 k2 = 1 × 10 cm3 molecules−1 s−1 and k3 = −12 3 25 × 10 cm molecules−1 s−1 . In addition, the formation of ASOA from the ageing of primary organic aerosols through the evaporation of POA and the oxidation of its vapors in the gas-phase (Robinson et al., 2007) is represented as a direct oxidation of POA to ASOA assuming the POA half-life time of 2 days. As Geosci. Model Dev., 4, 901–917, 2011
this ageing is OH-dependent, we introduced this dependence through the following reaction POA+OH->ASOA with k = 3 × 10⁻¹² cm3 molecules−1 s−1 . This results in a timescale of ∼2.5 days which is roughly consistent with observations and other model results (Dzepina et al., 2009; Spracklen et al., 2011). The ASOA produced by this pathway conserves the size distribution of its parent POA species. Note that the amount of anthropogenic SOA formed via direct POA oxidation is small, as most of the SOA in the Robinson mechanism is formed by oxidation of gas-phase species co-emitted with the POA. A similar approach as for anthropogenic SOA is adopted for biomass burning SOA formation. The VOCBB /CO emission ratio and reaction rate for the oxidation of VOCBB into BBSOA were varied as described above (together with the parameters for ASOA) in order to determine the set of parameters that reproduces the best the observed OOA values. The ageing of primary organic aerosols emitted by fires is also accounted using same OH-dependent rate discussed above.
www.geosci-model-dev.net/4/901/2011/
A. Hodzic and J. L. Jimenez : Modeling anthropogenically controlled secondary organic aerosols in a megacity 2.4
Empirical approach for predicting oxygen-to-carbon (O/C) ratios
In addition to parameterizing the SOA mass, we have also derived an empirical approach to compute the oxygen-tocarbon ratio for organic aerosols. The measured O/C ratio is a good indicator of the level of processing of the organic material. Being able to accurately predict O/C ratios in models is of great importance for determining the hygroscopicity of organic particles (Jimenez et al., 2009) and their effects on CCN activation and clouds. As previously, we have parameterized the ageing patterns observed in O/C ratio as illustrated in Fig. 1b to fit the O/C observations reported for Mexico City and its outflow region (Dzepina et al., 2011). Typically, the O/C atomic ratios vary from very low (∼0.1) for primary emitted organics, to levels close to 0.35–0.4 in freshly formed SOA, and up to 0.8–1 for aged air masses that contain more processed organic material. For this purpose the oxygen amount and its increase due to organic aerosol ageing were explicitly modeled in the OPT simulation, adding an additional transported variable into the model. The increase in O/C ratios in SOA particles due to ageing of the aerosol was parameterized according to the following equation: O/C = 1 − 0.6exp(−A/1.5) where A represents the photochemical age of the airmass in days and 1.5 is the aging time scale for Mexico City conditions. At each model time step, we estimate the photochemical age of the existing aerosol material from the O/C ratios, and then further age the OA for the chemical time step proportionally to the incremental exposure ([OH] × time step) divided by the reference exposure (1.5 days × 1.5 × 10⁶ molecules cm−3 ). The O/C ratio for fossil POA is assumed to be equal to 0.1, whereas for the biomass burning value of 0.3 is used (DeCarlo et al., 2008). 2.5
Anthropogenically-enhanced SOA formation from biogenic precursors
Similar to Spracklen et al. (2011) we also test several simple mechanisms to test whether a large enhancement of biogenic SOA in presence of anthropogenic pollutants could explain the spatial and temporal patterns of the SOA observed in and around Mexico City. Besides the enhanced oxidant levels due to pollution which are already accounted for by the default model formulation (Hodzic et al., 2009), possible reasons for this enhanced BSOA formation are high aerosol acidity or NOx levels (Hoyle et al., 2011; Spracklen et al., 2011). Following Spracklen et al. (2011), an acidenhanced formation of SOA from terpenes and isoprene was represented using SO2 as a surrogate for aerosol acidity (Table 2, Reactions 11–12). In addition a reaction with VOCA is used as a surrogate for reactions with anthropogenic pollution species with a lifetime of 1–2 days (including NOx ) (Table 2, Reactions 13–14). We note that in Mexico the main sources of SO2 (volcanoes and refineries, DeCarlo et www.geosci-model-dev.net/4/901/2011/
907
al., 2008) and VOCA (urban areas) are not collocated, so these two approaches should produce slightly different spatial patterns. 2.6
Model application
First, a set of 15 model simulations was carried out in order to estimate the optimum parameters for the VOCA /CO emission ratios and the rate constant for VOCA conversion into ASOA. The 24–30 March time period with low biomass burning influence (Aiken et al., 2010) was chosen to perform this comparison with AMS data. The same set of ground and airborne AMS data was used in this study as described in Hodzic et al. (2010a). Those include the urban T0 site, the suburban T1 site and the regional C130 flight of 29 March. For these comparisons, biogenic SOA formation was represented as in Hodzic et al. (2009, 2010a), because this parameterization was found to produce a reasonable amount of biogenic SOA when compared to biogenic SOA tracers and contemporary carbon data. Second, the “optimum” simulation (hereafter referred to as OPT) using the optimized emission ratio and rate constant is performed for the 18–30 March time period, for which the first week includes high biomass burning influence (Aiken et al., 2010). The predicted SOA from the empirical model is compared to the SOA results from our previous study (Hodzic et al., 2010a, referred as ROB) which used a more complex SOA module that accounts for SOA formation from traditional VOC using the 2-product traditional approach and from semi-volatile and intermediate-volatilities species using the approach of Robinson et al. (2007). The predicted SOA from the OPT simulation is also compared to the one modeled using the best-fit parameters from Spracklen et al. (2011), referred as the SPR simulation. For consistency with our previous simulations (ROB), the biogenic SOA is based on Hodzic et al. (2009). The evolution of O/C ratio was added to the OPT model and the simulation dedicated to evaluating the predicted O/C ratios against observations was performed from 16 to 25 March. Finally, an additional simulation (TEST) was performed to investigate the NOx -dependent biogenic SOA formation and its potential enhancement under polluted conditions. Similar to Spracklen et al. (2011), this enhancement was parameterized in two alternative ways as discussed above. The biogenic SOA predicted from this approach was compared to results from our previous work (Hodzic et al., 2009). It should also be noted that by applying this empirical first order SOA modeling approach the computational cost of the model has significantly decreased compared to the simulations including the volatility basis set (per Robinson et al., 2007) presented in Hodzic et al. (2010a). Indeed, to represent the SOA formation from anthropogenic and biomass burning sources, here we only need to track 2 gas-phase precursor species and 2 product species (ASOA and BBSOA) in each aerosol size bin (total 18 species), whereas the full volatility Geosci. Model Dev., 4, 901–917, 2011
908
A. Hodzic and J. L. Jimenez : Modeling anthropogenically controlled secondary organic aerosols in a megacity
basis set require 18 product species in each aerosol size bin, and an additional 18 gas-phase species (total 162 species). For simulations that also track the oxygen to carbon ratio like in Hodzic et al. (2010a), the difference is even larger i.e. 27 vs. 324 species. Simulations using the simplified basis set formulation of Shrivastava et al. (2010) would require 36 species, or 72 when oxygen to carbon ratio is also tracked.
3.2
3
3.2.1
3.1
Results and discussion Selecting the optimum empirical parameterization for anthropogenic SOA
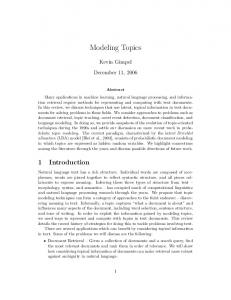
Figure 2 summarizes the statistical parameters of the model/measurement comparison for fifteen model runs in simulating SOA at the surface (T0, T1 sites) and in air aloft over the city and its outflow (C130 flight, 29 March), as a response to varying VOCA emissions (5 values) and oxidation rate constants (3 values). Each simulation was assessed against observed OOA concentrations using root mean square error and correlation coefficients as indicators of model skill, during the low biomass-burning period (24 to 30 March 2006). Emissions of VOCA /CO in the 0.05–0.10 g g−1 range and a rate constant at or above 5 × 10⁻¹² cm3 molecules−1 s−1 results generally in lower RMSEs and high correlation coefficients for 2 of the 3 datasets. At the T1 suburban site, however, the amount is matched well by the parameter range just discussed, but the correlation coefficient improves for very low emission and reaction rates. Given the overall results and the relatively wide response surfaces of the statistical parameters, we chose as the optimum combination of parameters for simulating SOA from anthropogenically-dominated sources a VOCA /CO emission ratio of 0.08 g g−1 and a rate constant of 1.25 × 10⁻¹¹ cm3 molecules−1 s−1 (e-folding time constant ∼0.6 days in the typical Mexico City boundary layer). These values are within the range of the measurement-derived amounts and timescales (de Gouw and Jimenez, 2009; DeCarlo et al., 2010) and will be used to represent SOA formation from anthropogenic and biomass burning sources in the rest of the paper (OPT simulation). As the merit functions are relatively broad and there is an anti-correlation between amount and timescale and most response surfaces, slightly different sets of parameters are likely to result in similar fits to the observations. This amount of anthropogenic SOA is not inconsistent with the Mexico City emission inventory. E.g. the ratio of VOCA to the traditional anthropogenic SOA precursors (aromatics, large alkanes) is 30 %. Note that with this implementation the amount of biomass burning SOA is about twice that observed by DeCarlo et al. (2010), which will compensate the underprediction of some biomass burning events in the model (e.g. Hodzic et al., 2010b).
Geosci. Model Dev., 4, 901–917, 2011
Spatiotemporal patterns and comparison to volatility basis set
In this section the skill of this empirical SOA module in reproducing the observed SOA levels is assessed against the AMS observations within the city and in the city plume, and against the results of the more complex VBS approach of Robinson et al. (2007) reported in Hodzic et al. (2010a). SOA spatial distribution
Figure 3 compares the predicted spatial distribution of anthropogenic and biomass burning SOA surface concentrations averaged over the 24–30 March period. Similar spatial patterns of SOA concentrations are predicted for the OPT and ROB simulations for the urban and near outflow regions, with highest values associated with the Mexico City basin and downwind locations. The OPT model generates on average about ∼6 µg m−3 of SOA in downtown Mexico City, and ∼3 µg m−3 downwind. The OPT simulation predicts ∼2 µg m−3 higher peak SOA concentration over Mexico City in comparison to the ROB simulation. This difference in averaged concentrations is mainly due to higher early afternoon concentrations predicted by OPT as illustrated in Fig. 4. In the outflow region to the north and south of Mexico City basin, the OPT and ROB simulations show similar SOA concentrations. These similarities are expected as both mechanisms have result in amounts and timescales of the same order, whether SOA is directly generated from the first oxidation of precursor species and then transported as an inert species (OPT), or the SOA is produced from the multigenerational oxidation of organic vapors (ROB). The ageing of POA that is included in the OPT simulation does not increase significantly the SOA concentrations downwind at the considered spatial scale in this study (not shown here), as expected from the low POA/CO emission ratios of anthropogenic sources. 3.2.2
SOA temporal patterns
A comparison of the observed and predicted SOA time series at the surface during 18–30 March is shown in Fig. 4a– b. The OPT model reproduces fairly well the overall amount of OOA and captures much of its temporal variability. The results are somewhat similar to the ROB predictions with however a more sustained daytime SOA production for OPT. At the urban T0 site (Fig. 4a), the statistical figures-of-merit are comparable for both runs with the model bias (RMSE) of −1.8 µg m−3 (4.7 µg m−3 ) for OPT and −2.9 µg m−3 (5.4 µg m−3 ) for ROB, consistent with the overall agreement within 30 % with the observations. The increase in the correlation coefficient from 0.59 to 0.65 indicates a slightly more consistent temporal correspondence between OPT model and observations compared to ROB. The photochemical production of SOA in the late morning www.geosci-model-dev.net/4/901/2011/
A. Hodzic and J. L. Jimenez : Modeling anthropogenically controlled secondary organic aerosols in a megacity
909
859
860 861 862 863 864
Figure 2: (Upper panel) Root mean square errors (RMSE) and (Lower panel) correlation coefficients for SOA predictions for 15 model
Fig. (Upper panel) of Root errors (RMSE) and (Lower panel) correlation coefficients for SOA predictions for 15 model runs as a runs2.as a function themean VOCsquare A surrogate emission factor and its oxidation rate constant. The statistical parameters are calculated for function of the VOCA surrogate emission factor and its by oxidation rate constant. The statistical areused calculated for OPT the 24–30 March are also the 24-30 March period, which is characterized low biomass burning activity. parameters Parameters for the simulation indicated on each plot (star by symbol). period, which is characterized low biomass burning activity. Parameters used for the OPT simulation are also indicated on each plot (star symbol).
(∼09:00–11:00 LT, ∼8–9 µg m−3 ) and the dilution in the growing afternoon boundary layer are remarkably well captured by OPT. The predicted diurnal profile matches both in shape and amounts the OOA observations. The improvements with regard to ROB are mainly seen during the initiation of the photochemistry (∼09:00 LT) and in the late afternoon (∼13:00–16:00 LT). Indeed, the SOA production starts more intensely (additional 3 µg m−3 ), and is maintained throughout the afternoon in the OPT model while higher temperatures cause some SOA to evaporate in the ROB model. The temporal pattern of the urban observations in the afternoon is more similar to OPT than ROB, which is consistent with the lower volatility of the observed SOA compared to that produced by ROB (Cappa and Jimenez, 2010; Dzepina et al., 2011; Riipinen et al., 2011; Pierce et al., 2011). Finally, during the nighttime, the OPT predicted background concentrations are lower by 0.5–1 µg m−3 than ROB. This is likely caused by enhanced partitioning of semivolatile species to the particle phase in ROB at the lower temperature of this time period, while this effect is not captured by the OPT model formulation. At the T1 suburban site (Fig. 4b), the OPT simulation has ∼1 µg m−3 lower bias and
www.geosci-model-dev.net/4/901/2011/
a slightly higher correlation coefficient than ROB. The contribution of biomass-burning emissions to the predicted SOA stays relatively small during this period at both surface sites (not shown here). The average contribution to the total SOA approaches 0.5 µg m−3 (