patterns are derived from web logs that are enriched with 3 sorts of ... Nowadays almost every company âor organizationâ has its own website that plays.
Modeling Navigation Patterns of Visitors of Unstructured Websites K. Balog P. Hofgesang W. Kowalczyk Department of Computer Science Free University Amsterdam De Boelelaan 1081A, 1081HV Amsterdam The Netherlands {balog, hpi, wojtek}@few.vu.nl Abstract In this paper we describe a practical approach for modeling navigation patterns of visitors of unstructured websites. These patterns are derived from web logs that are enriched with 3 sorts of information: (1) content type of visited pages, (2) visitor type, and (3) location of the visitor. We developed an intelligent Text Mining system, iTM, which supports the process of classifying web pages into a number of pre-defined categories. With help of this system we were able to reduce the labeling effort by a factor 10-20 without affecting the accuracy of the final result too much. Another feature of our approach is the use of a new technique for modeling navigation patterns: navigation trees. They provide a very informative graphical representation of most frequent sequences of categories of visited pages.
1.
Introduction
Nowadays almost every company “or organization” has its own website that plays an important role as a source of information about the company itself, its products, services, etc. Websites, due to their accessibility that is fueled by powerful search engines and by the global nature of the Internet, are often used as an important marketing instrument or as yet another communication channel through which companies exchange information with their (potential) clients. Not surprisingly, some companies put a lot of effort in making their websites attractive, well organized, efficient – sites that meet (or exceed) visitors’ needs and expectations. Development of such successful sites is usually an iterative process during which the developers get some feedback from users of the current version of the site: which pages are visited most frequently? by whom? when? what is the typical order in which pages are visited? which sequences led to an action (such as placing an order, request for an offer or information)? Etc. A popular way of getting feedback from visitors is the analysis of log files that are generated by web servers. Unfortunately, log files contain only very elementary
data: the IP-address of the visitor, the date and time of the page request, its URL and the status of the request, to mention the most important ones. Therefore, whenever possible, log files are enriched by additional data like content information of visited pages, personal information about visitors, or the visitors’ “externally measured” behavior (like taking a loan after several visits to the bank's website). Some organizations use special mechanisms to collect such additional data. For example, URLs of pages from a web-shop may contain codes that refer to specific products or product categories; an e-bank may impose a login procedure for their clients, etc. The situation is quite different when the site has no clear structure, for example, when various types of documents are allowed or when there are (almost) no restrictions imposed on topics that are presented on pages. For example, a website of a university may contain thousands of pages that are maintained by staff members, students, administration, and last but not least, by designated webmasters. These pages may contain some general information about the organization of the university, various research and educational materials, but they may also contain information about students’ hobbies, favorite restaurants, travellogs, photo albums, etc. In this paper we address the problem of modeling navigation patterns on such highly unstructured websites. Our approach involves two steps. First, we semi-automatically label all pages of the given website into a predefined number of categories. To minimize the human labeling effort we developed an interactive text mining tool, iTM, which combines several methods of active learning and text mining algorithms. With help of this system it is possible to reduce the labeling effort by a factor 10-20 without affecting the accuracy of the final result too much. For example, using the iTM system we were able to categorize about 13.000 pages of our faculty website within a few hours, labeling manually only 500 documents. The second step involves developing graphical models, that we call navigation trees, for various groups of users. A navigation tree is a graphical representation of typical sessions and their statistical properties: nodes correspond to types of visited pages, links correspond to transitions from one page type to another, and weights that are assigned to links reflect conditional probabilities of such transitions. Our approach is illustrated by two cases. In the first case we analyze navigation patterns of various groups of visitors of our faculty site: www.cs.vu.nl. The second case concerns analyzing visiting behavior of clients of an investment bank. Clients of this bank were grouped into different categories, depending on their investment strategies, age, status, etc. Using our approach it was possible to establish some relations between different groups of clients and their visiting behavior.
2.
Related Work
The modeling of behavior of web users is often labeled as Web Usage Mining, which, together with Web Content Mining and Web Structure Mining forms a new,
dynamic field of research called Web Mining; see the survey of Kosala and Blockeel, [12]. A general framework for the whole web usage mining task, WEBMINER, is presented in [14]. Several models that are based on page access frequency analysis and modified association rules are presented in [1, 17, 22]. Xing and Shen [21] proposed two algorithms (UAM and PNT) for predicting user navigational preferences, both based on page visits frequency and page viewing time. Nanopoulos and Manolopoulos [15] present a graph-based model for finding traversal patterns on web page access sequences. They introduce one level-wise and two non-level wise algorithms for large paths exploiting graph structure. While most of the models work on global “session levels”, an increasing number of researches show that the exploration of user groups or clusters is essential for better characterization: Hay et al. [9] suggest Sequence Alignment Method (SAM) for measuring the distance between sessions. The proposed distance measure represents the number of edit operations (insertion, deletion, replacement) that are required to transform one session into another. SAM distance-based clusters form the basis of further examinations. Chevalier et al. [6] suggest rich navigation patterns consisting of frequent page set groups and web user groups based on demographical patterns. They show the correlation between the two types of data. Other researchers point far beyond frequency based models: for example, Cadez et al. [5] propose a finite mixture of Markov models for modeling sequences of URL categories that are traversed by users. There are numerous commercial software packages for deriving statistical patterns from web logs, [20]. They focus mostly on highlighting log data statistics and frequent navigation patterns but in most cases do not explore relationships among relevant features. Pei et al. [17] propose a data structure called the web access pattern tree (WAPtree) for efficient mining of access patterns from web logs. WAP-trees store all the frequent candidate sequences that have a support higher than a preset threshold. The information that is stored in a WAP-tree includes labels and frequency counts for nodes. In order to mine useful patterns in WAP-trees they present a WAP-mine algorithm that applies conditional search for finding frequent events. The WAP-tree structure and the WAP-mine algorithm together offer an alternative for apriori-like algorithms. Jenamani et al. [11] use a semi-Markov process model for understanding ecustomer behavior. Their method uses two matrices: a transition probability matrix P and a matrix M that holds the mean time between transitions. In this way this probabilistic model is able to model the time elapsed between transitions. Some papers present methods based on content assumptions. Baglioni et al. [3] use URL syntax to determine page categories and to explore the relation between users’ sex and navigational behavior. Cadez et al. [5] experiment on categorized data from Msnbc.com. Visualization of frequent navigation patterns makes human perception easier. Cadez et al. [5] present a tool, WebCanvas, for visualizing Markov chain clusters. This tool represents all user navigational paths for each cluster, color-coded by page categories.
A good survey of automated text categorization techniques can be found in [18]. Boosting performance of text classifiers with help of unlabeled data is presented in Nigam at al. [16], while [2] describes some strategies for active sample selection in the context of text mining. Two approaches for automatic classification of web pages are presented in [8] and [13]. Both are based on the idea of using public web directories (e.g., provided by Yahoo!, www.yahoo.com, or LookSmart, www.looksmart.com) as labeled collections of training documents and applying some text mining algorithms for developing classification procedures.
3.
Web Mining Process
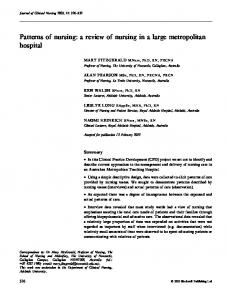
The whole process of extracting patterns from web related data involves several steps that are depicted in Figure 1. INPUT DATA
DATA PREPARATION
SESSION IDENTIFICATION
VISUALIZATION 3
DATA FILTERING
2
Web server’s access log data
5
4
Identified sessions for group 1 DATA INTEGRATION
DATABASE
Tree model 1
...
...
Geographical and organizational information
3
2
W W W
iTM CLASSIFIER Web pages
4
Identified sessions for group N
4
5
Tree model N
Figure 1. An overall scheme of the web mining process
The input data consists of three types of data sets: (1) access log files, (2) a collection of all pages from a website, and (3) tables that link selected IP-addresses to user types or their locations. The first step of data preparation involves cleaning, filtering and pre-processing access logs. This step, although quite tedious is well described in the literature, see e.g., [14]. In the second step the iTM system is used to effectively categorize all pages from the given website. As a result we obtain a conversion table with URLs of site's pages and their categories. We combine this information and load them into a database together with the extra information about the users. Session identification results in a collection of raw sessions: sequences of visited pages. By session we mean here a sequence of types of pages that were visited by the same user without breaks longer than a pre-specified time interval. Moreover, sessions can be grouped by the type of corresponding users (e.g., students, staff members) or their locations. As a last step we visualize the sessions extracted for different groups by the means of the navigation tree models.
4. Categorization of Web Pages When modeling navigation patterns on an unstructured website we are more interested in types of visited pages rather than in specific pages themselves. For example, we would like to put all pages that contain some teaching material into one category, while home pages of university staff members could form another category. In some situations, when the site is not too big, one could assign categories manually. However, in the case of sites with thousands of pages such an approach would not be feasible. Instead of labeling all the pages, one could label only a relatively small but representative sample, use that sample as a training set for building a classification model and apply that model to the remaining pages. This approach can be further improved by applying various techniques that would minimize the size of the training set (and therefore also the manual labeling effort) without adversely affecting the accuracy of the final model. There are two prominent methods of reducing the size of the training set: active learning, [2], and clever use of unlabeled data in the training process, [16]. The essence of active learning is a dynamic selection of cases for labeling: at each step the current model (or a collection of models) is applied at all unlabeled cases to identify those that are most difficult to classify; a supervisor is then asked for their (true) labels. Unlabeled documents can be used to improve the quality of statistical estimates of model parameters. This is achieved by combining the (supervised) Naïve Bayes classification procedure with the (unsupervised) Expectation Maximization algorithm. In this section we present an interactive document labeling and categorization system, iTM that combines several machine learning and text mining techniques to minimize the human effort that is needed to build a high quality text classifier. Using this system we were able to categorize about 13.000 pages of our university site into 13 categories just in a matter of a few hours by manually labeling only 500 pages that were selected by the system. The iTM system supports the process of building text classifiers from unlabeled collections of documents by providing the user with a number of tools and options to minimize his/her time spent on labeling selected documents. It operates in three steps: 1) Initial sample selection. Here a small collection of documents is presented to the user, the documents are labeled and an initial classifier is constructed. 2) Active learning. The system iteratively selects a few unlabeled documents that are “most difficult” for the current classifier; after labeling them by the user, a new classifier is constructed. 3) Boosting model accuracy with help of unlabeled data. The collection of documents that were already labeled is used together with some remaining (unlabeled) documents for building the final model. Now we will briefly describe some details.
3.1. Initial Sample Selection The iTM system supports three methods of selecting the initial sample: manual, random, and with help of the k-means clustering. The first two methods are straightforward: either the user selects, for each category, a few representative pages or pages are selected at random. The third method works as follows: the clustering algorithm finds k clusters of similar documents and from each cluster a document that is closest to its center is selected. In this way k documents that are relatively far away from each other are selected. The similarity between two documents is measured here by the inner product of their normalized vector representations, where every vector component (word) is weighted by the TFIDF factor, see [18].
3.2. Active Learning Given an initial collection of labeled documents a classifier is constructed and applied to all unlabeled documents. The classifier, when applied to a document, returns, for each category, a value that represents confidence (or likelihood) that the document belongs to the category. Therefore, documents are classified with varying level of confidence. The essence of active learning is to focus on documents for which the classifier is least confident: these documents should be labeled by a "teacher", the classifier should be retrained, and the whole process of selecting most difficult cases repeated. To define a "difficulty measure" we need some notation. Suppose that we work with C categories: 1, ..., C. Then the classifier can be used to rank all unlabeled documents with respect to each category, so for each document a rank vector r=[r1, ..., rC] can be determined, where ri denotes the rank of a given document with respect to class i. (The smaller the rank the more likely the document belongs to the given category.) Now we can define, for every document, the variance of ranks v as the variance of the vector r: C
v = ∑ (r − ri ) 2 . i =1
Clearly, the smaller the variance the more difficult it is to decide on document's category. Another strategy for selecting the most difficult documents is to develop two classifiers using different algorithms and then measure, for every document, the degree of disagreement between them: C
v = ∑ (r1,i − r2,i ) 2 , i =1
where r1 and r2 are normalized document rank vectors that correspond to the two classifiers. This time, the bigger the value of v the more difficult the document is. The current version of iTM uses two classification algorithms: Naïve Bayes, [16], and Boostexter, [17]. Several other strategies for selecting the "hardest" document are proposed in [2], where at each stage an ensemble of classifiers is developed and the degree of disagreement is determined by voting.
3.3. Use of Unlabeled Data Most algorithms for supervised learning operate on training sets with all cases labeled. However, as it is shown in [19], unlabeled data can significantly improve the accuracy of the final model. We have implemented two strategies for incorporating unlabeled data in the training process. Both are based on the same principle: given a classifier, all unlabeled documents are scored and those that are "easiest to classify" are labeled (by the classifier) and added to the new training set. We use the same measures of document "easiness" as in case of active learning: the variance of ranks and the degree of disagreement. Additionally, a threshold that determines a required level of document "easiness" has to be provided by the user.
3.4. The iTM System The iTM system has been implemented in Java and can be obtained under the GNU public license from http://balog.hu/itm/. It is equipped with a powerful graphical user interface and in addition to the functionalities that were described above it offers some other features: several document conversion schemes, tools for selecting words (and their weights) that form a vocabulary, document and model browser, etc. Finally, the system can be used in a noninteractive mode. This is especially useful when one wants to experiment with various learning strategies. A more detailed description of the iTM system can be found in [4].
5.
Tree Representation of Navigation Patterns
In our approach we model navigation patterns by a tree that represents sessions from a selected group of users. The root of the tree is a special node that represents the (abstract) starting point of each session. Remaining nodes are labeled by categories of visited pages (one category per node) together with their frequencies. Links correspond to transitions from one page category to another. In other words, every session is embedded in the tree: types of visited pages are mapped into nodes and every visited page increments the count variable that is stored by the corresponding node. Thus, if there are C possible categories the branching factor of the tree is at most C. The height of the tree is the same as the length of the longest session. The following pseudo-code describes the construction of navigation trees:
Input: a collection of sessions (sequences over the set of categories {1, ..., C}) Initialization: root.count=0; root.children=[]; Main loop: for each session s root.count++; current_node = root; for i = 1..length(s) if exists(current_node.children[s[i]]) current_node = current_node.children[s[i]]; current_node.count++; else current_node.children[s[i]] =new node; current_node = current_node.children[s[i]]; current_node.count =1; end end Let us notice that the algorithm has linear time complexity (in the size of the input set). A complete navigation tree is usually very big and contains branches that correspond to some isolated sessions. Therefore, to capture typical (frequent) patterns the tree should be pruned. This can be achieved by removing all nodes with counts smaller than a pre-specified threshold. It is very informative to visualize (pruned) navigation trees. We have implemented several visualization procedures that plot trees using the following conventions: 1) nodes are labeled with page categories; additionally, different colors are used to represent different categories, 2) links represent transitions between categories; their thickness reflect the percentage of sessions that pass through them, 3) links leaving the same node are plotted with different shades of the black color to reflect the distribution of the corresponding sessions. Additionally, various textual data can be attached to nodes and links, e.g., absolute counts, relative percentages, short category names, etc. Three examples of visualizations of navigation trees are shown in Figure 2, 3 and 4. Finally, let us notice that to get an insight into various groups of users several trees should be generated and analyzed: groups determine subsets of sessions and for each subset a tree can be constructed and analyzed, possibly with various values of the pruning threshold.
6.
Case Study
In the following we present two experiments. In the first case study we applied the techniques that were described in the previous sections to analyze navigation patterns of visitors of the website of our department: www.cs.vu.nl. We present a real life application of the navigation tree model in the second experiment. We visualize the frequent navigation paths of the clients of a bank.
6.1
Analysis of www.cs.vu.nl
Three sorts of data were used: access log data that were collected over a period of one month (in total about 7 million records with the total size of 1.5GB), a collection of 13.000 pages that were classified with help of iTM into 13 categories (see Table 2), and data about geographical location and organizational membership (student, staff) of visitors. The geographical locations were obtained from session IP-addresses by mapping them to the corresponding top level domains (country codes). Similarly, using some internal information about the structure of IPaddresses of computers used at the university, we could label some visitors as students or staff members. The log files were transformed into user sessions, and page URLs were replaced by the corresponding page categories. Table 1 contains some characteristics of the 4 main groups of visitors: staff, students, domestic, and foreign. Finally, we produced a number of navigation tree models for various groups of users using different values of the pruning parameter s. Figure 2 presents a navigation tree that was constructed for the group of all visitors. We can see that the most important pattern is that the visitors (29.2%) start at a home page of a faculty member and then (7.8%) go to a (probably the same person’s) publication page. Many visitors start directly at publication pages, likely following links provided by a search engine. The big proportion of visits to student pages was most likely generated by students of our department.
Group name All Location: Domestic Foreign Organization: Staff Students
Number of sessions 165 778
Session length std. avg max deviation 2.7 2 299 9.2
39 671 79 750
3.39 2.4
275 352
7.29 4.74
2 795 3 123
5.5 4.47
193 134
11.41 6.36
Table 1. Distribution of sessions for main groups of visitors
Category photo miscellaneous E/reference E/department E/project E/person/faculty E/person/student E/person/faculty publication D/course D/person/student other_language documents
other documents
Description negligible quantity of textual information with one or more images pages with absent or insufficient content. (e.g., framesets, empty files, file lists, etc.) e-books or manual pages for differrent systems or programs department pages in English research projects of the computer science department pages of the faculty members (fields of research, professional background, research projects) student pages (contain personal information like hobby, lyrics, etc.) publications of faculty members comprising at least the abstracts course pages in Dutch student pages (contain personal information like hobby, lyrics, etc.) pages written in other languages than English or Dutch documents in PDF or PS format (scientific papers, publications, ebooks, etc.) documents in doc, ppt, xls, rtf, txt format (administrative papers, forms, course materials etc.)
Table 2. Content categories of web pages (E=English; D=Dutch)
Figure 2. Navigation tree of all visits from all places
A navigation tree for visits initiated from the Netherlands is shown in Figure 3. It shows that pages in Dutch were most frequently visited by members of this group. The relatively large number of student and course pages suggests that students visiting from home are highly represented within this group.
Figure 3. Navigation tree of all domestic visits
The analysis of other navigation trees (not shown in this paper) showed that the most significant pattern was a visit to a faculty member’s home page followed by her/his publication page. This pattern was represented in all groups, but it was most pronounced within the “foreign” group, most likely formed by researchers from abroad. A more detailed presentation of our findings can be found in [10].
6.2
Visualizing client behavior of a bank
We applied the navigation tree model to the web data of an investment bank. The clients of the bank are classified into several categories based on their investment profiles. The marketers of the bank were interested in how the clients in the different categories behave on the website. Since the website is well structured and the clients are required to log in, the data pre-processing was straightforward. Here we only present the visualization results. Figure 4 presents a navigation tree model of the sessions of one of the client groups for a given period. The tree is a compact representation of 272683 sessions with 2% of support threshold. It shows that there were two popular starting pages: 62.1% of the clients started at the home page and 34.5% of them started at the login page. The navigation tree immediately shows, following the thick, black arrows, that the most frequently visited path started at the home page and was followed by the log in process and then contained a visit to the home page again, the personal home page, the portfolio overview and finally to an overview of the transaction history.
Figure 4. Visualization of client behavior of a bank
7.
Conclusions
We described a practical approach for modeling navigation patterns of different groups of visitors of unstructured websites. To enrich access log data with content type of visited pages we developed an interactive text mining tool, iTM. Additionally, we proposed a simple method of visualizing frequent paths with the help of navigation trees. Using this approach we were able to analyze the behavior of several groups of visitors of our department's site. It turned out that with help of iTM we could categorize a large collection of pages from our site with a relatively small effort–a few hours of work were sufficient to manually label 500 pages (from the total collection of 13.000). Our framework is also suitable for modeling changes in visitors’ behavior over time. The changes in website organization or content can be easily handled with iTM: with a relatively small effort one can create a new labeling of all pages. The remaining tasks of data preparation, construction of navigation trees and their visualization are already fully automated.
References 1.
Agrawal, R., Imielinski, T., and Swami, A. (1993), Mining association rules between sets of items in large databases. In Proceedings of the ACM SIGMOD Conference on Management of Data, pages 207–216.
2.
Argamon-Engelson, S. and Dagan, I. (1999). Commitee-based sample selection for probabilistic classifiers. Journal of Artificial Intelligence Research, (11):335-360, 1999.
3.
Baglioni, M., Ferrara, U., Romei, A., Ruggieri, S., and Turini, F. (2003), Preprocessing and Mining Web Log Data for Web Personalization. 8th Italian Conf. on Artificial Intelligence vol. 2829 of LNCS, p.237-249.
4.
Balog, K., (2004). An Intelligent Support System for Developing Text Classifiers. MSc. Thesis, Vrije Universiteit Amsterdam, The Netherlands.
5.
Cadez, I. V., Heckerman, D., Meek, C., Smyth, P., and White, S. (2003), ModelBased Clustering and Visualization of Navigation Patterns on a Web Site. Data Mining and Knowledge Discovery, vol.7 n.4, p.399-424.
6.
Chevalier, K., Bothorel, C., and Corruble, V. (2003), Discovering rich navigation patterns on a web site. Proceedings of the 6th International Conference on Discovery Science Hokkaido University Conference Hall, Sapporo, Japan.
7.
Cooley, R., Mobasher, B., Srivastava, J. (1999), Data Preparation for Mining World Wide Web Browsing Patterns. In Knowledge and Information System, vol.1(1), pages 5-32.
8.
Dumais, S.T., and H. Chen (2000). Hierarchical classification of web content. Proceedings of the 23rd Annual International ACM SIGIR Conference on Research and Development in Information Retrieval (SIGIR'00), August 2000, pages 256-263.
9.
Hay B., Wets, G., and Vanhoof K. (2003), Segmentation of visiting patterns on websites using a sequence alignment method. Journal of Retailing and Consumer Services vol.10, p.145–153.
10.
Hofgesang, P.I., (2004). Web usage mining. Structuring semantically enriched clickstream data. MSc. Thesis, Vrije Universiteit Amsterdam, The Netherlands.
11.
Jenamani, M., Mohapatra, P.K.J., and Ghose, S. (2003), A stochastic model of ecustomer behaviour. Electronic Commerce Research and Applications vol.2, p.81–94.
12.
Kosala, R., and Blockeel, H. (2000). Web mining research: A survey, SIGKDD Explorations. Newsletter of the ACM Special Interest Group on Knowledge Discovery and Data Mining 2 (1), pp. 1-15, July, 2000.
13.
Mladenic, D. (1998). Turning Yahoo to Automatic Web-Page Classifier. In H. Prade, editor, Proceedings of the 13th European Conference on Artificial Intelligence (ECAI98), pages 473-474.
14.
Mobasher, B., Jain, N., Han, E., and Srivastava, J. (1996), Web Mining: Pattern discovery from World Wide Web transactions. Technical Report TR 96-050, University of Minnesota, Dept. of Computer Science, Minneapolis.
15.
Nanopoulos A., Manolopoulos Y. (2001), Mining patterns from graph traversals. Data and Knowledge Engineering No. 37, pages 243-266.
16.
Nigam, K., McCallum, A.K., Thrun, S., and Mitchell, T. (2000). Text classification from labeled and unlabeled documents using EM. Machine Learning, Kluwer Acedemic Press, 39(2/3),pages 103-134.
17.
Pei, J., Han, J., Mortazavi-asl, B., and Zhu, H. (2000), Mining Access Patterns Efficiently from Web Logs. Proceedings of the 4th Pacific-Asia Conference on Knowledge Discovery and Data Mining, pages 396-407.
18.
Sebastiani, F. (2002), Machine learning in automated text categorization. ACM Computing Surveys, 34(1), pages 1-47.
19.
Schapire, R.E. and Singer, Y. (2000). Boostexter: A boosting-based system for text categorization. Machine Learning, 39(2/3), pages 135-168.
20.
Web Mining and Web Usage Mining Software, http://www.kdnuggets.com/software/web.html
21.
Xing, D., and Shen, J. (2004), Efficient data mining for web navigation patterns. Information and Software Technology vol.46, pages 55–63.
22.
Yang, Q., Li T.I., and Wang K. (2003), Web-log Cleaning for Constructing Sequential Classifiers. Applied Artificial Intelligence vol. 17, issue 5-6, pages 431-441.