Modeling Sparse Engine Test Data Using Genetic Programming Tina Yu
Jim Rutherford
Chevron Information Technology Company 6001 Bollinger Canyon Road San Ramon, CA 94583 U. S. A. 001-925-842-2393
Chevron Oronite Company LLC 100 Chevron Way Richmond, CA 94802 U. S. A. 001-510-242-3410
[email protected]
[email protected]
ABSTRACT We demonstrate the generation of an engine test model using Genetic Programming. In particular, a two-phase modeling process is proposed to handle the high-dimensionality and sparseness natures of the engine test data. The resulting model gives high accuracy prediction on training data. It is also very good in predicting low range data values. However, at least partly due to limitations of the data set, its accuracy on validation data and high range data values is not satisfactory. Moreover, the subject experts could not interpret its real-world meaning. We hope the results of this study can benefit other engine oil modeling applications.
Keywords Data Modeling; Genetic Programming; Sparse Data; High Dimensionality; Virtual Testing.
1. INTRODUCTION Laboratory engine tests are among the tools used to measure engine oil performance. These tests are specified in various engine oil performance categories for licensing and certification [3][4][12]. Lubricant additive companies and engine testing laboratories implement and exercise these tests to produce highquality engine oil. One of the engine tests used is Sequence IIIE. Early in the year 2000, capability to run this test had nearly been eliminated due to engine parts becoming unavailable. In response to this change, the American Society for Testing and Materials (ASTM) Sequence II/III Surveillance Panel formed the Virtual Test Task Force (VTTF) in May of 2000. The mission of VTTF was to investigate and develop a process, if appropriate, for the use of mathematical models based on IIIE data as a substitute for the Sequence IIIE test.
A virtual engine test protocol was subsequently devised and reported back to the Panel after four months of investigation. However, the proposed process did not receive enough support to be implemented. We believe that it is neither technical nor practical issues that hinder the implementation. Instead, it is the lack of familiarity and comfort with the proposed procedures that prevents the adoption of virtual testing [23]. In this work, we demonstrate how an engine test model can be created using Genetic Programming (GP) [14]. It is hoped that through understanding the data modeling process, the related organizations will become more comfortable with the concept of virtual engine testing. Moreover, we hope other engine oil modeling applications can benefit from this study. The paper is organized as follows. Section 2 explains the Sequence IIIE engine test data. Section 3 presents GP algorithm as a data-modeling tool. In Section 4, experimental setup is given and in Section 5, the experimental results are presented. Section 6 gives our analysis and Section 7 discusses the results of the study. Section 8 reviews related work and Section 9 contains the conclusions.
2. SEQUENCE IIIE ENGINE TEST DATA The test has been running for over 10 years. As a result, we have a relatively large data set. However, many of the data have missing information. For example, many potential predictors such as base oil characteristics were not recorded. We made improvement on 172 data records, which are used in this study to generate an engine test model. There are nine passing criteria for the Sequence IIIE engine test [4]. The criteria are percent viscosity increase, average piston varnish, average camshaft plus lifter wear, maximum camshaft plus lifter wear, average engine sludge, oil ring land deposits, oil consumption, oil related stuck rings, and stuck lifters. A complete engine test system is a suite of nine models; each model predicts one of the nine passing criteria. In this work, we focus on the viscosity increase model. The methodology can be applied to generate other models. Besides the test results (for the nine passing criteria), each test record contains information about the ingredients of the tested engine oil. For example, viscosity index improver (VII) and dispersants are common engine oil additives. Due to the diversity
of the additives and complex naming conventions, the number of additive variables is large (109). Moreover, it is common for an additive to be present in very few of the data records due to the experimental nature of oil formulation. As a result, the data set is very sparse.
characteristics, the total number of variables is 39. At the end of this aggression process, not only the number of variables is reduced, the density of the data set is also increased.
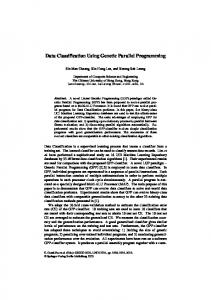
Figure 1 shows that 28% of the 109 additive variables appear only in one test record within the entire data set. More than 50% of the 109 variables appear in less than 5 test records. The combination of high-dimensionality and sparseness has made the engine test data difficult for most data modeling tools.
·
The software performs the splitting of training and testing data in a random manner.
·
No cross-validation is performed.
·
The software uses a normalized mutual information as the splitting criteria for tree nodes.
·
The software uses a confidence-based algorithm to perform tree pruning.
28%
1 record 2 records
The following model is generated in one run (note that the status window shows the number of training data is 115 while the number of testing data is 57):
3 records
48%
4 reocrds 11%
We used this data set for SGI MineSet [16] to generate a regression tree using its default setup:
others
Viscosity Increase = 4%
9%
If (saturates 375
Total
66
3
0
100-200
20
7
2
0
29
200-375
3
0
0
0
3
>375
0
0
0
3
3
Total
89
10
2
3
104
69
(b) 375
Total
375
73%
Total
Table 7: Confusion matrix analysis on validation data.
Table 5: Viscosity increase thresholds vs. test category. Category
100-200
375, the accuracy is 100% on training data and 40%
375
Total
91%
6%
3%
0%
100%
100-200
100%
0%
0%
0%
100%
200-375
100%
0%
0%
0%
100%
60%
0%
0%
40%
100%
375
We analyze the accuracy of the GP model in classifying the engine test data using confusion matrices.
P
Total
50%
The 0% accuracy rate on data range values between 200 and 375 is the result of small number (3) of training data. As a data-driven modeling method, GP is less likely to generate a good model without enough training data.
7. DISCUSSION After presenting the model to subject experts, some concerns were raised. First, the accuracy on validation data is much lower than that on training data. We investigated the characteristics of training and validation data and found there are many differences. For example, eight validation data have large quantities (e.g., 1074 or 1236) of equivalent antioxidancy that produce low
viscosity-increase values (