FOREST ENTOMOLOGY
Modeling Spatial Establishment Patterns of Exotic Forest Insects in Urban Areas in Relation to Tree Cover and Propagule Pressure MANUEL COLUNGA-GARCIA,1 ROBERT A. HAACK,2 ROGER A. MAGAREY,3 4 AND MARGARET L. MARGOSIAN
J. Econ. Entomol. 103(1): 108Ð118 (2010); DOI: 10.1603/EC09203
ABSTRACT As international trade increases so does the prominence of urban areas as gateways for exotic forest insects (EFI). Delimiting hot spots for invasions (i.e., areas where establishment is likely) within urban areas would facilitate monitoring efforts. We used a propagule-pressure framework to delimit establishment hot spots of a hypothetical generalist EFI in six U.S. urban areas: Chicago, Detroit, Houston, Los Angeles-Long Beach-Santa Ana, New York-Newark, and Seattle. We assessed how urban tree cover and propagule pressure interact to delimit establishment hot spots and compared the location of these hot spots with actual recent U.S. detections of two EFI: the Asian strain of the gypsy moth, Lymantria dispar (L.) (Lepidoptera: Lymantriidae), and Asian longhorned beetle, Anoplophora glabripennis (Motschulsky) (Coleoptera: Cerambycidae). Using a lattice of 5-km-diameter cells for each urban area, we used the input data (urban tree cover and propagule pressure) to model establishment and MoranÕs I to delimit hot spots. We used urban population size and the area of commercial-industrial land use as indicators of propagule pressure in the model. Relative establishment of EFI was inßuenced more by the two propagule pressure indicators than by tree cover. The delimited land use-based hot spots for Los Angeles-Long Beach-Santa Ana and New York-Newark encompassed more of the actual detections of L. dispar and A. glabripennis, respectively, than the population-based hot spots. No signiÞcant difference occurred between hot spot types for A. glabripennis detections in the Chicago urban area. Implications of these Þndings for management and design of monitoring programs in urban areas are discussed. KEY WORDS invasive species, nonindigenous species, urban forest, emerald ash borer
Urban areas in the United States are deÞned as densely settled territories with human populations of ⱖ2,500 (USCB 2000). Urban areas consist of at least one governmental unit such as a city, town, or village, plus adjacent lands. An urban area is often named after its largest city. For example, Chicago corresponds to both an urban area and a city. To support their metabolism, urban areas require a constant supply of energy and materials (Decker et al. 2000). As a result, they have developed the necessary infrastructure to receive, transfer, store, and distribute domestic and international cargo (Rodrigue 1999, Crainic et al. 2004, Hesse and Rodrigue 2004). As international trade intensiÞes (Hulme 2009), the prominence of urban areas as gateways for the introduction and spread of exotic pests is likely to increase (Colunga-Garcia et al. 2010). This seems to be especially true for exotic forest insects 1 Corresponding author: Center for Global Change and Earth Observations, Michigan State University, 204 Manly Miles Bldg., 1405 S. Harrison Rd., East Lansing, MI 48823 (e-mail:
[email protected]). 2 U.S. Forest Service, Northern Research Station, 220 Nisbet Bldg., 1407 S. Harrison Rd., East Lansing, MI 48823. 3 Center for Integrated Pest Management, North Carolina State University, 1730 Varsity Dr., Suite 300, Raleigh, NC 27606. 4 Geographic Information Systems Spatial Analysis Laboratory, Kansas State University, 118 Seaton, Manhattan, KS 66506.
(EFI). In the United States, for instance, the Asian longhorned beetle, Anoplophora glabripennis (Motschulsky) (Coleoptera: Cerambycidae), was Þrst detected in New York City, NY, in 1996; Chicago, IL, in 1998; Jersey City, NJ, in 2002; and Worcester, MA, in 2008 (Haack et al. 1997, 2010; Haack 2006). During the past two decades, the Asian strain of the gypsy moth, Lymantria dispar (L.) (Lepidoptera: Lymantriidae), has been detected in or near the urban areas of Austin, TX; Los Angeles, CA; Portland, OR; Tacoma, WA; and Vancouver, BC, Canada (Wallner et al. 1995; USDA 2006a,b, 2008; Hajek and Tobin 2009). For both pests, eradication efforts were successful or are ongoing. Another exotic forest pest, the emerald ash borer, Agrilus planipennis Fairmaire (Coleoptera: Buprestidae), was detected for the Þrst time in the urban area of Detroit, MI, in 2002 (Haack et al. 2002, Siegert et al. 2007). This insect, however, has spread to several other U.S. states primarily as a result of human movement of infested host material, including logs, Þrewood, and nursery stock (Haack 2006, Poland and McCullough 2006). The environmental and Þnancial impact of EFI in urban forests can be signiÞcant. For example, A. glabripennis could reduce forest canopy by 13Ð 68% and cities dealing with this insect may have to spend be-
0022-0493/10/0108Ð0118$04.00/0 䉷 2010 Entomological Society of America
February 2010
COLUNGA-GARCIA ET AL.: PROPAGULE PRESSURE, URBAN TREES AND EXOTICS
tween US$ 72 million to 2.3 billion (Nowak et al. 2001). It is thus imperative to implement monitoring strategies that prevent the establishment and spread of EFI in urban areas. Not all U.S. urban areas may be equally vulnerable to EFI. In fact, only 4 Ð 6% of the ⬎3,000 urban areas in the contiguous United States are the primary Þnal destinations for imports commonly associated with EFI (Colunga-Garcia et al. 2009). By focusing monitoring efforts in urban areas identiÞed as being most vulnerable to EFI, allocation of resources can be optimized (Magarey et al. 2009). However, even monitoring a subset of urban areas can still be challenging, especially those with large territories. For example, the Chicago and New York-Newark urban areas are ⬎5,000 and 8,000 km2, respectively. Therefore, deciding which urban areas need to be monitored is just the Þrst step. The next step is to identify invasion hot spots, which we deÞne as those areas within the selected urban areas where establishment of EFI is likely to occur. The task of identifying potential establishment hot spots within urban areas may be less daunting than it seems for urban settings that are under heavy propagule pressure (i.e., high likelihood for introduction of exotic insects via imported cargo) because such pressure reduces the complexity of factors involved in establishment of exotic species (Lockwood et al. 2005). In fact, under high propagule pressure, the two principal constraints to establishment are host resource availability and diet breadth of the exotic pest (Cassey et al. 2004, Lockwood et al. 2005, Colautti et al. 2006). In our previous work (Colunga-Garcia et al. 2009), we used patterns of national freight movement to highlight which urban areas in the United States were most vulnerable to invasions. To develop a better understanding of how propagule pressure and resource availability inßuence EFI establishment, we selected six of the more vulnerable urban areas from our Þrst study and conducted an analysis with a hypothetical generalist (wide diet breadth) pest. Our goal was to determine the usefulness of propagule pressure in the delimitation of EFI establishment hot spots within those urban areas. Studies on propagule pressure have relied primarily on the use of indicators such as marine ship trafÞc or various international trade statistics (Lodge et al. 2006). Lack of freight transport data within the urban areas precluded our use of this variable as an indicator of propagule pressure, so we used the size of the human population and the size of the area devoted to commercial/industrial land use as surrogates for propagule pressure. In using these indicators, we assumed that 1) the relative number of EFI arriving with imported products was proportional to the volume of imports, and 2) the demand for imported products within an urban area was proportional to the size of the urban human population or the size of the commercial/industrial land area. The speciÞc objectives of this study were 1) to assess how urban tree cover (a measure of resource availability) and two different proxies of propagule pressure (human population size and industrial/com-
109
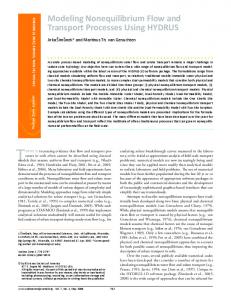
mercial land area) interact to delimit establishment hot spots for EFI, and 2) to compare the areas identiÞed by the urban population-based hot spots and land use-based hot spots in relation to recent detections of actual generalist EFI. Materials and Methods Objective 1. Identification of Establishment Hot Spots. The assumptions we made in this study were that the hypothetical EFI 1) had a wide host range that included both hardwood and conifer tree species, and 2) was unintentionally introduced into urban areas via imported products, which includes associated wood packaging materials such as crating and pallets. These types of wood packaging often serve as a vector in the spread of bark- and wood-infesting insects (Haack 2006, Haack and Petrice 2009, Haack et al. 2010). Urban Areas. We selected for our analysis the following six urban areas: 1) New York-Newark, located in the states of New York, New Jersey, and Connecticut (8,680 km2); 2) Chicago, largely located in Illinois (87%), with the remainder in Indiana (5,500 km2); 3) Los Angeles-Long Beach-Santa Ana, CA (4,320 km2); 4) Houston, TX (3,360 km2); 5) Detroit, MI (3,270 km2); and 6) Seattle, WA (2,470 km2). Urban area boundaries were extracted from the cartographic Þle “2000 Urban Areas” (USCB 2001a). These six urban areas were the Þnal destination of 47% of the machinery products, 26% of the nonmetallic mineral products, and 16% of the wood products imported into the United States in 2002 (Colunga-Garcia et al. 2009). Destination Sites. For each urban area we constructed a lattice of cells (diameter, 5 km) to represent all potential destination sites within an urban area as shown in Fig. 1. This cell diameter was arbitrarily selected to represent an EFI with a maximum dispersal radius of 2.5 km. Dispersal potential of the Asian longhorned beetle, for example, reaches 2.4 Ð2.6 km (Smith et al. 2004). Emerald ash borer females can ßy on average 1.7 km (Taylor et al. 2005). Hereafter, we use
Fig. 1. Visual depiction of the lattice of destination sites (cell diameter, 5 km) in the Detroit urban area.
110
JOURNAL OF ECONOMIC ENTOMOLOGY
Vol. 103, no. 1
and type of imported products (NRC 2002, McCullough et al. 2006, Colunga-Garcia et al. 2009). Because we focused on propagule pressure patterns within urban areas, i was more relevant for our analysis than N. Therefore, we set N ⫽ 1 in equation 2 for all urban areas and estimated relative establishment as follows: RE i ⫽ 1 ⫺ e ⫺共Tii兲
[3] th
where REi is relative establishment for the i site and the other variables are deÞned as in equation 2 (Fig. 2). For this analysis we used two variables as indicators of : the size of the urban human population, and the area of the commercial/industrial land use within each urban area. Thus, the Þnal equations used to estimate relative establishment for population-based and land use-based propagule pressure were, respectively: RE i ⫽ 1 ⫺ e ⫺共TiPi兲
[4]
RE i ⫽ 1 ⫺ e ⫺共TiLi兲. . .
[5]
and
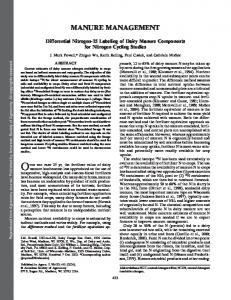
Fig. 2. Parameters used in the calculation of probability of the establishment and the relative establishment of a hypothetical EFI at individual sites within an urban area via international imports. N is the number of EFI introduced into an urban area via international imports, is an allocation coefÞcient for imports, and T is proportion of urban tree cover in a site.
the word “site” to refer to each individual cell within the lattice. Modeling Establishment in Destination Sites. Jerde and Lewis (2007) developed a propagule based model for invasive species as follows: E ⫽ 1 ⫺ e ⫺共S兲
[1]
where E is establishment of at least one individual, S is individual probability of survival and is propagule pressure. This model is similar to the independence model of Leung et al. (2004), where no Allee effects are considered. Building on equation 1, we modeled Ei as the establishment of at least one individual at the ith site as: E i ⫽ 1 ⫺ e ⫺共TiiN兲
[2]
In this equation, Ti is the proportion of tree cover in the ith site. We assumed that EFI survival was dependent on the availability of tree cover so we substituted Ti for S in equation 1. iN is the propagule pressure in the ith site (i.e., in equation 1). i is a coefÞcient to allocate imported products entering an urban area to each ith site (冱 ⫽ 1 in each urban area) (Fig. 2). N is the number of EFI introduced into an urban area via imported products (i.e., the propagule pressure for the entire urban area). N can be inßuenced by many factors, including EFI population levels in the countries of origin, pest survival during transport, ability of EFI to escape detection by inspectors at ports of entry,
where Pi is the proportion of the human population in the ith site with respect to the entire urban area population (equation 4), Li is the proportion of commercial/industrial land use in the ith site with respect to the same type of land in the entire urban area (equation 5), and the other variables are deÞned as above. To compute Pi, we obtained a rasterized version of the 2000 U.S. population (Seirup and Yetman 2006), which was used in the following equation: P i ⫽ Pop i/TPop
[6] th
where Popi is human population size in the i site, and TPop is the total human population in the urban area. To estimate Li, we Þrst computed the area for the high-intensity developed land class at each ith site according to the 2001 National Land-Cover Data (NLCD) (Homer et al. 2004), using the resulting computation in the following equation: L i ⫽ D Hi/TLand
[7]
where DH i is the high-intensity developed land area in the ith site, and TLand is the total terrestrial land use in the urban area. Estimation of Tree Cover. To estimate the proportion of tree cover (Ti) in the ith site, we used the following equation: T i ⫽ Ut i/L i
[8] th
where Uti is urban tree cover area in i site and Li is land area in ith site. To estimate Uti, we estimated the greenspace area in developed land (Gi) at each ith site. To estimate Gi, we computed the area for each of the four 2001 NLCD classes for developed land at each ith site. Area values were used in the following equation: G i ⫽ 0.1D Hi ⫹ 0.35D Mi ⫹ 0.65D Li ⫹ 0.9D Os [9] where DHi is high intensity developed land (80 Ð100% of impervious area); DMi is medium intensity devel-
February 2010
COLUNGA-GARCIA ET AL.: PROPAGULE PRESSURE, URBAN TREES AND EXOTICS
111
oped land (50 Ð79% of impervious area); DLi is low intensity developed land (20 Ð 49% of impervious area); DOs is open space in developed land (⬍20% impervious area). CoefÞcients in equation 9 were obtained by averaging the percentage range of the nonimpervious area in each class (i.e., 100 ⫺ impervious area) and converting the results to proportions (0 Ð1). Next, using the NLCD, we quantiÞed the forestland area (Fi) at each ith site by adding the area of all forest classes (deciduous, evergreen, and mixed forest) in the ith site. With the results of the above computations, we estimated the urban tree cover area (Uti) as: Ut i ⫽ F i ⫹ G i
[10]
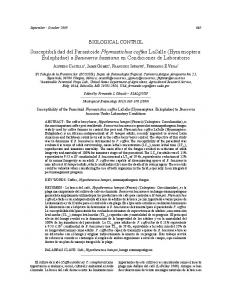
where Fi and Gi are deÞned above, and is an urban area coefÞcient that determines the proportion of tree cover in Gi. Values of used in this study were 0.27 (Chicago), 0.32 (Seattle), 0.43 (New York-Newark), 0.5 (Los Angeles-Long Beach-Santa Ana), 0.53 (Houston), and 0.78 (Detroit). The coefÞcients were estimated as follows. First, we obtained literature estimates of tree cover for the largest city in each urban area (see Fig. 4 for the geographic location of the largest city in an urban area). City tree cover estimates used were Chicago, 11.1% (Nowak et al. 1996); Detroit, 31% (American Forest 2006); Houston, 30% (American Forest 2000); Los Angeles, 20.8% (Wu et al. 2008); NY, 16.6% (Nowak et al. 2006); and Seattle, 18% (CSUFC 2007). Second, we converted those percentages to area estimates (i.e., Ut). Third, using the NLCD, we estimated both the greenspace area (G) (by applying equation 9 to the entire city) and the forestland area (F) for each city. Finally, using the values of Ut, G, and F, we solved for in equation 10 for each city. In using this approach, we assumed that the proportion of tree cover in the developed landÕs greenspace area (i.e., the coefÞcient) was constant across the entire urban area. The relationship between our estimates of urban tree cover and propagule pressure in relation to the full range of RE values is shown in Fig. 3. Note that in Fig. 3 only one of the propagule pressure indicators (urban population size) is shown. However, this pattern is applicable to the commercial/industrial land area as well given that both indicators are proportions. Delimitation of Relative Establishment Hot Spots. We used the MoranÕs I, a local indicator of spatial association, to detect clusters of sites with high relative establishment potential, or “hot spots” (Anselin 1995, Anselin et al. 2006). This approach essentially detects which establishment values within an urban area are signiÞcantly higher than the mean (Fortin and Dale 2005). The desired signiÞcance levels (␣ ⱕ 0.05) of the hot spots were assessed after conducting 9999 permutations using GEODA (Anselin et al. 2006). For brevity hereafter, we use the term “population-based hot spots” when the MoranÕs I analysis was conducted on relative establishment values resulting from equation 4, and the term “land use-based hot spots” when the analysis was conducted on relative establishment values obtained from equation 5. For both types of hot spots, we quantiÞed the degree of association between
Fig. 3. Relative establishment (RE) values at different levels of tree cover (T) and urban human population (P) (as a proxy for propagule pressure).
urban tree cover (T) and propagule pressure (P and L) by using the Pearson correlation coefÞcient (SPSS Inc. 2007). In addition, we analyzed the contribution of urban tree cover and propagule pressure to the relative establishment of the hot spots by conducting linear regression analysis of the form RE ⫽ 0 ⫹ 1 T ⫹ 2 P for the population-based hot spots, and of the form RE ⫽ 0 ⫹ 1 T ⫹ 2 L for the land use-based hot spots (SPSS Inc. 2007). Before regression analysis, we applied the arcsine (√) transformation to all relative establishment values. Objective 2. Comparison of Population-Based and Land Use-Based Hot Spots in Relation to Detections of EFI. We compared both population-based and land use-based hot spots using recent detections of two forest insects in urban areas. The selected insects were the Asian gypsy moth in Los Angeles-Long BeachSanta Ana and the Asian longhorned beetle in Chicago and New York-Newark. These two EFI were selected because 1) their detection history is well documented; and 2) they attack a wide range of host plants, which is similar to how we based the development of the hot spots on a generalist forest insect. To determine which sites in our lattice (Fig. 1) corresponded to detections of these two insects, we obtained maps detailing detections for the Asian gypsy moth in Los Angeles-Long Beach-Santa Ana area (USDA 2008a) and the Asian longhorned beetle in the Chicago area (USDAÐAPHIS 2007) and in the New York-Newark area (USDAÐ APHIS 2008b). Maps were scanned, georeferenced, and overlaid on our lattice. Lattice sites encompassing detection points were recorded as such. In addition, sites were named using the name of the Þrst chronological detection point (e.g., park) within a site, or the place name (e.g., city, borough) that encompassed the site. We distinguished between primary and secondary infestation sites where the former sites were suspected as the original introduction sites, whereas the latter sites were the result of natural or human-assisted dispersal from the primary introduction sites.
112
JOURNAL OF ECONOMIC ENTOMOLOGY
Vol. 103, no. 1
Table 1. Regression coefficients () and associated statistics for urban population (P) and tree cover (T) in the model RE ⴝ 0 ⴙ 1 T ⴙ 2 P CoefÞcient
Urban area Chicago Detroit Houston Los Angeles-Long Beach-Santa Ana New York-Newark Seattle a
t
SE
CVa
SigniÞcance
P
T
P
T
P
T
P
T
P
T
1.29 2.51 2.00 2.00 1.41 1.39
0.08 0.08 0.08 0.10 0.04 0.07
0.09 0.10 0.14 0.11 0.12 0.15
0.011 0.006 0.011 0.008 0.008 0.011
14.2 25.2 14.3 17.9 12.2 9.5
7.3 13.7 7.9 12.4 4.3 6.9
⬍0.001 ⬍0.001 ⬍0.001 ⬍0.001 ⬍0.001 ⬍0.001
⬍0.001 ⬍0.001 ⬍0.001 ⬍0.001 ⬍0.001 ⬍0.001
88 79 92 78 123 72
51 30 48 32 49 47
CoefÞcient of variation: mean/standard deviation ⫻ 100.
more inßuence in determining relative establishment than tree cover (see the magnitude of the regression coefÞcients in Tables 1 and 2). The higher variability in propagule pressure (among the individual sites within the hot spots) compared with urban tree cover variability (CV; see Tables 1 and 2) is the likely explanation for the greater inßuence of propagule pressure. The Þnding that both propagule pressure indicators played a larger role than urban tree cover in determining relative establishment of EFI can be appreciated visually by comparing the location of the relative establishment hot spots (RE) against the spatial distribution of tree cover (T), population-based propagule pressure (P), and land use-based propagule pressure (L) in Fig. 4. For each of the six urban areas studied, major portions of the hot spots coincided with sites of high human or land use concentration. The average urban tree cover within most hot spots was less than the average for the whole urban area (Table 3). In the New York-Newark urban area, for example, the average tree cover within the hot spots was 50% less than the average for the entire urban area. For hot spots in the Chicago and Seattle urban areas, the difference was ⬎30%. In addition, within the hot spots of each urban area, there was a signiÞcant inverse association (␣ ⬍ 0.001) between urban tree cover and the two propagule pressure indicators (r in Table 3). Overall, the number of sites in the hot spots (N in Table 3) averaged 16% of the total number of sites within the urban areas, with a minimum of 9% for the population-based hot spots in the New York-Newark urban area and a maximum of 25% for the land use-based hot spots in the Los Angeles-Long BeachSanta Ana urban area.
We had planned to include the emerald ash borer in our analysis because it is an important invader in one of our selected urban areas, Detroit. Moreover, its host tree (Fraxinus spp.) is so widely distributed in the region that any hot spots developed for this insect would probably be similar, for practical purposes, to those of a generalist. However, by the time the insect was Þrst detected in 2002, the invaded area had extended beyond the Detroit urban area. Two primary infestation sites have been identiÞed in the Detroit urban area based on dendrochronological reconstruction analysis (Siegert et al. 2007). Because two sites are not sufÞcient to conduct meaningful statistical comparisons, we included selected emerald ash borer data for future reference only. Homer et al. (2004) characterized the commercial/ industrial land use class in the 2001 NLCD as highly populated. Consequently, we expected a signiÞcant association between urban population size (P) and the area dedicated to commercial/industrial land area (L). To quantify the degree of their association, we used Pearson correlation after arcsine (√) transformation of both variables. Despite the anticipated high association between P and L, we tested whether there was any difference in the number of sites encompassed within the population-based and the land usebased hot spots, using the paired sample t-test (SPSS Inc. 2007). We used the jackknife method (Southwood and Henderson 2000) to obtain as many pseudosamples as there were detections reported for each combination of insectÐ urban area. Results Objective 1. Identification of Establishment Hot Spots. In all urban areas, both propagule pressure indicators (population-based and land use-based) had
Table 2. Regression coefficients () and associated statistics for commercial/industrial land use (L) and tree cover (T) in the model RE ⴝ 0 ⴙ 1 T ⴙ 2 L Urban area Chicago Detroit Houston Los Angeles-Long Beach-Santa Ana New York-Newark Seattle a
CoefÞcient
t
SE
CVa
SigniÞcance
L
T
L
T
L
T
L
T
L
T
1.39 2.13 1.48 1.36 1.25 1.39
0.09 0.05 0.04 0.06 0.02 0.07
0.13 0.16 0.18 0.14 0.12 0.15
0.014 0.012 0.015 0.026 0.009 0.011
10.6 13.5 8.3 10.0 10.9 9.5
6.6 4.2 3.0 2.2 2.8 6.9
⬍0.001 ⬍0.001 ⬍0.001 ⬍0.001 ⬍0.001 ⬍0.001
⬍0.001 ⬍0.001 0.005 0.029 0.007 ⬍0.001
103 99 110 111 129 133
51 30 48 32 49 47
CoefÞcient of variation: mean/standard deviation ⫻ 100.
February 2010
COLUNGA-GARCIA ET AL.: PROPAGULE PRESSURE, URBAN TREES AND EXOTICS
113
Fig. 4. Distribution of tree cover availability, two propagule pressure indicators (population-based, and land use-based), and relative establishment hot spots for a hypothetical generalist forest pest that could be introduced in urban areas via imported cargo. ClassiÞcation scales for tree cover and propagule pressure are relative to each mapÕs range of values (see maximum values at the bottom maps) (Jenks 1967, ESRI Inc. 2006). Delimitation of hot spots was made using MoranÕs I local indicator of spatial association at two signiÞcance levels (Anselin et al. 2006).
EFI detections than the population-based hot spots for the Asian gypsy moth in the Los Angeles-Long Beach-Santa Ana urban area (t ⫽ 9.8; df ⫽ 4; ␣ ⫽ 0.001) and the Asian longhorned beetle in the New York-Newark urban area (t ⫽ 37.5, df ⫽ 17, ␣ ⬍ 0.001). In these two cases, the land use-based hot spots encompassed, respectively, 80 and 78% of the detection sites, compared with the 20 and 56% of the population-based hot spots. All primary sites in Los Angeles-Long Beach-Santa Ana and New YorkNewark were encompassed by the land use-based
Objective 2. Comparison of Population-Based and Land Use-Based Hot Spots in Relation to Detections of Actual EFI. A detailed tabulation for the U.S. detection sites of Asian gypsy moth, Asian longhorned beetle, and emerald ash borer in our six selected urban areas is shown in Table 4. The last two columns of the table indicate whether the site was within (⫹) or outside (⫺) the hot spot as well as the number of sites (each 5 km wide) away from the edge of the hot spot. The results of the “t” test-jackknife analysis showed that the land use-based hot spots encompassed more
Table 3. Number of sites (N), percentage of urban tree cover (T) (mean ⴞ SE), and correlation (r)a of urban tree cover vs two propagule pressure indicators (i.e., urban population size and commercial-industrial land area) Urban area name Chicago Detroit Houston Los Angeles-Long Beach-Santa Ana New York-Newark Seattle a
Entire urban area
Pop-based hot spots
Land use-based hot spots
N
T
N
T
r
N
T
r
329 194 227 234 580 175
21.4 ⫾ 0.6 45.4 ⫾ 1.0 31.8 ⫾ 1.0 19.7 ⫾ 0.4 46.1 ⫾ 0.9 41.3 ⫾ 1.5
44 45 41 32 50 26
13.7 ⫾ 0.8 37.9 ⫾ 1.2 27.5 ⫾ 1.0 19.8 ⫾ 0.8 22.3 ⫾ 1.7 28.7 ⫾ 2.0
⫺0.68 ⫺0.67 ⫺0.63 ⫺0.66 ⫺0.66 ⫺0.74
48 37 45 59 81 20
14.6 ⫾ 0.9 35.6 ⫾ 1.4 27.4 ⫾ 1.2 16.8 ⫾ 0.4 20.1 ⫾ 1 26.7 ⫾ 3.2
⫺0.74 ⫺0.78 ⫺0.74 ⫺0.90 ⫺0.78 ⫺0.58
All correlations were signiÞcant at ␣ ⬍ 0.0001.
114
JOURNAL OF ECONOMIC ENTOMOLOGY
Vol. 103, no. 1
Table 4. Detections of four exotic forest insects in four urban areas in relation to establishment hot spots delimited based on tree cover availability and two propagule pressure indicators: urban population size and area of industrial commercial land
Insect and urban area
Detection site name
Yr of detection
Asian gypsy moth in Los Angeles-Long BeachSanta Ana
Port of Los Angeles, CA Orange County, CA Port of Los Angeles 2, CA Willowbrook, CA Rolling Hills, CA Ravenswood, IL Addison, IL Summit, IL Park Ridge, IL Loyola, IL Kilbourn Park, IL OÕHare airport, IL Oz Park, IL Greenpoint Brooklyn, NY Brooklyn 2, NY Brooklyn 3, NY Amityville 1, NY Amityville 2, NY Lindenhurst, NY Islip, NY RupertsÕs playground, Manhattan, NY Flushing, Queens, NY Bayside, Queens, NY Woodside, Queens, NY Luther Gulick Playground, Manhattan, NY Jersey City, NJ Kew Garden Hills, Queens, NY Forest Park, Queens, NY Carteret, NJ Linden, NJ Staten Island, NY Garden City, MI Westland, MI
2003 2005 2006 2007 2007 1998 1998 1998 1999 1999 1999 2000 2003 1996 1996 1996 1996 1996 1997 1999 1999 1999 1999 1999 2000 2002 2003 2003 2004 2004 2007 1996 1996
a
Asian longhorned beetle in Chicago
Asian longhorned beetle in New York-Newark
Emerald ash borer in Detroit
b
Infestation typec P N N N N P S S S S S S S P P P S S S S S S S S S S S S P S S S S
Location of detection sites relative to hot spotsd Pop-based hot spots
Land use-based hot spots
⫺4 ⫺2 ⫺4 1* ⫺4 1* ⫺3 ⫺1 1* 1* 2* ⫺1 1* 1* 2* 2* ⫺4 ⫺5 ⫺5 ⫺7 2* 1* 1* 2* 1* ⫺1 1* 1* ⫺2 ⫺1 ⫺2 2* 1*
1* 1* 1* 3* ⫺1 ⫺1 ⫺1 1* 2* ⫺1 1* 2* 1* 3* 2* 2* ⫺1 ⫺2 ⫺1 ⫺1 3* 1* 1* 2* 2* 2* 1* 2* 1* 1* 1* 1* ⫺1
a Sources: Asian gypsy moth (USDA 2008a); Asian longhorned beetle (USDA APHIS 2007, 2008b, Sawyer and Panagakos 2009); emerald ash borer (Siegert et al. 2007). b Names indicate a reference to the Þrst detection point (e.g., park) within a site, or a reference to a place (e.g., city, borough) encompassing a site where multiple detections were made (site ⫽ cell 5-km diameter). c P, primary infestation/detection; S, secondary infestation (resulting from natural insect spread or human mediated dispersion); N, not able to deÞne. d An asterisk (*) indicates that the detection occurred within a hot spot (outside the hot spot otherwise). The numbers indicate the number of sites, i.e., cells with a 5-km diameter, to the nearest edge of the hot spot; positive numbers increase toward the hot spot center (1 ⫽ edge of hot spot), and negative numbers increase away from the hot spots (⫺1, a site outside but adjacent to the hot spot).
hot spots. The population-based hot spots, however, encompassed only one primary site (Brooklyn) in New York-Newark. No signiÞcant difference was found between the population-based and the land use-based hot spots in the case of the Asian longhorned beetle in the Chicago urban area (t ⫽ 0.0, df ⫽ 7, ␣ ⫽ 1.000). Both hot spot types encompassed 63% of the detection sites, although most of the encompassed individual sites differed among the two hot spot types. In fact, only the populationbased hot spot encompassed the primary infestation (Ravenswood area) in the Chicago urban area. Regarding the emerald ash borer in the Detroit urban area, both hot spot types encompassed the primary site of Garden City, but only the population-based hot spots encompassed the primary site of Westland City as well. Several of the Asian longhorned beetle detection sites that occurred outside of the hot spots were im-
mediately adjacent to the land use-based hot spots in the Chicago and New York-Newark urban areas (adjacent ⫽ ⫺1). A similar situation was observed in Chicago for the population-based hot spots. The overall distribution of detection sites in relation to both hot spot types is shown in Fig. 5. Discussion The results of this study provided important theoretical and applied insights for future programs aimed to prevent EFI invasions in urban areas. First, propagule pressure was more important than urban tree cover in determining the location of establishment hot spots. Employing a propagule-pressure framework would assist managers in delimiting areas where invasions are likely and thereby allow them to optimize resources for EFI monitoring. Including speciÞc data on the number and location of warehouses or nurs-
February 2010
COLUNGA-GARCIA ET AL.: PROPAGULE PRESSURE, URBAN TREES AND EXOTICS
Fig. 5. Detections or establishments of three EFI in four urban areas in relation to population-based and land usebased hot spots (gray, hot spot sites; black, detection or establishment of an EFI within a hot spot: white, detection or establishment of an EFI outside a hot spot).
eries could facilitate further delimitation within the hot spots. The good news about propagule pressure being an important variable in determining areas vulnerable to invasion is that the location of such hot spots is likely to be similar for a wide array of EFI. This Þnding could facilitate monitoring efforts by allowing personnel and resources to be spatially concentrated. Monitoring these hot spots, however, presents logistical challenges. The predominant land use within the hot spots, judging from our analysis, is commercialindustrial which tends to be highly fragmented and brimming with human activity. Moreover, in commercial-industrial areas there are multiple forest patches ranging in size from single trees to parks or woodlots. Under these conditions it is logical to involve the public in monitoring programs for EFI. However, although it may be relatively easy to involve people in monitoring their own backyards, it will probably require additional effort to systematically involve them in monitoring trees in commercial-industrial areas. Second, forest cover did not have much effect on determining the location of hot spots in the current study. However, detailed tree species composition could help determine the type of EFI most likely to
115
become established under a propagule-pressure framework. Of interest for the prevention and management of future invasions is the amount of tree cover area in the hot spots. For the urban areas in our study, average tree cover was relatively low in the hot spots when compared with the entire urban area. This fact emphasizes the importance of containing new invasions as early as possible. As newly established EFI disperse beyond the hot spots toward the edge of the urban area, where urban tree cover increases, containing the invasion could rapidly become more difÞcult or even impossible. Even within hot spots, some urban areas have much more tree cover than others. Therefore, containing invasions in urban areas whose hot spots have high tree cover may be more difÞcult than in hot spots with less tree cover. Another issue related to the relatively low tree cover in urban hot spots is the increasing awareness that trees provide important ecosystem services to urban areas (Dwyer et al. 2000) and the desire to increase tree cover in many U.S. cities (Galvin et al. 2006a,b; Grove et al. 2006). If this occurs then the hot spots shown in Fig. 4 would be likely targets for tree planting efforts given their relatively low tree cover. Because hot spots are already under heavy propagule pressure, an increase in tree cover could also increase EFI establishment potential. This situation, which is not meant to deter tree planting efforts, emphasizes the importance of increasing tree species diversity to mitigate the impact of any future EFI. Third, hot spots in urban areas may involve multiple cities, emphasizing the need for collaboration and coordination. For instance, using geographical layers from the U.S. Census Bureau (USCB 2001a,b), we found that the Chicago and New York-Newark urban areas encompass 268 and 671 cities or other governmental units, respectively. Of these, 80 and 188 cities, respectively, intersect the land use-based hot spots that we identiÞed in these two urban areas. International trade is on the increase (ColungaGarcia et al. 2009, Hulme 2009), as is the risk of inadvertently introducing EFI in urban areas. In our previous work, we used patterns of national freight movement to highlight which urban areas in the United States were most vulnerable to pest invasion (Colunga-Garcia et al. 2009). Here, we analyzed how propagule pressure affects vulnerability of urban areas to EFI. However, further research on propagule pressure and urban forest cover is needed. One issue, for example, is the need to increase our understanding on the meaning of propagule pressure indicators in relation to the movement of imported goods in urban areas. The two types of indicators we used, population size and commercialindustrial area, are highly correlated. Thus, the differences noted in how hot spots were delimited likely indicate important nuances in the spatial associations of these two indicators in different urban areas. Perhaps selection of an urban-population cohort (i.e., working age) may enhance the power of the population-based indicator to delimit hot spots. The fact that the population-based indicator per-
116
JOURNAL OF ECONOMIC ENTOMOLOGY
formed better in Chicago, whereas the land usebased indicator did better in New York-Newark emphasizes the need for further research on this subject. In the short term, we may need to use both indicators to select hot spots. This could be done by using the indicators separately (as we did in this study) or by developing a model that integrates both. Of course, if data on freight transport or some similar variable (e.g., numbers and locations of warehouses) becomes readily available, there may be no need to explore further the use of the indicators used in our study. However we anticipate that, for the near term, human population or land use data may be the only data available for researchers in many regions of the world to use in these types of investigations. A second issue relates to the availability of urban forest data. Complete national or regional inventories of urban tree layers may take many years to compile, and ultimately, they may be impractical to establish and maintain (Nowak 2008). In our study, we estimated urban tree cover based on assumptions and procedures that were facilitated by the use of a generalist insect. Assessments for insects with a narrow host range may require different assumptions, and such data may be available only at a very local scale. As forest layers for individual urban areas are developed, there will be a need to analyze their spatial relationship with respect to propagule pressure and compare those results with our Þndings. A third issue is the fact that in our model selection we did not include Allee effects (Liebhold and Tobin 2008). In doing so, we assumed that the impact of Allee effects would be minimal under conditions of high propagule pressure. Such an assumption, however, should be revised as future models of EFI establishment and dispersion in urban areas are developed. More issues are sure to arise as the research on the dynamics of EFI in urban areas progresses; and pursuing a satisfactory answer for them may become a long-term endeavor. Urban forest managers, however, face the short-term challenge of implementing measures to protect local forests. Approaches such as those described in our study may help assist managers with short-term challenges, such as selection of high-risk monitoring sites, while buying time to obtain a more thorough understanding of pest invasions in urban areas.
Acknowledgments We thank Laura Bix, Eva Kassens, Janice Molloy, Theresa Schultz, Trixie Smith, and two anonymous reviewers for providing comments to enhance this manuscript; Kurt Gottschalk for offering suggestions to improve the analysis; and Chadni Bhan from Michigan State University-Center for Statistical Training and Consulting (MSU-CSTAT) for assisting with statistical analysis. This work was supported by the NRI-USDA/CSREES/Plant Biosecurity Program grant 200655605-16658.
Vol. 103, no. 1 References Cited
American Forest. 2000. Urban ecosystem analysis for the Houston Gulf Coast region: calculating the value of nature. American Forests, Washington, DC. (http://www. americanforests.org/downlaods/rea/AF_Houston.pdf). American Forest. 2006. Urban ecosystem analysis SE Michigan and city of Detroit: calculating the value of nature. American Forests, Washington, DC. (http://www. americanforests.org/downloads/rea/AF_Detroit.pdf). Anselin, L. 1995. Local indicators of spatial associationLISA. Geogr. Anal. 27: 93Ð115. Anselin, L., I. Syabri, and Y. Kho. 2006. GeoDa: an introduction to spatial data analysis. Geogr. Anal. 38: 5Ð22. Cassey, P., T. M. Blackburn, D. Sol, R. P. Duncan, and J. L. Lockwood. 2004. Global patterns of introduction effort and establishment success in birds. Philos. Trans. R. Soc. Lon. B (Suppl.). 271: S405ÐS408. Colautti, R. I., I. A. Grigorovich, and H. J. MacIsaac. 2006. Propagule pressure: a null model for biological invasions. Biol. Invasions 8: 1023Ð1037. Colunga-Garcia, M., R. A. Haack, and A. O. Adelaja. 2009. Freight transportation and the potential for invasions of exotic insects in urban and periurban forests of the United States. J. Econ. Entomol. 102: 237Ð246. Colunga-Garcia, M., R. A. Magarey, R. A. Haack, S. H. Gage, and J. Qi. 2010. Enhancing early detection of exotic pests in agricultural and forest ecosystems using an urban gradient framework. Ecol. Appl. 20: 303Ð310. Crainic, T. G., N. Ricciardi, and G. Storchi. 2004. Advanced freight transportation systems for congested urban areas. Transport. Res. C Emerg. Technol. 12: 119 Ð137. [CSUFC] City of Seattle Urban Forest Coalition. 2007. City of Seattle: urban forest management plan. City of Seattle Urban Forest Coalition, Seattle, WA. (http://www.seattle. gov/environment/documents/Final_UFMP.pdf). Decker, E. H., S. Elliot, F. A. Smith, D. R. Blake, and F. S. Rowland. 2000. Energy and material ßow through the urban ecosystem. Annu. Rev. Energy Environ. 25: 685Ð 740. Dwyer, J. F., D. J. Nowak, M. H. Noble, and S. M. Sisinni. 2000. Connecting people with ecosystems in the 21st century: an assessment of our nationÕs urban forests. U.S. Department of Agriculture, Forest Service, PaciÞc Northwest Research Station. Portland, OR. Gen. Tech. Rep. PNW-GTR-490. (http://www.fs.fed.us/pnw/pubs/ pnw_gtr490.pdf). ESRI Inc. 2006. ArcGIS 9.2. ESRI Inc., Redlands, CA. Fortin, M. J., and M.R.T. Dale. 2005. Spatial analysis: a guide for ecologists. Cambridge University Press, Cambridge, United Kingdom. Galvin, M. F., J. M. Grove, and J. O’Neil-Dunne. 2006a. A report on Baltimore CityÕs present and potential urban tree canopy. Maryland Department of Natural Resources, Forest Service, Annapolis, MD. (http://web. mac.com/jmorgangrove/Morgan/UTC-FOS_Þles/ Baltimore%20UTC%20report%20FINAL.pdf). Galvin, M. F., J. M. Grove, and J. O’Neil-Dunne. 2006b. A report on Annapolis CityÕs present and potential urban tree canopy. Maryland Department of Natural Resources, Forest Service, Annapolis, MD. (http://www.fs.fed.us/ nrs/utc/reports/UTC_Report_Annapolis.pdf). Grove, J. M., J.P.M. O’Neil-Dunne, K. Pelletier, D. J. Nowak, and J. Walton. 2006. A report on New York CityÕs present and possible urban tree canopy. (http://www.nrs.fs.fed.us/ nyc/local-resources/downloads/Grove_UTC_NYC_ FINAL.pdf).
February 2010
COLUNGA-GARCIA ET AL.: PROPAGULE PRESSURE, URBAN TREES AND EXOTICS
Haack, R. A. 2006. Exotic bark- and wood-boring Coleoptera in the United States: recent establishments and interceptions. Can. J. For. Res. 36: 269 Ð288. Haack, R. A., and T. R. Petrice. 2009. Bark- and wood-borer colonization of logs and lumber after heat treatment to ISPM 15 speciÞcations: the role of residual bark. J. Econ. Entomol. 102: 1075Ð1084. Haack, R. A., K. R. Law, V. C. Mastro, H. S. Ossenbruggen, and B. J. Raimo. 1997. New YorkÕs battle with the Asian long-horned beetle. J. For. 95: 11Ð15. Haack, R. A., E. Jendek, H. Liu, K. R. Marchant, T. R. Petrice, T. M. Poland, and H. Ye. 2002. The emerald ash borer: a new exotic pest in North America. Newsl. Mich. Entomol. Soc. 47: 1Ð5. Haack, R. A., F. He´rard, J. Sun, and J. J. Turgeon. 2010. Managing invasive populations of Asian longhorned beetle and citrus longhorned beetle: a worldwide perspective. Annu. Rev. Entomol. 55: 521Ð546. Hajek, A. E., and P. C. Tobin. 2009. North American eradications of Asian and European gypsy moth, pp. 71Ð 89. In A. E. Hajek, T. R. Glare, and M. OÕCallaghan [eds.], Use of microbes for control and eradication of invasive arthropods. Springer, Dordrecht, The Netherlands. Hesse, M., and J. Rodrigue. 2004. The transport geography of logistics and freight distribution. J. Transport. Geogr. 12: 171Ð184. Homer, C., C. Huang, L. Yang, B. Wylie, and M. Coan. 2004. Development of a 2001 National Land-Cover Database for the United States. Photogramm. Eng. Rem. S. 70: 829 Ð 840. Hulme, P. E. 2009. Trade, transport and trouble: managing invasive species pathways in an era of globalization. J. Appl. Ecol. 46: 10 Ð18. Jenks, G. F. 1967. The data model concept in statistical mapping. Int. Yearb. Cartogr. 7: 186 Ð190. Jerde, C. L., and M. A. Lewis. 2007. Waiting for invasions: a framework for the arrival of nonindigenous species. Am. Nat. 170: 1Ð9. Leung, B., J. M. Drake, and D. M. Lodge. 2004. Predicting invasions: propagule pressure and the gravity of Allee effects. Ecology 85: 1651Ð1660. Liebhold, A. M., and P. C. Tobin. 2008. Population ecology of insect invasions and their management. Annu. Rev. Entomol. 53: 387Ð 408. Lockwood, J. L., P. Cassey, and T. Blackburn. 2005. The role of propagule pressure in explaining species invasions. Trends Ecol. Evol. 20: 223Ð228. Lodge, D. M., S. Williams, H. J. Macisaac, K. R. Hayes, B. Leung, S. Reichard, R. N. Mack, P. B. Moyle, M. Smith, D. A. Andow, J. T. Carlton, and A. McMichael. 2006. Biological invasions: recommendations for U.S. policy and management. Ecol. Appl. 16: 2035Ð2054. Magarey, R. D., M. Colunga-Garcia, and D. A. Fieselmann. 2009. Plant biosecurity in the United States: roles, responsibilities and information needs. BioScience 59: 875Ð 884. McCullough, D. G., T. T. Work, J. F. Cavey, A. M. Liebhold, and D. Marshall. 2006. Interceptions of nonindigenous plant pests at US ports of entry and border crossings over a 17-year period. Biol. Invasions 8: 611Ð 630. Nowak, D. J., R. A. Rowntree, E. G. McPherson, S. M. Sisinni, E. Kerkmann, and J. C. Stevens. 1996. Measuring and analyzing urban tree cover. Landscape Urban Plan. 36: 49 Ð57. Nowak, D. J., J. E. Pasek, R. A. Sequeira, D. E. Crane, and V. C. Mastro. 2001. Potential effect of Anoplophora glabripennis (Coleoptera: Cerambycidae) on urban trees in the United States. J. Econ. Entomol. 94: 116 Ð122.
117
Nowak, D. J., D. E. Crane, and J. C. Stevens. 2006. Air pollution removal by urban trees and shrubs in the United States. Urban For. Urban Greening 4: 115Ð123. Nowak, D. J. 2008. Assessing urban forest structure: summary and conclusions. Arbor. Urban For. 34: 391Ð392. [NRC] National Research Council. 2002. Predicting invasions of nonindigenous plants and plant pests. National Academies Press, Washington, DC. Poland, T. M., and D. G. McCullough. 2006. Emerald ash borer: invasion of the urban forest and the threat to North AmericaÕs ash resource. J. For. 104: 118 Ð124. Rodrigue, J. 1999. Globalization and the synchronization of transport terminals. J. Transport. Geogr. 7: 255Ð261. Seirup, L., and G. Yetman. 2006. U.S. Census grids (summary Þle 1), 2000. SEDAC Socioeconomic Data and Applications Center. (http://sedac.ciesin.columbia.edu/ usgrid/). Siegert, N. W., D. G. McCullough, A. M. Liebhold, and F. W. Telewski. 2007. Resurrected from the ashes: a historical reconstruction of emerald ash borer dynamics through dendrochronological analysis, pp. 18 Ð19. In V. Mastro, D. Lance, R. Reardon, and G. Parra [eds.], Emerald ash borer and Asian longhorned beetle research and technology development meeting, 29 OctoberÐ2 November 2006, Cincinnati, OH. FHTET-2007-04. U.S. Department of Agriculture, Forest Service, Morgantown, WV. Smith, M. T., P. C. Tobin, J. Bancroft, G. Li, and R. Gao. 2004. Dispersal and spatiotemporal dynamics of Asian longhorned beetle (Coleoptera: Cerambycidae) in China. Environ. Entomol. 33: 435Ð 442. Southwood, T.R.E., and P. A. Henderson. 2000. Ecological methods. Blackwell, Oxford, United Kingdom. SPSS Inc. 2007. SPSS for Windows, version 16. SPSS Inc. Chicago, IL. Taylor, R.A.J., L. S. Bauer, D. L. Miller, and R. A. Haack. 2005. Emerald ash borer ßight potential, pp. 15Ð16. In V. Mastro and R. Reardon [eds.], Emerald ash borer research and technology development meeting; 5Ð 6 October 2004, Romulus, MI. FHTET 2004-15. U.S. Dep. Agric.Ð Forest Service, Forest Health Technology Enterprise Team, Morgantown, WV. [USCB] United States Census Bureau. 2000. Census 2000 geographic terms and concepts. (http://www.census. gov/geo/www/tiger/glossry2.pdf). [USCB] United States Census Bureau. 2001a. Census 2000 Urbanized Areas, Cartographic Boundary Files. (http:// www.census.gov/geo/www/cob/ua2000.html). [USCB] United States Census Bureau. 2001b. Census 2000 Incorporated Places/Census Designated Places, Cartographic Boundary Files. (http://www.census.gov/geo/ www/cob/pl2000.html). [USDA–APHIS] U.S. Department of Agriculture–Animal and Plant Health Inspection Service. 2006a. Asian gypsy moth cooperative eradication program in Orange County, CA: environmental assessment, March 2006. APHIS, Riverdale, MD. (http://www.aphis.usda.gov/ plant_health/ea/downloads/gypsymothorangecountyÞnal. pdf). [USDA–APHIS]. 2006b. Asian gypsy moth cooperative eradication program in Travis County, Texas: environmental assessment, February 2006. APHIS, Austin, TX. (http://www.aphis.usda.gov/plant_health/ea/downloads/ gypsymoth-txÞnal.pdf). [USDA–APHIS] United States Department of Agriculture. 2007. Asian longhorned beetle: Illinois overview map. (http://www.aphis.usda.gov/plant_health/plant_pest_ info/asian_lhb/downloads/Asian longhorned beetlemaps/ il-overview.pdf).
118
JOURNAL OF ECONOMIC ENTOMOLOGY
[USDA–APHIS]. 2008a. Asian gypsy moth cooperative eradication program in Willowbrook, CA: environmental assessment, February 2008. APHIS, Riverdale, MD. (http://www.aphis.usda.gov/plant_health/ea/downloads/ agm-ca-ea-2-13-08.pdf). [USDA–APHIS] United States Department of Agriculture. 2008b. Asian longhorned beetle: New York and New Jersey infestations, overview map. (http://www.aphis. usda.gov/plant_health/plant_pest_info/asian_lhb/ downloads/Asian longhorned beetlemaps/ny-njoverview.pdf).
Vol. 103, no. 1
Wallner, W. E., L. M. Humble, R. E. Levin, Y. N. Baranchikov, and R. T. Carde. 1995. Response of adult lymantriid moths to illumination devices in the Russian Far East. J. Econ. Entomol. 88: 337Ð342. Wu, C., Q. Xiao, and E. G. McPherson. 2008. A method for locating potential tree-planting sites in urban areas: a case study of Los Angeles, USA. Urban For. Urban Greening. 7: 65Ð76. Received 19 June 2009; accepted 30 October 2009.