This transition from automated to manual driving, referred to as the take-over ..... nificant influence of the HMI on the take-over performance. The concepts ... (2015) compared a state-of-the-art steering wheel .... 2014). Modeling the individual driver (specific participant) as an ad- ... driver's visual behavior (Körber et al., 2018).
Accident Analysis and Prevention xxx (xxxx) xxx–xxx
Contents lists available at ScienceDirect
Accident Analysis and Prevention journal homepage: www.elsevier.com/locate/aap
Modeling take-over performance in level 3 conditionally automated vehicles ⁎
Christian Golda, , Riender Happeeb, Klaus Benglera a b
Chair of Ergonomics, Technical University of Munich, Munich, Germany Department Intelligent Vehicles, Delft University of Technology, Delft, The Netherlands
A R T I C L E I N F O
A B S T R A C T
Keywords: Automated driving Take-Over Modeling Driver performance Regression Human factors
Taking over vehicle control from a Level 3 conditionally automated vehicle can be a demanding task for a driver. The take-over determines the controllability of automated vehicle functions and thereby also traffic safety. This paper presents models predicting the main take-over performance variables take-over time, minimum time-tocollision, brake application and crash probability. These variables are considered in relation to the situational and driver-related factors time-budget, traffic density, non-driving-related task, repetition, the current lane and driver’s age. Regression models were developed using 753 take-over situations recorded in a series of driving simulator experiments. The models were validated with data from five other driving simulator experiments of mostly unrelated authors with another 729 take-over situations. The models accurately captured take-over time, time-to-collision and crash probability, and moderately predicted the brake application. Especially the timebudget, traffic density and the repetition strongly influenced the take-over performance, while the non-drivingrelated tasks, the lane and drivers’ age explained a minor portion of the variance in the take-over performances.
1. Introduction Automating the driving task brings along various challenges from a Human Factors point of view and has, therefore, become an important research field within the last years. While we currently see Level 2 (SAE J3016 2016) automated vehicles on the road, where the driver is still responsible for the driving task and has to monitor the automation, Level 3 conditional automation is expected to enter mass production within the next few years (Dokic et al., 2015). In Level 3 conditional automation, the driver is required to neither monitor the driving environment nor the automated system performance. As a result of this, the driver may shift attentional resources to other tasks (SAE J3016 2016). Nevertheless, the driver still has to be available for taking over vehicle control in “situations that exceed the operational limits of the automated driving system” (SAE J3016 2016), detected and announced by the automated system. If we assume flawless automated system performance, within its operational limits, the transition from automated driving to manual mode is one of the most important controllability aspects and affects safety of conditionally automated vehicles. This transition from automated to manual driving, referred to as the take-over performance, is key to a successful deployment of Level 3 automation. Additionally, the take-over process is a fundamental factor in considering various design aspects of the human-machine-interface and the automated driving system. It affects validation, approval and influences current legislative processes (Avery, 2017). A large variety of take-over studies have been conducted within the ⁎
past years, giving insight into drivers’ behavior in take-over situations. Automation effects, known from other domains like overreliance described by Parasuraman and Riley (1997), or mode confusion addressed by Bainbridge (1983), could also apply to the automation of the driving task. Among others, research showed mode confusion and errors (Petermann and Schlag, 2010), delayed responses to critical rear end collision events (Young and Stanton, 2007; Gold et al., 2013; Merat and Jamson, 2009) and impaired driving performance after automated driving (Levitan et al., 1998). These automation effects influence the human performance when taking over vehicle control from the automated driving system. In this manuscript, the time-budget refers to the time available between the take-over request (TOR) and the system limit, which represents a critical event requiring active driver intervention. The driver has to relocate hands and feet to the driving position, regain situation awareness and execute an adequate response to the system limit (see also Kerschbaum et al., 2015; Zeeb et al., 2015; Gold et al., 2013 for the take-over process). The time-budget was proven to determine drivers’ take-over performance (Damböck et al., 2012; Beukel van den and Voort van der, 2013). In an earlier related reported in Gold et al. (2013), drivers intervened after 2.1 s (SD = 0.41) with a time-budget of 5 s, while drivers with a 7 s time budget intervened significantly later (2.9 s, SD = 0.65). In line with these findings, Eriksson et al. (2015) also found effects of the time budget on the decision making time and information preferences. This becomes apparent especially in uncritical events that do not require an immediate reaction (e.g. Eriksson and
Corresponding author.
https://doi.org/10.1016/j.aap.2017.11.009 Received 17 April 2017; Received in revised form 29 October 2017; Accepted 7 November 2017 0001-4575/ © 2017 Elsevier Ltd. All rights reserved.
Please cite this article as: Gold, C., Accident Analysis and Prevention (2017), http://dx.doi.org/10.1016/j.aap.2017.11.009
Accident Analysis and Prevention xxx (xxxx) xxx–xxx
C. Gold et al.
previous publications as summarized in Table 1. The modeling approach is reported in detail in Gold (2016), including additional driver performance metrics and intermediate model versions. The experiments focused on taking over vehicle control from the automation on three-lane highways at a speed of 120 km/h (approx. 75 mph) in critical take-over scenarios. The system limit was represented by two crashed vehicles blocking the current lane. This scenario was selected, as system limits on a highway are most likely to be located ahead and within the current lane of the ego vehicle. The selected scenario is beneficial from a methodical point of view. Situational parameters can be described unambiguously, which facilitates the assessment of driver’s performance and supports replicability of the takeover experiment. To impose an exact time-budget, the situations either suddenly appeared at a certain distance or were masked by a vehicle driving ahead of the ego vehicle that changed lanes right before the accident (thereby concealing the system limit). In order to demand a driver response, there was no automation induced minimal risk maneuver implemented. The TOR was presented as an audio-visual warning signal. Experiments were conducted in rather high fidelity driving simulators (fixed based or dynamic) with full vehicle mockups, a field of view of more than 200 ° and a representation of all driving mirrors.
Stanton, 2017). The traffic density affects task complexity and performance, where high traffic densities lead to delayed responses and reduced take-over quality in situations where a lane change is required to pass an obstacle blocking the driver’s current lane (Radlmayr et al., 2014; Gold et al., 2016). Various studies also investigated effects of performing non-driving-related tasks (NDRTs) just before a take-over situation. While some authors found significant, deteriorating effects of the NDRT (Gold et al., 2015; Zeeb et al., 2016), others found minor detrimental (Radlmayr et al., 2014) or even ameliorating effects of NDRTs on the take-over performance (Neubauer et al., 2012). Automating the driving task is likely to reduce workload and lead to underload, which impairs drivers’ performance and ability to reclaim control by a shrinkage of attentional resources (Young and Stanton, 1997; Young and Stanton, 2002). This could explain the positive effect of NDRT found by Neubauer et al. (2012). Furthermore, the effects of age on the take-over performance seem to be limited (Petermann-Stock et al., 2013; Körber et al., 2016). Finally, a driver’s experience with previous take-over situations is associated with a significantly improved take-over performance (Petermann-Stock et al., 2013). The above insights have been derived from controlled experiments reported in previous literature. Such experiments can only consider a very limited number of one or two independent variables at a time, while other factors are kept constant. Hence the combined effect of different factors influencing the take-over performance remains to be established. The current paper combines the knowledge resulting from several take-over experiments and proposes a quantitative approach for modeling the take-over performance in time-critical take-over scenarios of Level 3 conditional automation. Based on six driving simulator experiments including 753 take-over situations, regression models are presented capturing the take-over performance measures Take-Over Time, minimum Time To Collision (TTC), Brake Application and Crash Probability, and these models were validated using 729 take-over situations from 5 additional experiments of different authors.
2.2. Independent variables Six independent variables were varied within the experiments.
• The Time Budget (TB) is defined as the time between the TOR and • •
2. Methods & results
•
2.1. Design of take-over experiments A large dataset including different influencing factors is needed in order to model the take-over performance in Level 3 conditional automation. Within the last years, the authors conducted a series of driving simulator experiments with a similar design and using comparable equipment, from which an adequate modeling database has been derived. The experimental procedures are reported in detail in
the system limit. The TB determines the driver’s reaction in the takeover situation by creating time pressure and thereby affecting performance. The Traffic Density (TD) within a take-over scenario influences the driver’s reaction, by restricting the opportunities for action and prolonging perceptual as well as decision processes due to a higher number of relevant objects. The Lane. In a similar way, the initial lane (right, center, left) affects the number of maneuvers possible and thereby affects complexity of the situation. The Non-Driving Related Task (NDRT). As drivers in Level 3 conditional automated vehicles will be allowed to shift attention towards tasks other than driving, several NDRTs have been tested regarding their influence on the take-over performance (see section 2.3). The Surrogate Reference Task (SuRT) (ISO/TS 14198, 2012) and a task with a fill-in-the-blank text (Text) were visually distracting, while drivers were able to observe the road with the NDRTs 20 Question Task (20Q), Manual Task (MT) and in the condition
Table 1 Overview of independent variables. No. of Partic.
Time Budget 5
Gold et al., 2013
n=32
X
Gold et al., 2014
n=32
X
Radlmayr et al., 2014
n=32
Gold et al., 2015
n=24
Gold et al., 2016
n=72
5.5
6.1
Traffic Density 7
7.8
X X
0
10
20
NDRT 30
None
Repetition *
20 Q
X
X X X X
SuRT
2-Back
X
X
X
n=4
X
X
X
X
X
X
X
X
X
Körber et al., 2016 Variables under investigation in the study are given in bold letters. * 20 Questions Task. ** Manual Task.
2
X
Left
n=4
X
X
Center
X
X
X
Right
Age
n=1
X
X
Lane
X
X
X
MT
**
X
X
n=12 n=3
X X
X
X
m=28 SD=9 m=32 SD=9 m=34 SD=9 m=28 SD=7 m=23 SD=3 m=67 SD=5
Accident Analysis and Prevention xxx (xxxx) xxx–xxx
C. Gold et al.
(for other TTC definitions see Anon., 2015).
Table 2 Hypotheses for the influence of the different factors on the modeled driver performance metrics.
Time Budget Traffic Density Load due to Non-Driving Related Tasks Eyes-Off-Road Repetition Age
Take-Over Time
Time To Collision
Crash Probability
Brake Probability
Hypothesis + ++ +
Hypothesis ++ −− −
Hypothesis −− ++ +
Hypothesis −− + +
+ Log. − − +
− Log. + +
+ −− 0
+ −− +
• The Crash. As the scenarios were designed to be safety critical,
•
2.4. Summary of experiments
Reads: Line has effect on column. ++ strong positive effect; + positive effect; 0 no effect; − negative effect; − − strong negative effect; Log. logarithmic effect.
• •
2.4.1. Time budget In Gold et al. (2013), take-over scenarios with a TB of 5 s were compared to scenarios with a TB of 7 s and a reference group consisting of manual drivers. Automated driving participants were engaged in the visual-manual SuRT. The take-over was situated in the right lane with no other traffic present. Results showed a prolonged TOT with 7 s TB, with an improved take-over quality compared to the 5 s TB. Accelerations generated by users of automation exceeded accelerations of manually driving participants, even with the higher TB of 7 s.
without a NDRT (None). Visual distraction was expected to prolong the take-over process, as situation awareness decreases and the reallocation of attention required additional time. The Repetition. The factor Repetition is introduced, which represents the number of take-over situations a particular driver experienced. Through this, the novelty effect as well as learning effects were able to be modeled. The Age of the driver is considered an influencing factor on takeover performance, as age affects reaction times, physical skills and driving experience.
2.4.2. Time budget and traffic density In (Gold et al., 2014), automated braking of 3.5 or 5 m/s2 was applied for 1.8 s starting with the TOR. This led to a TB of 5.0 (no automated braking), 5.5 and 6.1 s. Thus, we also tested whether such an automated braking would help to trigger the driver and enhance takeover performance. The TD was varied with either 0 or 30 vehicles per kilometer in the neigboring lane during the take-over situation. While the lane and the different TBs resulting from automated braking had a minor influence on the take-over performance, the TD had a strong influence associated with a higher crash rate and shorter minimal TTCs.
Table 2 provides an overview of the aforementioned selected factors. Bold figures highlight the focus of the specified study. 2.3. Dependent variables
• The Take-Over Time (TOT) measures the time between the TOR
•
participants failed to take-over in a safe way and crashes occurred with either the stationary vehicle in the initial lane or vehicles in the neighboring lanes. The variable Crash represents the frequency of all crashes and indicates the probability of a crash to occur within a certain take-over setting. The Brake Application. While modeling, significant differences became apparent between drivers that applied the brakes within a take-over situation and those that did not brake. Therefore, the Brake Application was included as a dependent variable and is part of the proposed model approach.
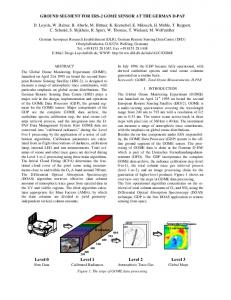
and the maneuver start as a reaction to the system limit (c.f. Fig. 1). This metric is helpful in understanding a driver’s ability to react and an important temporal metric of the take-over performance. The threshold values that determine the start of the maneuver are 2 ° steering wheel angle change and 10% brake pedal actuation (Gold et al., 2013). The Time To Collision (TTC). The minimal TTC that occurred within the take-over situation was derived in order to measure quality aspects of the take-over. The TTC decreases after the TOR while the system limit is approached. This continues until the driver changes lanes or evidently decelerates. The minimum of the TTC is an established surrogate safety and controllability metric (Anon., 2015). We derived TTC up to the point where the vehicle center departed the current lane where the stationary vehicle was present
2.4.3. Traffic density and NDRTs In Radlmayr et al. (2014), the TD (0 and 30 vehicles per kilometer) as well as the modality of the NDRT were varied. Next to the manualvisual SuRT, the cognitive 2-Back task (Reimer et al., 2010) was implemented. Only small effects were measured between the different NDRTs, while the TD strongly affected TOT and crash risk. 2.4.4. NDRTs and repetition The experiment of Gold et al. (2015) complimented the SuRT and 2Back task with the Text task and a manual task (MT) with cognitive load where different shapes had to be fitted through suitable gaps. The MT was performed as a tactile task inside of a box, which served to visually conceal the task, allowing the participant’s eyes to remain on the road. The participants experienced up to 20 take-over situations (factor Fig. 1. Take-Over situation in Level 3 Conditional Automation (Gold, 2016).
3
Accident Analysis and Prevention xxx (xxxx) xxx–xxx
C. Gold et al.
significant effect of the NDRTs (p=0.220) and Eyes-Off-Road (p=0.142) using a significance threshold of α = 0.05, while all other variables were valuable for modeling TOT. The resulting regression has a Root Mean Squared Error (RMSE) of 0.81 s with a corrected coefficient of determination r 2 of 0.43 and is depicted in Eq. (1).
Repetition). Regarding the influence of the NDRTs, the fastest TOT and highest TTCs were measured with the cognitive 2-Back task, while the other tasks induced a slightly lower take-over performance. 2.4.5. Traffic density and age The experiment published by Gold et al. (2016); Körber et al. (2016) focused on TDs of 0, 10 and 20 vehicles per kilometer and considered two age groups with 36 drivers younger than 28 years and 36 drivers older than 60 years. As NDRTs, the conversational 20-Questions task (20Q c.f. Merat et al., 2012) was implemented for one half of the participants. The other half did not have any NDRT (None). While the TOT did not differ between the age groups, younger drivers generated smaller and, therefore, more critical minimal TTC values and drivers’ strategies seemed to vary with more intense braking by the older drivers. The 20-Questions task showed minor effects compared to the group with no NDRT. The TD, however, was confirmed to influence the take-over performance with lower TTCs and higher TOTs with traffic. The resulting data set available for modeling contains the data of 202 participants during 753 take-over situations. Table 2 indicates the expected influence of the aforementioned factors on the take-over performance metrics.
tTOT = 2.068 + 0.329*TB − 0.147*(Lane − 1.936)2 − 0.0056 *(TD − 15.667)2 − 0.571*ln(Repetition) + 2.121*10−4 *(Age − 46.245)2
Although the normal probability plot showed a slight deviation of residuals from the normal distribution, robust regression methods could not significantly improve the model performance and were therefore discarded. Based on an evaluation of residuals and fitted values, homoscedasticity can be assumed. Fig. 3 shows the contribution of the different factors to the TOT. 2.5.2. Modeling time to collision The minimum TTC was likewise modeled by a generalized nonlinear model using “Fair” weighting. Except for Eyes-Off-Road (p=0.710), all considered factors significantly improved the model performance and are included in the model. As a result (Eq. (2)), the RMSE is 1.07 s and r² is 0.63.
2.5. Take-over performance models
tTTC = −3.480 + 0.549*TB − 0.087*(Lane − 1.274)2 + 0.0026
A regression analysis was selected as the modeling method as it facilitates an interpretation of the model with coherences being described by use of linear algebra. To establish model equations for TOT, TTC, Brake Application and Crash, the independent variables were transferred to mathematical expressions. While the TB, TD, Repetition and Age are already numerical, the factors Lane and NDRT had to be encoded (see Tables 3 and 4). Lanes were numbered from “1” (right lane) to “3” (left lane). As illustrated in Table 3, the NDRTs were ordered and coded regarding their expected influence on the take-over performance, in terms of their physical and cognitive load, based on an expert rating. As shown in Fig. 2, the derived order correlates highly with the TTC and moderately with TOT, supporting the expert rating. Fig. 2 also supports coding the condition with no NDRT (None) in between 20 Questions and SuRT as the low arousal levels (hypovigilance) of no NDRT seem detrimental in regard to reaction times, following results of Neubauer et al. (2012) and the model of Young and Stanton (2002). Additionally, the variable Eyes-Off-Road describes if participants were visually distracted at the moment of the TOR, with “1” being eyes off road and “0” being eyes on road. With a maximum of 0.62 (see Table 5), correlations between the above factors are not considered to significantly influence the regression modeling due to collinearity (Mason and Perreault, 1991). The Variance Inflation Factor (VIF) varies between 1.01 and 2.51 and is well below the suggested threshold of 5–10 (Montgomery and Peck, 1992), exceedance of which would indicate an influence of collinearity.
*(TD − 23.789)2 + 0.485*ln(Repetition) + 0.182*NDRT + 0.0087 *Age
tTTC0 = −4.283 + 0.699*TB + 0.0043*(TD − 17.518)² + 0.521 *ln(Repetition) + 0.148*NDRT
Cognitive Load
Total
Encoding
20 Questions None SuRT 2-Back Text Manual Task
0 0 3 0 3 9
3 |−3|* 0 9 6 3
3 3 3 9 9 12
0 1 2 3 4 5
(3)
tTTC1 = −3.584 + 0.513*TB − 0.082*(Lane − 1.314)2 + 0.0022 *(TD − 26.086)2 + 0.425*ln(Repetition) + 0.243*NDRT + 0.019 *Age
(4)
2.5.3. Modeling brake application As described above, the TTC showed a dependence on the Brake Application of the driver within the take-over situation. To assess drivers’ performance completely, a model for the brake probability is required. The binary variable Brake Application is modeled by a logistic regression that gives a probability for the Brake Application as a function of the independent variables (c.f. the logistic function in Eq. (5)). Starting with all factor variables and reducing the equation iteratively by nonsignificant (α = .05) factors led to Eq. (6), with TB, TD, Repetition and Age as significant predictors of Brake Application. The contribution of the factors to t, which is the exponent of e in Eq. (5), is shown in Fig. 6. A larger t indicates a lower probability of Brake Application.
Table 3 Encoding of the NDRTs. Physical Load
(2)
Data for modeling TTC showed homoscedasticity and the normal probability plot indicated a very accurate normal distribution; therefore, no robust regression methods were applied (Fig. 4). There were three reasonable reaction types to the system limit: braking to full stop, braking and changing lanes to pass the obstacle, or changing lanes without braking. An evaluation revealed an influence of the reaction type, namely, the Brake Application on the TTC. Splitting the data set and setting up two regressions led to Eq. (3) (RMSE=0.92; r² = 0.73; n=356) for non-braking situations and Eq. (4) (RMSE=1.20; r² = 0.44; n=397) with braking (Fig. 5). A reduction of the explained variance compared to the joint model was expected, as some variance is reduced by the data set splitting. Nevertheless, the model for non-braking drivers improved but explained less variance for braking participants.
2.5.1. Modeling take-over time The TOT was modeled by a generalized non-linear model with the weight function “Fair” (c.f. Cummins and Webster, 1995) to reduce the influence of extreme values in the data. Factor analysis showed no
Task
(1)
σ = (1 + et )−1
* |-3| indicates detrimental effects of underload.
4
(5)
Accident Analysis and Prevention xxx (xxxx) xxx–xxx
C. Gold et al.
Table 4 Encoding of the data set. Variable
Range
TimeBudget Lane TrafficDensity Repetition NDRT
5 1 (right) 0 [2 − 20] 0 (20 Questions) 0 = Eyes On Road [19 − 79]
Eyes-Off-Road Age
Unit 5.5 2 (center) 10
6.1 3 (left) 20
7 – 30
7.8 – –
– – –
1 (None)
2 (SuRT)
3 (2-Back) 1 = Eyes Off Road
4 (Text)
5 (Manual Task)
σBrake = (1 + e−3.142 + 0.804 * TB − 0.049 * TD + 1.1151 * ln(Repetition) − 0.200 * Age + 0.0021 * Age
2
(6)
Time Budget Lane Traffic Density Repetition NDRT Eyes Off Road Age Variance Inflation Factor
2.5.4. Modeling crash Just like Brake Application, the occurrence of a crash is a binary value and is modeled by a logistic regression. Iteratively excluding nonsignificant factors led to Eq. (7), with TD and Repetition as significant predictors of Crash occurrence (c.f., Fig. 8). Contrary to our hypotheses, TB and NDRT did not contribute significantly to the probability of a crash.
Time Budget
Lane
Traffic Density
Repetition
NDRT
Eyes Off Road
Age
1
0.07 1
−0.13 0.05 1
0.62 0.06 −0.29
0.27 0.00 −0.30
−0.45 −0.08 −0.13
−0.00 0.04 −0.15
1
0.58 1
−0.04 0.17 1
−0.22 −0.34 −0.30
2.511
1.702
1.581
1 1.227
2.333
1.015
1.144
2.6. Validation In a new driving-simulator experiment (Feldhütter et al., 2016), conditions were varied to elicit driver reactions with and without brake application. In addition, four experiments reported in the peer-reviewed literature were used to validate the model. These experiments have a similar design with similar take-over scenarios as in the experiments described in Section 2.4, which were used for modeling. For detailed information on the studies used for validation, refer to the original publications. Table 6 summarizes the validation experiments.
2 + 1.275 In(Repetit ion) −1
*
[−] [years]
Table 5 Correlations and Variance Inflation Factor.
)−1
The quality of a logistic model can be assessed by plotting the true positive rate against the false positive rate (so-called Receiver Operator Characteristic; ROC; see Fig. 7, right). The area under this curve (AUC) “is equivalent to the probability that the classifier will rank a randomly chosen positive instance higher than a randomly chosen negative instance” (Fawcett, 2006), while AUC > 0.9 indicate high model accuracy (Swets, 1988). The AUC of 0.824 suggests a decent predictive characteristic of the Brake Application model, while situations with a high braking probability (c.f. Fig. 7, left) are predicted with higher accuracy. There are different take-over scenarios in the data, where we measured full brake application as well as no braking within the situation. This unexplained variance restrains the model’s performance.
σcrash = (1 + e 4.108 − 0.306 * TD + 0.0071 * TD
[s] [−] [vehicles/km] [−] [−]
)
On the left side of Fig. 9, the predicted crash probability was plotted against the measured crash frequency, highlighting a high accuracy (AUC=0.91) and accurate predictive characteristics of the Crash model.
Fig. 2. TOT and TTC over NDRTs as coded in Table 2.
5
Accident Analysis and Prevention xxx (xxxx) xxx–xxx
C. Gold et al.
Fig. 3. Contribution of the factors to TOT.
over situations. The means deviate by 0.1–0.7 s, which can be considered a very small deviation given that the validation experiments involved different experimental designs and a variation of factors that was not present in the modeling data. The TTC-model also shows a high accuracy in predicting the results of the validation experiments. In combination with an almost perfect fit of the Crash probability model, the controllability of the take-over is modeled quite precisely.
Feldhütter et al. (2016) reported an experiment where the take-over model was validated and the influence of the length of the automated driving period before a TOR was announced (5 vs. 20 min) was examined. For the current validation, only data with comparable automated driving durations (5 min condition) was used. Of the recorded 120 take-over situations, 116 were used for model validation. The TD was varied within participants between 0 and 10 vehicles per km. Furthermore, in the majority of situations, participants were engaged in the SuRT, while in some situations no NDRT was performed. Lorenz et al. (2014) compared three different Human-Machine-Interface (HMI) concepts for supporting the take-over in conditional automated vehicles with a between-subjects design and showed a significant influence of the HMI on the take-over performance. The concepts either presented an ordinary TOR or supported the take-over by presenting a red/green corridor to in a contact analog head-up display. The effects of the HMI-design are not considered as a factor in the models reported, nevertheless, all results were considered for the validation by merging the data regardless of the HMI design. Zeeb et al. (2015) conducted a simulator experiment to assess the influence of different time-budgets (within) and risk levels of drivers (between) on the take-over in a 3 × 3 mixed design. Drivers were categorized into different risk groups based on their gaze behavior. In the study of Zeeb et al., take-over scenarios were designed more critical compared to the modeling data, with short time-budgets and a traffic density (c.f. Table 6). Kerschbaum et al. (2015) compared a state-of-the-art steering wheel to a transforming steering wheel concept in three different take-over situations with a 2-factor within-subjects design. Similar to the HMIconcepts of Lorenz et al. (2014), the differing steering wheel concepts cannot be addressed by the models and data was merged, regardless of the steering wheel concept. Hergeth et al. (2016) used a 4 × 2 design to investigate four different pre-exposure conditions (between) and two take-over situations (within). In two pre-exposure conditions, the drivers experienced a training take-over situation (“Experienced”), while in the other two no take-over situation was presented beforehand (“Inexperienced”). The differing instructions were considered in the modeling by adding the training of the experienced group to the factor Repetition. Validation results are given in Table 7 and Figs. 10–13. The Brake Application shows a moderate fit, as significant model to experiment differences appeared in 4 out of 6 validation experiments. Modeling of Brake Application seems to be difficult, as the same participants in identical situations show very divergent brake reactions. Modeling of the TOT appears to be very accurate and is high valid in the 729 take-
3. Discussion Regression modeling was utilized to develop models capturing takeover performance. Table 8 summarizes the magnitude of the factors included in the performance models. Traffic Density, Repetition and Time Budget were highly influential. This matches the applied experimental data showing substantial effects of Traffic Density (e.g. Radlmayr et al., 2014; Gold et al., 2016), Time Budget (e.g. Gold et al., 2013) and Repetition (e.g. Hergeth et al., 2016; Körber et al., 2016) on take-over performance (see Table 8). Although the Time Budget did not show a significant influence in the Crash risk model, the effect of the Time Budget on the controllability is proven by the TTC model, which is a surrogate traffic safety metric, and likewise captures near miss events. Also because of its continuous characteristic, the TTC has more statistical power in capturing accident risk compared to the binary Crash value. Unlike Crash, the TTC is able to also identify near crash events as a minimum TTC lower than a threshold (e.g. 1s) is a useful crash surrogate (Jonasson and Rootzen, 2014). Traffic Density strongly reduces the take-over performance, especially in scenarios with a medium traffic density of about 20 vehicles per km. Here, the course of action is not obvious, as a lane-change may be possible but difficult and the necessity of strong braking is not clear. With low traffic densities, a lane-change is possible with little effort, while very high traffic densities lead to a rather quick perception of the necessity of an emergency braking maneuver. The repetition of take-over situations significantly improves the take-over performance in all models, as evidenced by a reduced TOT, a reduced Crash risk and an increased TTC. This learning effect could disappear or invert if drivers are confronted with uncritical take-over situations before a critical take-over occurs. Adapting to uncritical events could then lead to a delayed response to a critical TOR with associated consequences for the take-over performance. The initial Lane and Age also showed a significant influence on the take-over performance, but to a smaller extent compared to the previously mentioned factors. In addition to the analysis presented in this paper, these factors require further research and a more systematic variation. Körber et al. (2016) found older drivers had stronger brake reactions (higher
Fig. 4. Contribution of factors to TTC.
6
Accident Analysis and Prevention xxx (xxxx) xxx–xxx
C. Gold et al.
Fig. 5. Contribution of factors to TTC0 (non-braking) and TTC1 (braking).
Fig. 6. Contribution of factors to t of Brake Application. Fig. 7. Predicted brake application and measured brake frequency (left) and ROC (right).
Fig. 8. Contribution of factors to Crash.
cognitive load, which was used to classify the load due to the NDRT, visual distraction was considered as a separate factor (Eyes Off Road), but did not show a significant influence on the dependent variables in any of the models. It can be derived that the NDRT can have both positive and negative effects on TOR-performance, which may partially cancel out in the observed performance metrics. Measurements and modeling of driver state in future research may help disclose the underlying effects, which appear in literature focused on assessing the influence of NDRT on the take-over. For example, Gold et al. (2015) Feldhütter et al. (2016) measured the influence of the NDRT on the TOT. However, the selected NDRTs did not lead to much variance in the considered take-over performance variables, which indicates a small net effect of NDRT on the take-over performance, compared to other factors
longitudinal accelerations) in take-over situations, which is not apparent in the (binary) Brake Application model. Nevertheless, especially older drivers showed an increased TTC when the brakes were used in the takeover situation (c.f. Fig. 5), suggesting a stronger braking application of older drivers, similar to that reported by Körber et al. (2016). The brake probability may, therefore, not necessarily be indicative of the magnitude of a brake application. The NDRTs only became significant when modeling TTC and the effect was opposed to expectations. With increasing load due to the NDRT, the TTC values also rose. Following the MART model (Young and Stanton, 2002), this could be explained by an activation of attentional resources by tasks with cognitive load, or the NDRTs led to an overcompensation through, for example, stronger brake applications and thereby increased TTC values. Next to physical and 7
Accident Analysis and Prevention xxx (xxxx) xxx–xxx
C. Gold et al.
Fig. 9. Predicted crash probability and measured crash frequency (left) and ROC (right).
Table 6 Validation data set. Number of takeovers
Time Budget 4.2
Feldhütter et al., 2016 Lorenz et al., 2014 Zeeb et al. 2015 Kerschbaum et al., 2015 Hergeth et al., 2016
n=116 n=43 n=89 n=270
4.7
Traffic Density 5.2
6
n=29
0
10
n=88 all
n=28
all all
all
all
n=4 n=1 n=1 n=6
all
all
all
n=2
n=33
n=220
30
Repetition
7
all n=27
NDRT None
SuRT
n=15
n=101 all
all
Text
all
Lane
Age
Right
Center
Left
n=58 all all n=180
n=29
n=29
n=90
m=24 m=32 m=42 m=31
n=220
m=30
Pred. 0.4%
Meas. 2.3%
Diff. −1.9%
7.6%
7.1%
0.5%
Table 7 Comparison of validation experiments and model predictions. TOT
Feldhütter et al., 2016
Condition TD0 TD10
Lorenz et al., 2014 Zeeb et al., 2015 Kerschbaum et al., 2015 Hergeth et al., 2016
Experienced Inexperienced
Pred. Mean 1.95 SD 0.97 Mean 3.24 SD 0.98 Mean 2.25 SD 0.98 Mean 1.75 SD 0.98 Mean 2.3 SD 0.98 Mean 2.28 SD 0.09 Mean 2.55 SD 0.2 See Fig. 10
Brake
TTC0 Meas. 1.83 0.53 1.07 0.04
Diff. −0.59 0.15 0.23 0.16 −0.67 0.11 −0.13 0.43 −0.2 0.12 −0.08
Pred. 61.7%
Meas. 42.0%
Diff. 19.7%
76.8%
71.4%
5.4%
32.0%
58.0%
−26.0%
0.7%
0.0%
0.7%
97.8%
89.9%
7.9%
24.5%
28.1%
−3.6%
0.3%
0.0%
0.3%
53.2%
78.0%
−24.8%
2.85
−0.3
72.8%
78.0%
−5.2%
3.02 3.28 0.13 2.62 3.28 0.17 See Fig. 12
Diff. 0.35 0.58 −0.04 1.08
−0.26 −0.66
Pred. 2.26 1.45 1.43 1.47
Crash
Meas. 2.54 0.82 3.01 0.82 2.92 0.87 1.88 0.55 2.5 0.86 2.36
See Fig. 11
Pred. 2.18 1.11 1.03 1.12
TTC1
3.02 0.11 2.62 0.14
Meas. 2.33 1.27 1.73 1.1
Diff. −0.07 0.18 −0.30 0.37
3.28
−0.26
0.3%
0.0%
0.3%
3.28
−0.66
1.1%
0.9%
0.2%
See Fig. 13
Fig. 10. Comparison of validation experiments and model prediction for Take-Over Time.
8
Accident Analysis and Prevention xxx (xxxx) xxx–xxx
C. Gold et al.
Fig. 11. Comparison of validation experiments and models prediction for Brake Application.
Fig. 12. Comparison of validation experiments and model prediction for Time-To-Collision, where TTC0 represents TTC without braking and TTC1 represents TTC with braking.
Fig. 13. Comparison of validation experiments and model prediction for Crash Probability.
like Traffic Density, Repetition or the Time Budget. The Crash model was able to correctly identify the high-risk cases by use of the factors Traffic Density and Repetition (c.f. Fig. 9). According to these results, and in order to avoid unsafe take-over performance, particularly the first take-over situations that a driver experiences should not include medium or high traffic density combined with short time-budgets.
validation shows the validity of the model for data from other simulators, with other instructions and with other driver interfaces. On-road validation will be necessary in order to check for driving simulation related effects. This would require methodological and ethical challenges as well as requirements of the experimental methods, as critical take-overs could only be performed if safe automated functions with minimal risk maneuvers in case of a failing driver become available. The study of Eriksson et al. (2017) indicated good validity of driving simulator results, as it showed strong correlations between the driving simulation and on-road driving in uncritical take-over situations, but also shorter TOTs in the on-road
4. Limitations and scope All data considered was recorded in driving simulator experiments. By using data independent from the modeled data set, the 9
Accident Analysis and Prevention xxx (xxxx) xxx–xxx
C. Gold et al.
Table 8 Hypotheses and model results for the influence of the different factors on the modeled driver performance metrics, using the original modeling data. Take-Over Time
Time Budget Traffic Density Complexity of Non-Driving Related Task Eyes-Off-Road Repetition Age
Hypothesis + ++ + + Log. − − +
Model + Exp. not sign. not sign. Log. − − Exp.
Time To Collision
Crash Probability
Hypothesis ++ −− − − Log. + +
Hypothesis −− ++ + + −− 0
Model ++ Exp. + not sign. Log. + +
Brake Probability Model −− ++ not sign. not sign. Log. − − Exp.
Hypothesis −− + + + −− +
Model not sign. Exp. not sign. not sign. Log. − − not sign.
Reads: Line has effect on column. ++ strong positive effect; + positive effect; 0 no effect; − negative effect; − − strong negative effect; Log. logarithmic effect; Exp. Exponential effect.
Acknowledgement
condition. The driver with his individual properties may significantly determine the take-over reaction and performance (Körber and Bengler, 2014). Modeling the individual driver (specific participant) as an additive factor by mixed effect regression methods explained between 30 and 40 percent additional variance in the take-over performance (see also Gold, 2016). For applying individual performance models, the driver’s characteristics have to be known, which usually is not the case and hence this approach was not pursued in this manuscript. Future research could model individual driver characteristics, or even timevarying driver states, for example, using driver monitoring data, or driver’s individual automation trust level, which was found to relate to driver’s visual behavior (Körber et al., 2018). The scenarios and the HMI-concepts are abstracted versions of possible future vehicle functions, for example without the implementation of a minimal risk maneuver. New automation-related HMI concepts like those presented by Lorenz et al. (2014), or combined auditory, haptic and visual, take-over warning modalities like those proposed by Petermeijer et al. (2017), were not included in the modeling data. Nevertheless, it is assumed that the selected scenarios (blocked lane in the current lane of a highway) and HMI characteristics are well suited to reveal driver performance limits and to assess the take-over performance of Level 3 conditional automated vehicles in a systematic and replicable way. Despite the high experimental effort, some factors like fatigue in relation to prolonged driving or trust in automation could not be considered in the models. The validation with independent data shows that the models are valid for similar take-over experiments with small Time Budgets and comparable scenarios. They may not be appropriate in scenarios that deviate from the data used for the modeling approach. As such, non-critical take-over scenarios with long time budgets that do not require an immediate driver response, are likely to show deviating results. The transparent modeling approach, nevertheless, allows a subsequent extension of the previous models by adding new factors.
A sincere thank you to Antonia Conti-Kufner for her diligent proofreading of this paper. References Anon, 2015. Handbuch Fahrerassistenzsysteme. Grundlagen, Komponenten Und Systeme für Aktive Sicherheit Und Komfort. In: Winner, H., Hakuli, S., Lotz, F., Singer, C. (Eds.), 3 ed. Vieweg + Teubner (ATZ/MTZ-Fachbuch), Wiesbaden (überarbeitete und ergänzte Auflage.). Avery, Matthew, 2017. Assisted to Automated Driving – Developing Future Test and Rating Procedures. In Aktive Sicherheit Und Automatisiertes Fahren – 3. Interdisziplinärer Expertendialog (IEDAS). Expert Verlag Essen, Germany, pp. 113–121. Bainbridge, Lisanne, 1983. Ironies of automation. Automatica 19 (6), 775–779. van den Beukel, A.P., van der Voort, M.C., 2013. The influence of time-criticality on Situation Awareness when retrieving human control after automated driving. In Proceedings of the 16th International IEEE Annual Conference on Intelligent Transportation Systems (ITSC 2013) 16 2000–2005. http://dx.doi.org/10.1109/ ITSC.2013.6728523. Cummins, David J., Webster, Andrews C., 1995. Iteratively reweighted partial least squares: a performance analysis by monte carlo simulation. In Journal of Chemometrics 9, 489–507. Damböck, Daniel, Farid, M., Tönert, L., Bengler, K., 2012. Übernahmezeiten beim hochautomatisierten fahren. In: 5. Tagung Fahrerassistenz. Munich, Germany 5. Dokic, Jadranka, Müller, Beate, Meyer, Gereon, 2015. European Roadmap Smart Systems for Automated Driving. Edited by European Technology Platform on Smart Systems Integration. EPoSS, Berlin. Eriksson, A., Stanton, N.A., 2017. Take-over time in highly automated vehicles: noncritical transitions to and from manual control. Hum. Factors. http://dx.doi.org/10. 1177/0018720816685832. Eriksson, Alexander, Marcos, Ignacio Solis, Kircher, Kircher, Västfjäll, Daniel, Stanton, N.A., 2015. The development of a method to assess the effects of traffic situation and time pressure on driver information preferences. In: International Conference on Engineering Psychology and Cognitive Ergonomics. Springer, Cham. pp. 3–12. Eriksson, A., Banks, V.A., Stanton, N.A., 2017. Transition to manual: comparing simulator with on-road control transitions. Accid. Anal. Prev. 102, 227–234. http://dx.doi.org/ 10.1016/j.aap.2017.03.011. Fawcett, Tom, 2006. An introduction to ROC analysis. Pattern Recognition Lett. 27 (8), 861–874. http://dx.doi.org/10.1016/j.patrec.2005.10.010. Feldhütter, A., Gold, C., Schneider, S., Bengler, K., (2016). How Duration of Automated Driving Influences Take-Over Performance and Gaze Behavior. In 62. GfAFrühjahrskongress – Arbeit in komplexen Systemen – Digital, vernetzt, human?! 62. Gold, C., Dambock, D., Lorenz, L., Bengler, K., 2013. Take over! How long does it take to get the driver back into the loop? Proc. Hum. Factors Ergon. Soc. Ann. Meeting 57 (1), 1938–1942. http://dx.doi.org/10.1177/1541931213571433. Gold, Christian, Lorenz, Lutz, Bengler, K., 2014. Influence of automated brake application on take-Over situations in highly automated driving scenarios. In: Proceedings of FISITA World Automotive Congress. Maastricht, Netherlands. Gold, C., Berisha, I., Bengler, K., 2015. Utilization of drivetime – performing non-Driving related tasks while driving highly automated. Proc. Hum. Factors Ergon. Soc. Ann. Meeting 59 (1), 1666–1670. http://dx.doi.org/10.1177/1541931215591360. Gold, C., Körber, M., Lechner, D., Bengler, K., 2016. Taking over control from highly automated vehicles in complex traffic situations: the role of traffic density. In human factors. The J.e Hum. Factors Ergon. Soc. http://dx.doi.org/10.1177/ 0018720816634226. Gold, C., 2016. Modeling of Take-Over Performance in Highly Automated Vehicle Guidance. Technische Universität München, München.L ehrstuhl für Ergonomie. Hergeth, Sebastian, Lorenz, Lutz, Krems, F. Josef, 2016. Prior familiarization with takeover requests affects drivers' takeover performance and automation trust. Hum. Factors. http://dx.doi.org/10.1177/0018720816678714. ISO/TS 14198, 2012. Road Vehicles – Ergonomic Aspects of Transport Information and Control Systems – Calibration Tasks for Methods Which Assess Driver Demand Due to
5. Summary Based on 753 take-over situations, models of the key take-over performance variables in Level 3 conditional automated vehicles have been developed. The models give insight into the effects of key factors influencing driver performance in take-over scenarios. Validation of the accuracy of the model was performed through a large, combined data set, containing results of different peer-reviewed experiments of different authors. While Brake Application showed substantial dispersion in the modeling data and was not well predicted, the models for TakeOver Time, Time To Collision and Crash Probability showed very reliable predictions and supported model validity. The models allow detailed insights into the coherences and influencing factors when considering take-over performance in time-critical scenarios of Level 3 conditional automated vehicles. 10
Accident Analysis and Prevention xxx (xxxx) xxx–xxx
C. Gold et al.
1071181312561415. Parasuraman, Raju, Riley, Victor, 1997. Humans and automation: use, misuse, disuse, abuse. In human factors. J. Hum. Factors Ergon. Soc. 39 (2), 230–253. http://dx.doi. org/10.1518/001872097778543886. Petermann, I., Schlag, B., 2010. Auswirkungen der synthese von assistenz und automation auf das fahrer-Fahrzeug system. Proceedings of the AAET. Petermann-Stock, I., Hackenberg, L., Muhr, T., Mergl, C., 2013. Wie lange braucht der Fahrer? Eine Analyse zu Übernahmezeiten aus verschiedenen Nebentätigkeiten während einer hochautomatisierten Staufahrt. In: 6. Tagung Fahrerassistenzsysteme. Munich, Germany 6. Petermeijer, S.M., Cieler, S., de Winter, J.C.F., 2017. Comparing spatially static and dynamic vibrotactile take-over requests in the driver seat. Accid. Anal. Prev. 99 (Pt. A), 218–227. http://dx.doi.org/10.1016/j.aap.2016.12.001. Radlmayr, J., Gold, C., Lorenz, L., Farid, M., Bengler, K., 2014. How traffic situations and non-Driving related tasks affect the take-Over quality in highly automated driving. Proc. Hum. Factors Ergon. Soc. Ann. Meeting 58 (1), 2063–2067. http://dx.doi.org/ 10.1177/1541931214581434. Reimer, B., Mehler, B., Wang, Y., Coughlin, J.F., 2010. The impact of systematic variation of cognitive demand on drivers’ visual attention across multiple age groups. Proc. Hum. Factors Ergon. Soc. Ann. Meeting 54 (24), 2052–2055. http://dx.doi.org/10. 1177/154193121005402407. SAE International, 2016. Taxonomy and Definitions for Terms Related to Driving Automation Systems for On-Road Motor Vehicles (J3016_201609). Swets, A. John, 1988. Measuring the accuracy of diagnostic systems. Science 240 (4857), 1285–1293 (Checked on 10 August 2015). Young, S. Mark, Stanton, N.A., 1997. Automotive automation: investigating the impact on driver mental workload. Int. J. Cognitive Ergon. 1 (4), 325–336. Young, S. Mark, Stanton, Neville A., 2002. Malleable Attentional Resources Theory: a new explanation for the effects of mental underload on performance. Hum. Factors 44 (3), 365–375. Young, S. Mark, Stanton, N.A., 2007. Back to the future: brake reaction times for manual and automated vehicles. Ergonomics 50 (1), 46–58. http://dx.doi.org/10.1080/ 00140130600980789. Zeeb, Kathrin, Buchner, Axel, Schrauf, Michael, 2015. What determines the take-over time? An integrated model approach of driver take-over after automated driving. Acc. Anal. Preven. 78, 212–221. http://dx.doi.org/10.1016/j.aap.2015.02.023. Zeeb, Kathrin, Buchner, Axel, Schrauf, Michael, 2016. Is take-over time all that matters? The impact of visual-cognitive load on driver take-over quality after conditionally automated driving. Acc. Anal. Prev. 92, 230–239. http://dx.doi.org/10.1016/j.aap. 2016.04.002.
the Use of In-vehicle Systems. Jonasson, K. Jenny, Rootzen, H., 2014. Internal validation of near-crashes in naturalistic driving studies: a continuous and multivariate approach. Accid. Anal. Prev. 62, 102–109. http://dx.doi.org/10.1016/j.aap.2013.09.013. Körber, Moritz, Bengler, Klaus, 2014. Potential individual differences regarding automation effects in automated driving. Proceedings of the XV International Conference on Human Computer Interaction (ACM) 1–7. http://dx.doi.org/10.1145/2662253. 2662275. Körber, Moritz, Gold, Christian, Lechner, David, Bengler, Klaus, 2016. The influence of age on the take-over of vehicle control in highly automated driving. In Transportation Research Part F. Traffic Psychol. Behav. 39, 19–32. http://dx.doi.org/10.1016/j.trf. 2016.03.002. Körber, M., Baseler, E., Bengler, K., 2018. Introduction matters: manipulating trust in automation and reliance in automated driving. Appl. Ergon. 66, 18–31. http://dx.doi. org/10.1016/j.apergo.2017.07.006. Jg., S. Kerschbaum, Philipp, Lorenz, Lutz, Bengler, Klaus, 2015. A transforming steering wheel for highly automated cars. IEEE Intelligent Vehicles Symposium (IV). pp. 1287–1292 (checked on 11/6/2015). Levitan, Lee, Golembiewski, Gary, Bloomfield, R. John, 1998. Human factors issues for automated highway systems. In ITS Journal – Intelligent Transportation Systems Journal 4 (1–2), 21–47. http://dx.doi.org/10.1080/10248079808903735. Lorenz, L., Kerschbaum, P., Schumann, J., 2014. Designing take over scenarios for automated driving: how does augmented reality support the driver to get back into the loop? Proc. Hum. Factors Ergon. Soc. Ann. Meeting 58 (1), 1681–1685. http://dx.doi. org/10.1177/1541931214581351. Mason, H. Charlotte, Perreault, D. William, 1991. Collinearity, power, and interpretation of multiple regression analysis. J. Market. Res. 28 (3), 268. http://dx.doi.org/10. 2307/3172863. Merat, N., Jamson, A.H., 2009. How do drivers behave in a highly automated car? Proceedings of the 5th International Driving Symposium on Human Factors in Driver Assessment, Training and Vehicle Design 5, 514–521. Merat, N., Jamson, A.H., Lai, F.C.H., Carsten, O., 2012. Highly automated driving, secondary task performance, and driver state. Hum. Factors: J. Hum. Factors Ergon. Soc. 54 (5), 762–771. http://dx.doi.org/10.1177/0018720812442087. Montgomery, C. Douglas, Peck, A. Elizabeth, 1992. Introduction to Linear Regression Analysis, 2nd ed. Wiley (Wiley series in probability and mathematical statistics. Applied probability and statistics), New York. Neubauer, C., Matthews, G., Saxby, D., 2012. The effects of cell phone use and automation on driver performance and subjective state in simulated driving. Proc. Hum. Factors Ergon. Soc. Ann. Meeting 56 (1), 1987–1991. http://dx.doi.org/10.1177/
11