knowledge of Mathematics, language, major technical courses and practices; and ... of Mathematics and Physical Sciences Research ISSN 2348-5736 (Online).
International Journal of Mathematics and Physical Sciences Research ISSN 2348-5736 (Online) Vol. 4, Issue 1, pp: (1-14), Month: April 2016 - September 2016, Available at: www.researchpublish.com
Modeling the Performance of Students Completing Technical Secondary Education in Rwanda: Quantile Regression Approach 1
MUNYANKUMBURWA Fidele, 2Dr. MUNG’ATU Kyalo Joseph
1
Student at Jomo Kenyatta University of Agriculture and Technology (Kigali Campus), Master of Science in Applied Statistics 2 Lecturer at Jomo Kenyatta University of Agriculture and Technology/Kenya, College of Pure and Applied Sciences
Abstract: Quantile Regression Model (QRM) is preferred by current study than Ordinary least Square (OLS) because it does not only represent a central tendency of a distribution, but it is also robust to the presence of outliers as it does concern with the behavior at quantiles distribution. The objective of the study is to apply this approach to analyze and create robust models for data on the performance of 21595 and 21185 students who completed Technical Secondary Education in Rwanda for consecutive years 2013 and 2014 respectively. The study findings revealed that the option that a student pursued; and the knowledge of major technical courses, language, mathematics and practices have a positive effect on the performance of that student. Furthermore, the effect of language and mathematics on the performance is larger than that for other covariates. The nonparametric quantile regression methods that have been used to approve the results obtained by parametric quantile methods also exposed a positive effect of covariates on the response variable. Keywords: Quantile, Regression, Performance, Covariates, Score.
I. INTRODUCTION 1.1. Background of the study: Quntile regression approach is recent and it was introduced by Koenker and Basset in 1978 who found that the unconditional quantile regression model is applied to many research areas especially in Econometric and Statistics. The theoretical and empirical studies on estimation of quantile regression models and models on performance of students have been conducted by various researchers and the most known literatures used by the study are Koenker ( 1978), Koenker and Xiao (2004), Xiao (2009), Yu, Lu and Stander (2003), Isabel, Javier, Vincente , Altea and Carmen (2003), Xiao(2005), Shan and Yang (2009), Basset and Koenker (2009), Ghouch and Genton (2010), Zongwu and Xiao(2009), Yen, Wang and Suen (2009), Eikner and Montondon (2001), Escanciano and Goh (2014), Zhijie (2005), Marcus, Harding and Lamarche (2011), Yeh, Wang and Suen (2009), Keming, Zudi and Stander(2003), Kim(2007), Lynn and Backmon (2006), Winter and Dodou (2011), and Koenker (2011). The current study is focusing on modeling the performance of students completing Technical Secondary Education in Rwanda. That performance is defined by the overall grade that a student obtains as the award after passing national exams. To estimate the Quintile Regression Model, the study uses covariates like option that a student pursued, and knowledge of Mathematics, language, major technical courses and practices; and this knowledge is measured by the scores obtained from the courses done in national exams conducted in two consecutive years 2013 and 2014. The study uses different approaches for modeling by estimating the parametric and nonparametric quantile regression models. The study eventually evaluates the validity, accuracy and specifications of estimated models to make a comparison of results.
Page | 1 Research Publish Journals
International Journal of Mathematics and Physical Sciences Research ISSN 2348-5736 (Online) Vol. 4, Issue 1, pp: (1-14), Month: April 2016 - September 2016, Available at: www.researchpublish.com 1.2. Statement of the problem: The quantile regression model has an added advantage than the OLS model because it is robust to the preference of outliers and it doesn’t only concern with the mean and median behavior (Yen, Wang and Suen, 2009). In addition Cody, Amy, Andrea, and Lawrence (2012) find that the quantile regression model produced estimates that were more unbiased than the estimates produced by linear regression model when the data do not follow the assumed distribution (Normality). Yu, Lu and Stander (2003) confirm that the standard linear regression model does not provide a complete picture of relationship between dependent and independent variables. Based on findings of (Yen, Wang and Suen, 2009), Yu, Lu and Stander (2003) and Cody, Amy, Andrea, and Lawrence (2012) the models estimated using linear regression model are not robust, they need to be improved so that their estimates can be more unbiased and less sensitive to outliers as the linear regression model concerns mean and therefore mean is sensitive to outliers. Furthermore, there is no robust model estimated by the ministry of education in Rwanda or any other independent researcher to explain the model of student’s performance in Rwanda. 1.3 Objectives and Hypothesis: 1.3.1 General objective The general objective of the study is to apply quantile regression for modeling the performance of students completing technical secondary education in Rwanda using covariates such as option pursued by a student; and knowledge of mathematics, language, major technical courses and practices. 1.3.2 Specific objectives The specific objectives of this study are as follows: i. To investigate the applicability of quantile regression approach for Students performance in consecutive schools years 2013 and 2014. ii. To model the effect of covariates (option pursued by a student and student’s knowledge of Mathematics, Language, major technical courses and practices) on the performance of students. iii. To fit the quantile regression model for the performance of students completing Technical Secondary Education in Rwanda given the highlighted covariates. 1.4 Research Hypotheses: The research hypotheses of our study are as follows: i. ii. iii.
H0: there is no difference between quantiles (equality of slopes) for Quantile Regression Models estimated for performance data in 2013 and 2014. H0: there is no effect of covariates (option, major technical course, language, math and practice) on the performance of a student. H 0:
i 0 (this
means that the coefficients
i in
the fitted quantile regression model are not statistically
significant).
II. METHODOLOGY This research is based on quantitative research methods. It uses the secondary data collected and stored in examination database from Workforce Development Authority in Rwanda. The study firstly explores the data and investigates the distribution of the data in order to create models using the quantile functions. The study applies the theories and concepts developed in various literatures: Koenker (1978), Koenker and Machado (1999), Koenker and Xiao (2004), Basset and Koenker (2009) , Xiao(2005), Xiao (2009), Yu, Lu and Stander (2003), Isabel, Javier, Vincente , Altea and Carmen (2003), Shan and Yang (2009), Ghouch and Genton (2010) , etc. 2.1 Estimation of parametric Quantile regression model: The standard linear regression model which is usually used to model the data is of the form
y X T
(2.1)
Page | 2 Research Publish Journals
International Journal of Mathematics and Physical Sciences Research ISSN 2348-5736 (Online) Vol. 4, Issue 1, pp: (1-14), Month: April 2016 - September 2016, Available at: www.researchpublish.com Where
X (1, x)T , ( 0 , 1 )T y = dependent variable and x= independent variable.
This is OLS model which is has assumptions like normality, and it not robust as it only concerns with the conditional mean of distribution not quantiles of distributions. From this reason the study will focus on the theories of Quantile Regression Models (QRMs) and apply them to the performance of students completing Secondary Education in Rwanda. Let Y be a random variable with cumulative distribution function FY ( y ) , we have
FY ( y) P(Y y)
(2.2)
The quantile function is given by
QY ( ) FY1 ( ) inf{ y : FY ( y) } , [0,1]
(2.3)
From the estimated OLS model in (2.1) let deduce the parametric quantile regression model which is described as
yi 0 1 xi i , i {1,..., n} Where
0 , 1 R
and
i ~ H
(2.4)
verifying H (0) . The estimators of the model
0 and 1
are computed by
solving the following equation
( 0 , 1 ) arg min { yi 0 1 xi (1 ) yi 0 1 xi } ( 0 , 1 )R 2 yi A
(2.5)
yi A
The Quantile Regression Model (QRM) coefficients can be expressed in the general form p
p
j 1
j 1
Q ( yi xi ) j xij yi j xij i The assumption here is that
i
(2.6)
has a distribution whose th quantile is Zero and it is Independent and Identically
Distributed. As OLS, the QRM use some measures like Standard Errors (
S j ) used to calculate confidence intervals (CI) and test
hypothesis; in this case C.I ˆ j Z / 2 S j 2.2
Tests for Quantile regression Model:
The current study uses test statistics suggested by Koenker and Machado (1999), and Yu, Lu and Stander (2003) Let the null Hypothesis be
Where H0 is rejected when
H 0 : j 0 ( ˆ j 0) S j
z / 2
Let be a quantile we have the objective function which is
V (b( ))
y
y i xt b
where
(
V (b(0.5))
t
t
xt b
(1 ) y
y i xt b
t
xt b } ( t )
(2.7)
) t ( I ( t 0)) . For instance the case of =0.5, the Objective function is
0 .5 y
y i xt b
t
xt b
(1 0.5) y
y i xt b
t
xt b }
y
y i xt b
t
xt b , and this is the median conditional
regression. This Objective function is different from the one for OLS which instead computes the mean conditional regression. To test the reliability of the QRM the study also uses the Likelihood Ratio test.
Page | 3 Research Publish Journals
International Journal of Mathematics and Physical Sciences Research ISSN 2348-5736 (Online) Vol. 4, Issue 1, pp: (1-14), Month: April 2016 - September 2016, Available at: www.researchpublish.com Let consider first of all the asymmetric Laplacian density of the form
f1 (u ) (1 ) exp (u ))
(2.8)
The log likelihood under the assumption that u i yi xi will be
l ( ) n log( (1 )) ( y i xi )
(2.9)
Let consider the model of conditional quantile function
Qyi ( / x) xi1 1 ( ) xi2 2 ( )
(2.10)
The estimates ˆ ( ) are defined as the minimizers of objective function
~ Vˆ ( ) min ( yi xib) , and ( ) the minimizer of bR p
~ V ( ) min ( yi xib1 )
(2.11)
b1R p q
Koenker and Machado (1999) denote that
Vˆ ( )
is the objective function of the unrestricted model and
~ V ( ) is
the
objective function of the restricted model. Let
2 (1 ) , from (2.11) we have
l ( ˆ ( )) log( (1 )) ( yi xi ) ~ l ( ( )) log( (1 )) ( yi xi1 )
~ ~ 2 log n ( ) 2(l (ˆ ( ) l ( ( ))) 2(V ( ) Vˆ ( ))
(2.12)
From the standard Likelihood Ratio Test 2 log n ( ) Koenker and Machado (1999) show that under H0 the likelihood test statistic is
~ 2{V (b( )) Vˆ (b( ))} , LR 2 ( ) In this case
( )
is asymptotically to
(2.13)
1 , where f ( ) is the height of the error density at the chosen quantile and the identity (2.13) f ( )
2 q
2.3 Goodness of fit for Quantile regression Model: To calculate the goodness of fit for the parametric quantile regression, the study uses the goodness-of-fit which is the Pseudo-R2 suggested by (Koenker & Machado, 1999) and (Furno, 2011)
~ Pseudo R 2 1 Vˆ ( ) V ( )
(2.14)
2.4 Nonparametric methods for quantile regression: In this study the researcher will use the nonparametric conditional quantile. In this case the study will use the nonparametric quantile model as suggested by Isabel, Javier, Vincente, Altea and Carmen (2003). The nonparametric regression model is
Page | 4 Research Publish Journals
International Journal of Mathematics and Physical Sciences Research ISSN 2348-5736 (Online) Vol. 4, Issue 1, pp: (1-14), Month: April 2016 - September 2016, Available at: www.researchpublish.com
yi f ( xi ) i
i {1,..., n}
(2.15)
Where f is unknown smooth function and [0,1] , this assumption here is that the -th quantile of the error term i conditional on the covariate x is assumed to be zero Q ( i ( xi
x) 0 . The estimation of the smooth faction is of the
form n
fˆ ( x) , ( xi ) y i
(2.16)
1
Where is a smoothing parameter and
, is the function of weights (kernel type, spline, etc) proposed by Koenker
(2004).
III.
RESULTS AND DISCUSSION
3.1 Dataset Description: This study has one dependent variable (performance), four explanatory variables (Major technical courses, Math, Language and Practices) which are continuous and one explanatory variable (Option) which is nominal. Table 1: Variables description
Variable Option Technical Math Language Practices
Description Option that a student pursued Knowledge of the major technical courses Knowledge of Math Knowledge of language Knowledge of practices (technical and professional)
The performance of students is measured by the grade obtained by a student after evaluating his performance in courses performed in national Exams. The grades vary from 0 to 60. The explanatory variables which are continuous are measured by scores or marks obtained in highlighted courses out of 100. 3.2 Descriptive Statistics for response and continuous covariates: This study is analyzing the performance of 21595 and 21185 students who sat for national exams completing technical secondary education in Rwanda for two consecutive school years 2013 and 2014 respectively. Table 2: Descriptive statistics for performance data
Year 2013
Number of Observations Std. Deviation Skewness Minimum Maximum Percentiles
1st 5th 10th 25th
Performance 21595 0 9.303 0.843 0 57 5 8 9 12
Major technical course 21591 4 15.914 0.352 0 97 4 12 16 25
Language 21586 9 13.4569 0.62205 0 90 2 6 9 16
Math 21593 2 12.831 1.218 0 89 0 2 3 6
Practices 21594 1 7.645 -0.699 0 99 63 69 72 76
50th 75th 90th 95th 99th
18 25 33 38 46
35 47 58 65 78
24 34 44 50 62
14 23 34 42 57
81 87 91 93 96
Valid Missing
Page | 5 Research Publish Journals
International Journal of Mathematics and Physical Sciences Research ISSN 2348-5736 (Online) Vol. 4, Issue 1, pp: (1-14), Month: April 2016 - September 2016, Available at: www.researchpublish.com Year 2014
Number of Observations
Valid Missin g
Std. Deviation Skewness Minimum Maximum Percentiles
1st 5th 10th 25th 50th 75th 90th 95th 99th
Performance 21185
Major technical course
Language
Math 21099
Practices 21157
21098
21098
0
87
87
86
28
9.969 0.447 0 59 4 6 8 13 20 28 35 38 45
21.8 -0.14 0 100 4 12 19 34 51 67 78 84 92
17.485 0.097 0 98 8 16 23 34 46 57 69 76 87
19.99 0.621 0 94 0 1 3 9 23 41 56 64 77
7.972 -0.66 17 100 61 70 72 77 83 88 92 94 97
The data shows that the minimum grade is 0 in both two consecutive school years while the maximum grade is 57 in 2013 and 59 in 2014. Note that the optimal maximal grade should be 60. For the covariates the minimum score is 0 out of 100 in both two schools years except the minimal score for practices in 2014 which is 17. The maximum score vary per covariate and per school year. The skewness of the data shows that for some variables the frequency distributions are positively skewed others are negatively skewed, this means that the data are not perfectly normally distributed for all variable. This implies that the quantile regression approach would be suitable for the model. As the aim of this study is to estimate the quantile regression model, where the study should examine the estimates behaviors at each quantile of distribution (lower, medium and upper); the table 2 also shows the optimal grades (for performance) or optimal scores (for covariates) at each percentile (1st , 5th, 10th, 25th, 50th, 75th, 95th and 99th). 3.3 Detecting outliers in response variable and covariates: To detect the outliers, the study is using the much known approach called boxplot. Before estimating the quantile regression model detecting outliers is essential as Yen, Wang and Suen, (2009) argue that the added value for quantile regression approach to OLS approach is that the first approach can also concern the influential values while the last approach cannot. The presence of outliers means that OLS regression would be biased and inaccurate when used because it can be highly influenced by those outliers. a)
Performance:
Page | 6 Research Publish Journals
International Journal of Mathematics and Physical Sciences Research ISSN 2348-5736 (Online) Vol. 4, Issue 1, pp: (1-14), Month: April 2016 - September 2016, Available at: www.researchpublish.com b)
Covariates:
Figure 1: Boxplots of response variable and covariates in 2013 and 2014
The boxplots of performances show the outliers in the data for 2013 and 2014. Otherwise, covariates have outliers except the option that a student pursued in both consecutive school years and technical major courses in 2014 (fig.1). This implies that the Quantile regression approach would be preferred to create models than the OLS model. 3.4 Normality Test: Cody, Amy, Andrea, and Lawrence (2012) find that both OLS and Quantile regression methods performed well in the simulations when the data follow the assumed distribution; but when the data do not follow the assumed distribution the least square estimates are often biased. In the current study the quantile regression model doesn’t assume any distribution; to sow that it is better performing than the ignored OLS model let first test the normality. To test the normality for the observation greater than 5000 with Shapiro-Wilk W test do not apply, from this reason the study used the KolmogorovSmirnov test in order to test the normality of the performance for students completing Secondary schools in Rwanda as the number of observations is greater than 5000. Table 3: Kolmogorov-Smirnov test
School year
Statistic
P-Value
2013
D = 0.0060107
p-value = 0.4162
2014
D = 0.0053352
p-value = 0.5827
Alternative hypothesis: two-sided From table 5 the study failed to reject the null hypothesis that the data is normally distributed at significance level of 5%. This implies that the regression model used by the current study does not assume any distribution; therefore OLS methods are not suitable to estimate the model. 3.5 Quantile regression model: 3.5.1 Test of equality of slopes: The test in table 4 is known as Wald test and it is applied for the performance data for 2013 and 2014 at the quantiles (0.1, 0.2, 0.25, 0.5, 0.75 and 0.95). H0: the estimates for quantiles are statistically equal versus H1: the estimates for all quantiles are not statistically equal.
Page | 7 Research Publish Journals
International Journal of Mathematics and Physical Sciences Research ISSN 2348-5736 (Online) Vol. 4, Issue 1, pp: (1-14), Month: April 2016 - September 2016, Available at: www.researchpublish.com Table 4: Test of equality of slope for performance data
School year
Df
Resid
Df
F value
Pr(>F)
2013
1
25
129473
120.36
2.2e-16 ***
2014
1
25
126467
86.919
2.2e-16 ***
Signif. codes: .000 ‘***’ 0.001 ‘**’ 0.01 ‘*’ 0.05 ‘.’ 0.1 ‘ ’ 1 Notes: Df = degree of freedom, Resid= residuals, F Value= Fisher Statistic, Pr = P- Value Considering the significance column of table 4, the information reveals that the P-value is less than .000; therefore the test significantly rejects equality of the estimated coefficients for the quantiles in each case. This also implies that the use of quantile regression approach is appropriate in the research. 3.5.2 Model Construction and Interpretation: In the model there are coefficients estimate for selected sample quantiles:10th , 25th, 50th , 75th and 95th ; the standards errors and confidence interval for quantile regression coefficient estimates which are obtained by bootstrapping methods suggested by Koenker and Hallock (2001). Table 5: Coefficients for quantile regression model for performance in 2013
Performance q10 Option Major technical Courses Language Mathematics Practices _cons q25 Option Major technical Courses Language Mathematics Practices _cons q50 Option Major technical Courses Language Mathematics Practices _cons q75 Option Major technical Courses Language Mathematics Practices _cons q95 Option Major technical Courses Language Mathematics Practices _cons
Coef.
Std. Err.
t
P>t
[95% Conf.Interval]
0.0921183 0.1630191 0.1950206 0.2092207 0.1153451 -9.764805
0.0051545 0.0024063 0.0058977 0.0036255 0.0055862 0.4417941
17.87 67.75 33.07 57.71 20.65 -22.1
0.000 0.000 0.000 0.000 0.000 0.000
0.0820151 0.1583025 0.1834606 0.2021144 0.1043958 -10.63075
0.102222 0.167736 0.206581 0.216327 0.126295 -8.89886
0.1274816 0.1877471 0.2200695 0.2080796 0.162192 -13.26633
0.0072566 0.0016519 0.0041505 0.0046202 0.0036818 0.3136032
17.57 113.65 53.02 45.04 44.05 -42.3
0.000 0.000 0.000 0.000 0.000 0.000
0.1132581 0.1845092 0.2119342 0.1990236 0.1549753 -13.88102
0.141705 0.190985 0.228205 0.217136 0.169409 -12.6516
0.2037095 0.2172196 0.2336521 0.2035601 0.2059704 -15.87299
0.0062494 0.0015307 0.0034722 0.002727 0.0047916 0.4238257
32.6 141.91 67.29 74.65 42.99 -37.45
0.000 0.000 0.000 0.000 0.000 0.000
0.1914603 0.2142192 0.2268464 0.1982149 0.1965785 -16.70372
0.215959 0.22022 0.240458 0.208905 0.215362 -15.0423
0.2536422 0.2412297 0.2407663 0.1955447 0.2233014 -15.62864
0.0112317 0.0039738 0.003659 0.0032878 0.0052867 0.4220181
22.58 60.7 65.8 59.48 42.24 -37.03
0.000 0.000 0.000 0.000 0.000 0.000
0.2316272 0.2334407 0.2335945 0.1891004 0.212939 -16.45583
0.275657 0.249019 0.247938 0.201989 0.233664 -14.8015
0.3185911 0.2786875 0.1914168 0.2336471 0.2368048 -13.83869
0.0122063 0.0043599 0.0050296 0.0056235 0.0066949 0.5153053
26.1 63.92 38.06 41.55 35.37 -26.86
0.000 0.000 0.000 0.000 0.000 0.000
0.2946659 0.2701417 0.1815584 0.2226246 0.2236822 -14.84873
0.342516 0.287233 0.201275 0.24467 0.249927 -12.8287
Page | 8 Research Publish Journals
International Journal of Mathematics and Physical Sciences Research ISSN 2348-5736 (Online) Vol. 4, Issue 1, pp: (1-14), Month: April 2016 - September 2016, Available at: www.researchpublish.com
Table 6: Coefficients for quantile regression model for performance in 2014
Performance
Coef.
Std. Err.
t
P>t
[95% Conf.Interval]
Option
0.0199507
0.0061567
3.24
0.001
0.0078832
0.032018
Major technical courses
0.1581472
0.0030692
51.53
0.000
0.1521313
0.164163
Language
0.1843354
0.0048363
38.11
0.000
0.1748558
0.193815
Mathematics
0.1332119
0.0031845
41.83
0.000
0.12697
0.139454
Practices
0.0524135
0.0053582
9.78
0.000
0.041911
0.062916
_cons
-9.043629
0.5055605
-17.89
0.000
-10.03457
-8.05269
Option
0.0602142
0.0074582
8.07
0.000
0.0455954
0.074833
Major technical courses
0.1846391
0.0032509
56.8
0.000
0.1782671
0.191011
Language
0.1837471
0.0024248
75.78
0.000
0.1789942
0.1885
Mathematics
0.1421237
0.0026636
53.36
0.000
0.1369028
0.147345
Practices
0.0648927
0.0036818
13.29
0.000
0.055319
0.074467
_cons
-9.449224
0.3850155
-24.54
0.000
-10.20388
-8.69456
Option
0.1326493
0.0111466
11.9
0.000
0.1108011
0.154498
Major technical courses
0.2036608
0.0021983
92.65
0.000
0.199352
0.20797
Language
0.1833922
0.0022108
82.95
0.000
0.1790588
0.187726
Mathematics
0.1464316
0.0025477
57.48
0.000
0.141438
0.151425
Practices
0.0904645
0.0057529
15.72
0.000
0.0791883
0.101741
_cons
-10.09226
0.4546169
-22.2
0.000
-10.98335
-9.20118
Option
0.177331
0.0094713
18.72
0.000
0.1587665
0.195895
Major technical courses
0.2147156
0.0023766
90.34
0.000
0.2100572
0.219374
Language
0.1758496
0.0018808
93.5
0.000
0.1721631
0.179536
Mathematics
0.146898
0.0026854
54.7
0.000
0.1416345
0.152162
Practices
0.1324806
0.0049829
26.59
0.000
0.1227138
0.142248
_cons
-11.23974
0.4067193
-27.64
0.000
-12.03694
-10.4425
Option
0.2156958
0.0183219
11.77
0.000
0.1797834
0.251608
Major technical courses
0.2169203
0.0031085
69.78
0.000
0.2108273
0.223013
Language
0.1793492
0.0054715
32.78
0.000
0.1686247
0.190074
Mathematics
0.1440419
0.0033224
43.35
0.000
0.1375297
0.150554
Practices
0.1899956
0.0053046
35.82
0.000
0.1795983
0.200393
_cons
-12.29942
0.4432366
-27.75
0.000
-13.16819
-11.4306
q10
q25
q50
q75
q95
Page | 9 Research Publish Journals
International Journal of Mathematics and Physical Sciences Research ISSN 2348-5736 (Online) Vol. 4, Issue 1, pp: (1-14), Month: April 2016 - September 2016, Available at: www.researchpublish.com To test the coefficients from tables 5and 6, the study is using test statistics suggested by Koenker and Machado (1999), and Yu, Lu and Stander (2003). The null hypothesis is
H 0 : j 0 where
j
,
are coefficients of covariates: option, major technical course, language, mathematics and practices at quantiles
. This model is addressing the alternative hypothesis that the coefficient j in the fitted quantile regression models from the performance data of 2013 and 2014 is statistically significant at all quantiles (q10, q25, q50, q75 and q95). 3.5.3 Goodness of fit for quantile regression model: As the R2 is used to calculate the goodness of fit for OLS model, the quantile regression model uses the pseudo R 2 and it is estimated across the quantiles. Table 7: R squared estimates for multiple quantile regression analysis of performance data
Quantile
Pseudo R squared in 2013
Pseudo R squared in 2014
0.1
0.4856
0.5551
0.25
0.5184
0.5223
0.5
0.5599
0.5873
0.75
0.5943
0.6073
0.95
0.612
0.6025
The analysis shows that the Pseudo-R2 varies quantile by quantile; it is general small to the lower tails of distribution than the higher quantiles of distribution. The Pseudo-R2 of the current case means that these five predictors (Option, Major Technical course, language, math and practice) account for between 48.6% and 61.2% in 2013 and between 55.5% and 60.2% in 2014 of the variance at different levels of performance. Therefore, the evaluation of the model implies that it is not weak at all quantiles. 3.5.4 Plot the quantile regression: Most of the models on the performance of students used conventional OLS approach. However, based on the findings of Yen, Wang and Suen (2009) the OLS methods result the model with estimates at conditional mean and these estimates would be unbiased if and only if the distribution is not tailed or when the distribution of data has no outliers. Each panel in fig. 2 and fig.3 plots one coordinate of the parameter vector
as a function of
, 0,1,
in the plot the study
did not take all values between 0 and 1, the study takes the values from 0.05 to 0.95, and it examines the behavior of estimates on different quantiles in that interval. For each covariate, those point estimates are interpreted as the effect of one unit change of the covariate on the performance of a student holding other covariates fixed. The plot has two scales: the horizontal scale indicates the axis of quantile and the vertical scale indicate the effect of the covariate on the performance of the students. The red solid line in each box in the figure shows the OLS estimates of the conditional mean effect. The two dotted red lines represent 95 percent confidence interval for the OLS estimates. The figures show that the confidence interval for OLS estimate in each covariate does not change for all quantiles, and this means that the effect of the covariates’ coefficients are constant across the conditional distribution of the independent variables. However the effect of the covariates ’coefficients for quantile regression model is not constant across the conditional distribution.
Page | 10 Research Publish Journals
International Journal of Mathematics and Physical Sciences Research ISSN 2348-5736 (Online) Vol. 4, Issue 1, pp: (1-14), Month: April 2016 - September 2016, Available at: www.researchpublish.com
Figure 2: Graphical representation of the quantile regression estimates for the performance in 2013
Page | 11 Research Publish Journals
International Journal of Mathematics and Physical Sciences Research ISSN 2348-5736 (Online) Vol. 4, Issue 1, pp: (1-14), Month: April 2016 - September 2016, Available at: www.researchpublish.com (Intercept)
Option 0.20
-9
0.10
-11 -13
0.00 0.4
0.6
0.8
0.2
0.2
Quantiles Major Technical Courses
0.4
0.6
0.8
Quantiles Language
0.22 0.185 0.18 0.175 0.14 0.2
0.4 0.6 Quantiles
0.8
0.4 0.2
Math
0.6
0.8
Quantiles Practices
0.20 0.15
0.14
0.10 0.12
0.05 0.2
0.4
0.6
0.8
0.2
Quantiles
0.4
0.6
0.8
Quantiles
Figure 3: Graphical representation of the quantile regression estimates for the performance in 2014
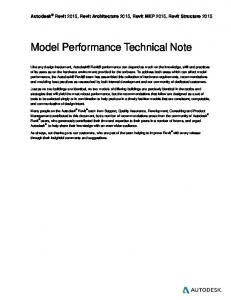
Fig. 2 and fig. 3 show that the effect of option; and knowledge of language, major technical courses, math and practice is significantly positive in two sequential years 2013 and 2014.The effect of the option that a student pursued on his performance is almost the same for lower tails of distribution as higher quantiles of distributions. The effect of major technical courses on the performance is small at lower quantiles than higher tails of distribution in 2014, but the effect is almost the same for all quantiles in 2013. The effect of Language in 2013 increases gradually as the levels of quantile increases, this means that that effect is weak at lower tails of distribution than the higher quantile of distributions. The data of 2014 indicates that the language has a very large positive effect on the performance of a student compared the effect of the language on performance of student in 2013; this is shown by the large confidence interval, where very large positive effect is observable at lower tails and at the higher quantiles of distribution. The effect of math on the performance is larger in 2013 especially at lower tails of distribution and upper quantiles of distribution. In the data of 2014, the effect of math on the performance of the student is also large but it is small at lower quantiles of distribution and increases as the level of quantiles increases. The effect of practical skills is small at lower quantiles of distribution and great at upper quantiles in 2013, while the effect is almost the same for all quantiles of distribution in 2014. 3.6 Non parametric quantile regression Approach: The current study predict the performance of students completing Technical Secondary Education using the nonparametric quantile regression smoothing spline model suggested by Koenker (2011) and MCMillen ( 2013) to improve the flexibility of the model and to have more accurate prediction. This is the additive model for non-parametric quantile regression using total variation penalty method. The solid curves are conditional quantile functions (Smooth function with smoothing parameter 2 , and increasing function without smoothing parameter).
Page | 12 Research Publish Journals
International Journal of Mathematics and Physical Sciences Research ISSN 2348-5736 (Online) Vol. 4, Issue 1, pp: (1-14), Month: April 2016 - September 2016, Available at: www.researchpublish.com
Figure 4: Predicted median Responses at mean value of Z for performance data in 2013 and 2014
Fig. 4 illustrates the relationship between the covariates (option, major technical course, language, math and practice) and the performance in two consecutive years 2013 and 2014; the curve is an estimate of 0.50 conditional quantile functions subject to the total variation of the function gradient. Z is defined as probability density function of normal distribution. The curves show that the relationship between covariates and the performance is positive; this is confirming the results obtained using parametric quantile regression. However, in the 2013 the increasing curve and smoothing curve are almost the same but in 2014 those two curves are different.
IV. CONCLUSION AND RECOMMENDATIONS The current study is aimed at applying the quantile regression model in the performance of the students who completed the Technical Secondary Education in Rwanda for two consecutive school years of 2013 and 2014. The study concludes that the quantile approach is applicable for the performance data in 2013 and 2014 and it is more suitable than OLS approach as the data represent some outliers and the covariates are not normally distributed for allowing the model to assume the normal distribution. The study also revealed that there is a positive effect of all covariates (Option, major technical course, language, math and practice) on the performance of students. However, language and math showed larger positive effect on the performance of students than other covariates. The study also used the nonparametric method in order to have more accurate prediction and to improve the flexibility of the model which was previously estimated with parametric methods; and this method confirmed the findings from parametric estimates. Based on the finding from this study, the recommendations are formulated in order to contribute to the improvement of models created by studies in various areas in general and the performance of students in particular. The quantile regression approach must be used in different areas of research in Rwanda in order to minimize errors and increase the robustness. The students studying technical options and preparing the national exams must focus on all subjects especially major technical courses, language, math and practice but more emphasis must be put in increasing their mathematical and language skills as they contribute a lot on their performance. This study has only used some academic factors that contribute on the performance of student using quantile regression approach; a further study must be carried out to investigate the effect of nonacademic factors like gender of student, his location and his background using the similar approach. REFERENCES [1] X. Zhijie, Quantile Regression with Integrated time Series, Boston: Boston College, 2005. [2] Marcus, A., Harding, M.,Lamarche,C, "Quantile Regression for Time-Series-Cross-Section data," International Journal of Statistics and management System,Vol. 6, No.1-2, pp. 47-72, 2011. [3] Yeh,C.,Wang,K. and Suen,Y, "Quantile analyzinf the dynamic linkage between inflation incertainity and inlation persistence," Problems and perspectives in management, Vol. 7, pp. 21-34, 2009. [4] Keming, Y., Zudi,L. and Stander,J., "Quantile regression: applications and current research areas," The Statistician, vol. 52, part 3, pp. 331-350, 2003.
Page | 13 Research Publish Journals
International Journal of Mathematics and Physical Sciences Research ISSN 2348-5736 (Online) Vol. 4, Issue 1, pp: (1-14), Month: April 2016 - September 2016, Available at: www.researchpublish.com [5] Isabel,M., Javier,R.,Vincente,L., Altea,A. and Carmen C., "Flexible quantile regression models: application to the study of the purple sea urchin," sort Vol. 37, No. 1, pp. 81-94, 2013. [6] Genton,M.,G.,Ghouch,A., "Local Polynomial Quantile Regression with Parametric Features," Journal of American Statistical Association, Vol. 104, No.488, pp. 1416-1429, 2009. [7] Shan,K. and Young,Y., "Combining Regression quantile Estimators," Statistica Sinica, Vol. 19, pp. 1171-1191, 2009. [8] Z. Xiao, "Quantile Cointegrating Regression," Journal of Econometrics, Vol. 150, pp. 248-260, 2009. [9] Zongwu,C. and Zhijie,X., Semiparametric Quantile Regression Estimation in Dynamic Models with Partially varying Coefficients, Boston: Boston College, 2009. [10] M. Kim, "Quantile Regression with varying Coefficients," The Anals of Statistics, Vol. 35, pp. 92-108, 2007. [11] Koenker, R., Xiao,Z., "Quantile autoregression," Journal of the American Statistical Association, Vol. 101, pp. 980990, 2006. [12] Fan, J. and Fan,Y., "Comment on "Quantile autoregression"," Journal of the American Statistical Association, Vol. 101, pp. 991-994, 2006. [13] Cody,S., Clark, M.S., Andrea, M.and Lawrence, J., "Comparing Least-squares and Quantile Regression Approaches to Analyzing median Hospital Charges," Academic Emergency medecine, Vol. 19, Issue 7, pp. 866-875, 2012. [14] D. McMillen, Quantile regression for Special data, Illinois, 2013. [15] T. Grazyna, "Some tests for quantile regression models," Acta Universtatis Lodziensis Folia Oeconomica No.255, pp. 125-135, 2011. [16] Escanciano, J.C. and Goh, S.C, "Specification analysis of linear quantiles models," Journal of Econometrics, No.178, pp. 495-507, 2014. [17] Bassett,G., and Koenker,R., "March madness, quantile regression Bracketology and Hajek Hypothesis," Journal of Business and Economic Statistics, 2009. [18] Koenker,R. and Hallock,K., "Quantile Regression," Journal of Economic perspectives, No. 15, pp. 143-156, 2001. [19] X. Ming, "Moving beyond the Linear Regression Model: Advantages of the Quantile Regression Model," Journal of management, Vol. 39. No.1, pp. 5-13, 2013. [20] M. Furno, "Goodness of Fit and Misspecification in Quantile Regressions," Journal of Educational and Behavoral Statistics, Vol.36, N0.1, pp. 105-131, 2011. [21] Koenker, R. &Machado, J. , "Goodness of Fit and related inference processes for quantile regression," Journal of the American Statistical Association, 94, pp. 1296-1310, 1999. [22] G. o. Rwanda, "Education statistical yearbook," Ministry of Education, Kigali, 2014. [23] Lynn,S.,A. & Backmon, I.,R., "Academic Success of Non-Traditional Students: Factors Affecting Performance in An Upper-Division Undergraduate Accounting Course," Journal of College Teaching & Learning, Vol.3, No12, pp. 85-96, 2006. [24] Eikner, A.,E. & Montondon, L., "Evidence on Factors Associated with Success in Intermediate Accounting I," Accounting Educatore'Journal, Vol.8, pp. 1-17, 2001. [25] Winter, J.,C.,F. & Dodou,D., "Predicting Academic Performance in Engineering Using High School Exam Scores," Internation Journal of Engineering Education, Vol.27, No.6, pp. 1343-1351, 2011. [26] Koenker, "Nonparametric Quantile regression," in 5th RMetrics Workshop, Meielisalp, Chicago, 2011. [27] Yu,K., Lu,Z., Stander,J., "Quantile Regression: applications and Current research areas," Journal of the Royal Statistical Society, Series D 52, pp. 331-350, 2003.
Page | 14 Research Publish Journals