Proceedings of the 36th Hawaii International Conference on System Sciences - 2003
Modeling the User Acceptance of E-Mail Geoffrey S. Hubona Department of Computer Information Systems Georgia State University Atlanta, Georgia, U.S.A.
[email protected]
Abstract The Technology Acceptance Model (TAM) predicts whether users will ultimately use software applications based upon causal relationships among belief and attitudinal constructs that influence usage behavior. Electronic mail, or email, is a collaborative technology available to virtually all members of an organization, and typically, there are alternative email applications available for use. This study applies TAM to assess the user acceptance and voluntary usage of a particular email application, cc:mail, in two different organizations. The results largely validate TAM, although the findings suggest that certain external variables, namely length of time since first use, and level of education, directly affect email usage behavior apart from their influence as mediated through the perceived usefulness (PU) and perceived ease of use (PEOU) constructs.
1. Introduction A recurrent theme in information systems research involves predicting the adoption and future usage of newly-introduced information technologies. A number of theoretical approaches have been investigated, including Diffusion of Innovations [35], the Theory of Planned Behavior [33], and Social Cognitive Theory [7] [8]. However, over the past ten years, the Technology Acceptance Model (TAM) [11] [13] has probably been the most widely cited approach. According to [41], as of January, 2000, no less than 424 journal articles had cited the two original TAM articles that were published in MIS Quarterly [11] and Management Science [13]. Indeed, the internet site http://www.guuspijpers.com/TAM.htm lists no fewer than 31 additional journal articles regarding TAM published in 2000-2002. Furthermore, many of these studies specifically applied TAM to predict the
Andrew Burton-Jones Department of Computer Information Systems Georgia State University Atlanta, Georgia, U.S.A.
[email protected]
acceptance and future usage of email-specific applications [1] [10] [11] [12] [20] [27] [28] [29] [38]. In this study, we examine the impact of three individual difference variables on individual usage volume and usage frequency of a collaborative email application, cc:mail, in two organizations. These individual difference variables are length of time since first use, level of education, and employment category. Using structural equation modeling and path analysis, we compute the relative influences on usage of these three individual difference variables as: (1) indirectly mediated through perceived usefulness (PU) and perceived ease of use (PEOU); and, alternatively (2) as impacting usage volume and usage frequency directly.
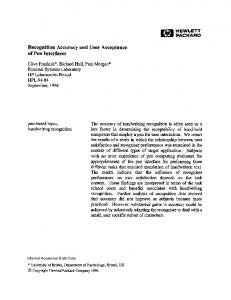
2. Theory and background Fishbein and Ajzen’s [18] [19] Theory of Reasoned Action (TRA) and Davis’ [10] [11] [12] Technology Acceptance Model (TAM) provide a theoretical nexus for measuring beliefs and attitudes to predict future behaviors. Two particular belief constructs, perceived usefulness (PU) and perceived ease of use (PEOU) are centrally important in TAM for predicting information technology users’ acceptance behaviors. Figure 1 illustrates TAM [12]. Based on TRA, TAM assumes that the decision to use a particular information technology is based on one’s cognitive response (PU and PEOU) to using that technology, which in turn affects one’s affective response (attitude) towards that technology. Ultimately, the affective response drives the behavioral response about whether to use the technology. As illustrated in Figure 1, a key assumption of TAM is that external variables influence the decision to use technologies only indirectly through their impact on users’ beliefs (PU and PEOU). This assumption is critical in that it suggests that the amount of information technology usage explained by TAM cannot be improved by accounting for the direct impact of external variables on usage behavior. However, few studies have actually
0-7695-1874-5/03 $17.00 (C) 2003 IEEE
1
Proceedings of the 36th Hawaii International Conference on System Sciences - 2003
tested whether the influence of external variables on usage behavior is fully mediated by PU and PEOU. Researchers have studied users’ perceptions of external variables as impacting TAM, such as perceived support [26] and perceived resources [34]. However, one can argue that perceptions are more akin to cognitive responses (see Figure 1) than to true (exogenous) external variables. Studies have also looked at external variables as impacting TAM that are specific to a particular technology, such as the type of technology [12] [28], or to the nature of the task [15]. However, perhaps a more relevant test of the mediating influence of TAM’s PU and PEOU constructs would be to examine external variables that are independent of the users’ perceptions and of the immediate task.
Figure 2 illustrates the research model. We examine the impact of three individual difference variables on individual usage volume and usage frequency of a collaborative email application, cc:mail, in two organizations. These individual difference variables are length of time since first use, level of education, and employment category. Using structural equation modeling and path analysis, we compute the relative influences on usage of these three individual difference variables as: (1) indirectly mediated through PU and PEOU; and, alternatively (2) as impacting usage volume and usage frequency directly.
Perceived Usefulness External Variables
Attitude
Actual System Use
Affective Response
Behavioral Response
Perceived Ease of Use External Stimulus
Cognitive Response
Figure 1. Technology acceptance model
Individual Difference Variables
Beliefs About Usefulness Usage Volume
Time since First Use Level of Education
Attitude Usage Frequency
Employment Category Beliefs About Ease of Use Figure 2. The research model Very few studies have empirically tested the relative direct and indirect (mediating) influences of users’ individual differences on usage behavior vis a vis TAM. Those that have largely support the notion that PU and
PEOU ‘fully mediate’ the influence of the individual difference variables on usage behavior. For example, Gefen and Straub [20] reported that gender had a significant impact on TAM’s belief constructs but no
0-7695-1874-5/03 $17.00 (C) 2003 IEEE
2
Proceedings of the 36th Hawaii International Conference on System Sciences - 2003
independent direct effect on usage behavior. In addition, Agarwal and Prasad [3] reported that the TAM variables fully mediated the effects of individual difference variables (role with regard to technology, tenure in workforce, level of education, prior similar experience, and participation in training) on users’ intention to use a new information technology. This study is similar in design and intent to that of Agarwal and Prasad [3]. However, we reach very different conclusions.
3. Research method 3.1. Subjects and procedure Data was collected at two sites: a large manufacturing corporation with revenues in excess of $4B annually, and at the headquarters of a large federal government agency. Subjects at the corporate site included 96 staff and professional employees who agreed to participate. Subjects at the government site included 122 staff and professional employees. Questionnaires were circulated that solicited their beliefs and attitudes regarding one of several email packages (Cc:mail) available on the site’s LAN.
3.2. Constructs This study examines relationships among eight measured variables (see Figure 2). There are three individual difference variables, namely users’ length of time since first use, level of education, and employment category. Beliefs about usefulness (PU) and ease of use (PEOU) were measured with two of Davis’ original scales for these constructs. The corporate site utilized Davis’ [11] [12] original instrument (see Appendix) containing ten items for each of the PU and PEOU constructs, and five items for the attitude construct. The government site utilized Davis’ [11] original semantic differential scale instrument (see Appendix) containing six items for each of the PU and PEOU constructs, and five items for the attitude construct. At both sites, attitude was measured with 7-point semantic differential scales as suggested by Ajzen and Fishbein [2] and used by Davis [12]. Two measures of actual system use are separately assessed. Usage volume is measured as how many hours per week the respondent reports using the email application. Usage frequency is measured as how many times per week the respondent reports using the email application. Individual differences have been an important factor in IS research for decades [42]. The significant impact of individual differences have been noted in various IS
research streams, including end-user computing [22] and decision support systems [4]. In a similar TAM study, Davis [12] tested ‘system design features’ as an external variable, which simply distinguished between two software packages, an electronic mail system and a text editor. In this same study, he stated (p. 483): “Other [external] variables that could be examined include system familiarity or experience . . .” In this study, we use length of time since first user as a system familiarity/experience surrogate. Levin and Gordon [30] found that subjects who owned computers were more motivated to become familiar with computers, and had more favorable attitudes towards computers, than did subjects who did not own computers. Dambrot, Silling and Zook [9] showed that subjects who failed an assembly language programming course had significantly less computer experience than those who did not fail the course. In a text editing study, Rosson [37] showed that experience was positively correlated with the number of lines edited per minute. Elkerton and Williges [17] found that experience explained more variance in information search times than did other individual variables. Experience has been demonstrated to have a large effect on performance with a specific system [16] [39]. Zmud [42] documented that level of education influences the successful use of computer applications. Davis and Davis [14] noted that more educated end users significantly outperformed less educated end users in a training environment. Several studies have reported that higher levels of education are negatively related to computer anxiety, and positively related to favorable computer attitudes [24] [25] [36]. Lucas [31] reported that less educated individuals have more negative attitudes towards information systems than do individuals with more education. Harrison and Rainer [22] maintained that education is effective in overcoming negative attitudes towards computers.
3.3. Construct measurement and validation Partial Least Squares (PLS), a Structural Equation Modeling (SEM) tool, was used to perform the analyses (specifically, PLS-GRAPH version 3.00 build 279). SEM enables researchers to simultaneously examine the structural component (path model) and measurement component (factor model) in one model [21]. The use of PLS has advantages over other SEM tools, such as LISREL, in that PLS can be applied to explore the underlying theoretical model [21]. Further, PLS can be used with smaller sample sizes than LISREL because it
0-7695-1874-5/03 $17.00 (C) 2003 IEEE
3
Proceedings of the 36th Hawaii International Conference on System Sciences - 2003
does not require restrictive distributional assumptions about the underlying data [8]. The survey questionnaires were designed to measure three distinct latent constructs: PU, PEOU, and attitude towards using. Factor analyses were used to separately validate the measurement of these constructs at the two sites. Factors were extracted using covariance matrices and the method of principal components. Oblique rotations were used to help interpret initial factor patterns. The factor loadings (see Tables 1 and 2) provide evidence for the factorial validity of the three scales at each site. In addition, for the corporate site instrument, cronbach’s alpha is 0.96 for PU, 0.94 for PEOU, and 0.94 for attitude. For the government site instrument, cronbach’s alpha is 0.96 for PU, 0.96 for PEOU, and 0.97 for attitude, reflecting high levels of construct validity for both instruments. Table 1. Factor loadings of corporate site questionnaire items Item Number Q1 Q2 Q3 Q4 Q5 Q6 Q7 Q8 Q9 Q10 Q11 Q12 Q13 Q14 Q15 Q16 Q17 Q18 Q19 Q20 Q21 Q22 Q23 Q24 Q25
Perceived Usefulness 0.91 0.86 0.66 0.82 0.72 0.95 0.94 0.80 0.75 0.55 - 0.21 0.11 0.03 0.06 - 0.10 0.08 - 0.08 0.13 - 0.04 0.06 0.15 0.04 0.01 0.18 0.05
Perceived Attitude Ease of Use Toward Using 0.00 - 0.14 - 0.09 0.02 0.09 0.30 0.03 - 0.04 0.01 0.27 0.00 - 0.01 0.01 - 0.03 0.03 0.12 - 0.01 0.18 0.05 0.43 0.74 0.36 0.81 - 0.23 0.77 0.02 0.77 0.09 0.77 0.18 0.80 - 0.10 0.82 - 0.03 0.85 - 0.16 0.83 - 0.07 0.69 0.26 0.04 0.72 - 0.20 0.93 0.04 0.87 0.01 0.77 0.05 0.88
captured employment category and level of education as external variables. The survey at the government site captured length of time since first use and level of education as external variables. Two questions were appended to the belief/attitude questionnaire to solicit responses about levels of usage frequency and usage volume for that application. Length of time since first use was measured as subjects’ self-report of the “length of elapsed time (in weeks) since they first used the cc:mail application.” Levels of education were recorded as: (1) high school graduate; (2) some college; (3) twoyear associate’s degree; (4) bachelor’s degree; (5) some graduate school; (6) master’s degree; and (7) doctoral degree. Subjects indicated their employment categories from among four choices: (1) staff support; (2) technical professional; (3) managerial professional; and (4) executive. Usage frequency was recorded as: (1) don’t use at all; (2) use less than once a week; (3) use about once each week; (4) use several times each week; (5) use about once each day; and (6) use several times each day. Usage volume was measured by the response to the following question: “Please specify (estimate) how many hours each week you normally spend using cc:mail: _____ hours.” Both of these usage metrics are similar to those used by Davis [12]. Table 2. Factor loadings of government site questionnaire items Item Number Q1 Q2 Q3 Q4 Q5 Q6 Q7 Q8 Q9 Q10 Q11 Q12 Q13 Q14 Q15 Q16 Q17
Perceived Usefulness 0.82 0.98 0.84 0.97 0.77 0.63 - 0.08 0.02 0.04 - 0.01 0.09 0.04 0.15 0.08 0.03 0.16 0.05
Perceived Attitude Ease of Use Toward Using 0.04 0.07 0.07 - 0.10 0.02 0.14 - 0.11 0.01 0.06 0.16 0.04 0.32 0.95 0.03 0.93 - 0.01 0.90 0.04 0.85 0.07 0.85 - 0.05 0.84 0.12 0.12 0.75 0.07 0.85 0.07 0.88 - 0.03 0.83 0.04 0.88
A pre-questionnaire solicited respondents’ length of time since first use, levels of education, and employment categories. The survey at the corporate site
0-7695-1874-5/03 $17.00 (C) 2003 IEEE
4
Proceedings of the 36th Hawaii International Conference on System Sciences - 2003
4. Results Figures 3 and 4 show the indirect and direct effects, respectively, of employment category and level of education on PEOU, PU, attitude, usage volume, and usage frequency for the email system at the corporate site. Figures 5 and 6 show the indirect and direct effects, respectively, of length of time since first use and level of education on the belief, attitude and usage
Employment Category
0.14
Beliefs About Usefulness r2 = 0.28
metrics for the email application at the government organization. These Figures indicate significant (at p < 0.05) and non-significant path coefficients, as well as the amounts of variance explained in the predicted constructs (PEOU, PU, attitude, usage volume, and usage frequency). The significance of the paths were estimated using a PLS bootstrapping procedure [34] utilizing 200 resamples, an amount that provides reasonable standard error estimates [6].
0.64
0.19 0.13
Level of Education
Usage Volume r2 = 0.21
0.62
Usage Frequency r2 = 0.39
Attitude r2 = 0.54
0.39
Beliefs About Ease of Use r2 = 0.05
0.45
0.17
0.13 Significant path (p < 0.05) Non-significant path Figure 3. Testing indirect (mediating) effects at corporate organization
Employment Category
0.14
Beliefs About Usefulness r2 = 0.28
-0.01 0.61
0.19
0.16 Attitude r2 = 0.56
0.39 0.13
Level of Education
0.13
Beliefs About Ease of Use r2 = 0.05
Usage Volume r2 = 0.23
0.07
0.16
0.17 0.33
-0.03
Usage Frequency r2 = 0.49 0.07 0.30
Significant path (p < 0.05) Non-significant path Figure 4. Testing direct effects at corporate organization
0-7695-1874-5/03 $17.00 (C) 2003 IEEE
5
Proceedings of the 36th Hawaii International Conference on System Sciences - 2003
0.19
Time since First Use
Beliefs About Usefulness r2 = 0.34
0.59
0.13 0.16
Level of Education
Usage Volume r2 = 0.03
0.42
Usage Frequency r2 = 0.18
Attitude r2 = 0.69
0.47
Beliefs About Ease of Use r2 = 0.06
0.17
0.35
0.15
Significant path (p < 0.05) Non-significant path
Figure 5. Testing indirect (mediating) effects at government organization
Time since First Use
0.19
Beliefs About Usefulness r2 = 0.34
0.12 0.55
0.13
0.02 Attitude r2 = 0.70
0.64 0.16
Level of Education
0.15
Beliefs About Ease of Use r2 = 0.06
Usage Volume r2 = 0.17
0.07
0.38
Usage Frequency r2 = 0.24
0.33 0.04
0.20 0.03
-0.06
Significant path (p < 0.05) Non-significant path Figure 6. Testing direct effects at government organization At the corporate site, the indirect mediating model (Figure 3) indicates a significant influence of level of education on PU. The remaining TAM model paths are all significant (with the exception of the path from PEOU to attitude). The model explains 21% of the variance in usage volume and 39% of the variance in usage frequency. However, when the direct influences
of the individual difference variables are considered (Figure 4), there is a significant direct effect of employment category on attitude, as well as a significant direct effect of level of education on usage frequency. PU and PEOU do not fully mediate the impact of the individual difference variables on attitude, nor on usage behavior. Further, the influence of attitude
0-7695-1874-5/03 $17.00 (C) 2003 IEEE
6
Proceedings of the 36th Hawaii International Conference on System Sciences - 2003
on usage volume is no longer significant as in Figure 3. Perhaps more importantly, the amount of the variance explained in usage volume increases from 21% to 23%, and the amount of variance explained in usage frequency increases from 39% to 49%, when the direct influences of the individual difference variables are considered. At the government site, the indirect mediating model (Figure 5) again indicates a significant influence of level of education on PU. There are also significant effects of length of time since first use on PEOU and PU. The remaining TAM model paths are all significant. This model explains only 3% of the variance in usage volume and 18% of the variance in usage frequency. However, when the direct influences of the individual difference variables are again considered (Figure 6), there are significant direct effects of length of time since first use on usage volume and on usage frequency. As is the case at the corporate site, PU and PEOU again do not fully mediate the impact of the individual difference variables on usage behavior. Further, the influence of attitude on usage volume again becomes insignificant. Moreover, the amount of the variance explained in usage volume increases from 3% to 17%, and the amount of variance explained in usage frequency increases from 18% to 24%, when the direct influences of the individual difference variables are considered.
5. Discussion Mathieson, Peacock and Chin [34] describe a “pseudo F-test” technique to measure whether the substantive change in the explained variance (R2) of usage is statistically significant after the direct influences of the external variables are taken into account. The effect size (f 2) can be estimated as ((R2full – R2excluded) ÷ (1 – R2full)), where R2full is the explained variance including the direct influences of the external variables, and R2excluded is the explained variance in usage without these direct influences. Multiplying f 2 by (n – k – 1), where n is the sample size, and k is the number of independent constructs, provides a pseudo F test for determining whether the f 2 statistic is significant with 1 and n – k degrees of freedom. Using this approach, the f2 for the increased variance explained in usage volume and usage frequency of the email application at the corporate site is significant at p < 0.15 and p < 0.001, respectively, after the direct effects of the external variables are considered. Furthermore, the increased variance explained in usage volume and usage frequency of the email application at the government site is significant at p < 0.001 and p