for advertisers compared to other marketing methods. In addition the ... The organic search results are links relevant to the query and are ranked in order of their rele- vance. ... When a user enters a query, the search engine identifies the ad-.
Modeling User Click Behavior in Sponsored Search Vibhanshu Abhishek, Peter S. Fader, Kartik Hosanagar The Wharton School, University of Pennsylvania, Philadelpha, PA 19104, USA {vabhi, faderp, kartikh}@wharton.upenn.edu Abstract There has been significant recent interest in studying consumer behavior in sponsored search environments. Researchers have typically used aggregate data provided to advertisers by search engines to model consumer behavior. The data typically catalogue advertiser’s bid, average position and total impressions, clicks and cost on a daily basis for keywords in the advertisers sponsored search campaign. Random utility models have been proposed and their parameters estimated using logistic regression. We show that estimating these models on aggregated data can lead to biased estimates, specifically the impact of ad position on consumer click propensity is often underestimated. L’étude du comportement des consommateurs dans des environnements de recherche sponsorisée a été objet d’un grand intérêt récent. Les investigateurs ont généralement utilisé des données agrégées fournies aux annonceurs par les moteurs de recherche dans la construction des modèles de comportement des consommateurs. Les modèles d’utilité aléatoire ont été proposées et leurs paramètres estimés à l’aide de la régression logistique. Nous montrons que l’estimation de ces modèles sur des données agrégées peut conduire à des estimations biaisées, et plus précisément l’impact de la position des annonces sur la propension des consommateurs à cliquer l’annonce est souvent sous-estimé.
1 Introduction Sponsored search is the fastest growing form of advertising on the Internet. A number of factors have contributed to this growth. The ads tend to be highly targeted and offer a higher return on investment for advertisers compared to other marketing methods. In addition the large audience it offers has led to a wide-spread adoption of search engine advertising. When a user issues a query on the search engine, sponsored results are displayed alongside organic search results. The organic search results are links relevant to the query and are ranked in order of their relevance. The sponsored results are ads submitted by advertisers. The advertisers submit bids for keywords that are relevant to them, along with these ads. When a user enters a query, the search engine identifies the advertisers bidding on keywords closely related to the query and uses data on bids and ad quality/performance to rank order the ads that appear in the list of sponsored results. The most widely used pricing model is the pay per click model, in which the advertiser pays only when a user clicks on his ad. The advertiser’s cost per click or cpc is determined using a generalized second price auction [7], i.e. whenever a user clicks on an ad in position, the advertiser pays an amount equal to the minimum bid needed to secure that position. One of the attractive features of sponsored search is that it is a highly measurable form of advertising. Data on consumer click and purchase patterns have been used to study consumer behavior and advertiser strategies. Several researchers have built random utility models to study the effect of ad position, keyword length, presence or absence of brand name, etc. on the clickthrough rate (ctr) of the ad. The parameters of these models have been estimated from aggregated data that catalogue advertiser’s bid, average position and 1
total impressions, clicks and cost on a daily basis for keywords in the advertisers sponsored search campaign. In this paper we show that applying standard models (e.g., logistic regression) on such aggregated datasets can lead to biased estimation of the parameters of a random utility model. Using a simple model we show that the effect of position on ctr is underestimated when the coefficients are estimated using the summarized data.
2 Related work There has been a lot of recent interest in trying to understand the factors driving keyword performance in sponsored search [3, 8, 1]. These studies typically propose individual keyword-level models. However, clicks and conversions are often very sparse in most sponsored search data, making it hard to estimate individual-level models. Rutz and Bucklin [8] propose a hierarchical bayesian model to study the conversion performance of individual keywords. They show that the model adequately addresses the sparse data problem while accounting for keyword heterogeneity. In another related paper Rutz and Bucklin [9] study the performance of branded versus generic keywords and identify spill over effects of generic keywords using the Nerlove-Arrow goodwill model. Ghose and Yang [4] use hierarchical bayesian models to quantify the impact of ad position, keyword length and type and the quality of the landing page on consumer conversion behavior and the advertiser’s cpc. Ghose and Yang also show that the advertisers are not bidding optimally to maximize their profits. Recent work by Agarwal et. al [1] shows that although the ctr decreases with position, the conversion rate often increases and then decreases. They show that the topmost position is not necessarily the revenue maximizing position. The rank of an ad varies across impressions during a day, but since these use aggregate data, their models assume the mean rank during the day is the actual rank. This aggregation of data can lead to potential biases in the estimation of parameters and ultimately affect the conclusions from these studies. The problem of aggregation bias is not new and has been addressed earlier in some detail. Kelejian [6] discusses why, under certain conditions, aggregation bias might occur and proposed a test for the existence of this bias. Logistic regression have been extensively used in Marketing where hedonistic utility models have been estimated using aggregate scanner data. Allenby and Rossi [2] present an analytical proof for the non existence of aggregation bias in nested logit models when the micro level consumer behavior is assumed to be linear in nature and the products are close substitutes of each other. This paper presents a conclusive proof for the existence of the bias in the setting of sponsored search. In addition it clearly outlines the direction of the aggregation bias, which we believe has been shown for the first time.
3 Bias due to Aggregate Data In this section we explore the estimation bias introduced due to the aggregation of data. First, we analytically show that the logistic regression gives biased estimates on aggregated data. Then we try to derive insights about the direction of the bias. Finally, we present a simulation study to illustrate the results and identify the conditions under which the bias is negligible versus significant. 3.1
Analytical Proof of the Bias
Logit utility model The logit utility model has been extensively used in marketing and economics to model consumer choice behavior. Suppose the consumer utilility is modeled as follows: u(pos) = β0 + β1 pos + ε.
(1)
If ε has a logistic distribution the probability of clicking on an ad at position pos is given by where Λ(β0 + β1 pos) =
p(y = 1|pos; β0 , β1 ) = Λ(β0 + β1 pos), β +β pos 0 1 e /[1 + eβ0 +β1 pos ]. In this simple model we
(2) ignore other ad characteristics
to focus our attention on the impact of ad position on click through rate. The simple model allows us to clearly identify the existence and direction of the bias. The log likelihood of observing a data-set with a total of I ad impressions is given by I X LL(β|data) = yi log Λ(x0i β) + (1 − yi ) log(1 − Λ(x0i β)), (3) i=1
)0 ,
where xi = (1 posi posi is the position of the ad on the ith impression and yi is equal to 1 if the ith impression resulted in a click and zero otherwise. The maximum likelihood estimate βˆcomplete for the complete data can be computed by X yi log Λ(x0i β) + (1 − yi ) log(1 − Λ(x0i β)). (4) βˆcomplete = arg max β
t
We can show that βˆcomplete satisfies I
obsctr =
C 1X Λ(x0i βˆcomplete ), = I I
where C =
i=1
I X
yi ,
(5)
i=1
where x0i is the transpose of the column vector xi Proposition 3.1 βˆcomplete is a consistent estimator of β. Proof Since {yi , xi } constitute an ergodic stationary sequence and conditions of identification and dominance are satisfied, the logit model gives consistent estimates on the complete data (Hayashi [5] Proposition 7.6) In case of summary data over D days the LL of observing a given aggregated dataset is ¶ µ X nd + cd log Λ(x0d β) + (nd − cd ) log(1 − Λ(x0d β)), log LL(β|data) = cd
(6)
d
where xd = (1 posd )T , posd is the average position on the dth day, nd is the total number of impressions and cd is the total number of clicks on day d .The estimate for summary data βˆsummary is computed by ¶ µ D X nd ˆ + cd log Λ(x0d β) + (nd − cd ) log(1 − Λ(x0d β)), βsummary = arg max log (7) cd β d=1
D
which satisfies
obsctr =
X nd C = Λ(x0d βˆsummary ). I I
(8)
d=1
For the sake of discussion we introduce the following notation. Let Vi 1 be a random variable denoting the position in the ith impression. We assume that Vi is independently and identically distributed and has a distribution given by FV () which is assumed to be constant during the period of observation. The average position for the day given that there were n queries in the day is V1 + V2 + . . . + Vn Un = (9) n The distribution of Un is FUn () which is given by n and the distribution of V . An important relationship between Un and V is as follows. Lemma 3.2 Un is less than V in convex order. Un ≤cx V 1
posi is the realization of Vi .
(10)
X is less than Y in convex order if E[f (X)] ≤ E[f (Y )] for all real convex functions f such that the expectation exists. The proof of this lemma has been omitted due to space constraints. Now we present an important result of this paper. Proposition 3.3 βˆsummary is a biased estimator of β. Proof We first prove this general result using a special case when nd = n for all d = 1, . . . , D. Substituting Un in place of posd , Equation (8) can be simplified as D ˆ ˆ 1 X eβ0,summary +β1,summary Un . Λ(x0d βˆsummary ) = βˆ0,summary +βˆ1,summary Un I D d=1 d=1 1 + e Assuming D is large we can apply Chebyshev’s law of large numbers to get Z ∞ ˆ ˆ eβ0,summary +β1,summary u obsctr = dFUn (u). (11) ˆ ˆ 1 + eβ0,summary +β1,summary u 0 Similarly V is substituted in Equation (5) and assuming that I is large we can rewrite the summation as the following integral Z ∞ ˆ ˆ eβ0,complete +β1,complete v obsctr = dFV (x). (12) ˆ ˆ 0 1 + eβ0,complete +β1,complete v Since the observed ctr is same in both the cases Z ∞ Z ∞ ˆ ˆ ˆ ˆ eβ0,summary +β1,summary u eβ0,complete +β1,complete v dFUn (u) = dFV (x). (13) ˆ ˆ ˆ ˆ 1 + eβ0,summary +β1,summary u 0 0 1 + eβ0,complete +β1,complete v Since Equation (13) always holds we will now show that βˆcomplete 6= βˆsummary and hence βˆsummary is biased. Since the convex ordering in lemma 3.2 holds and logit is a convex function for the set of parameters considered2 it follows from the definition of convex ordering that Z ∞ Z ∞ ˆ ˆ ˆ ˆ eβ0,complete +β1,complete v eβ0,summary +β1,summary u dF (u) ≤ dFV (x), (14) Un ˆ ˆ ˆ ˆ 1 + eβ0,summary +β1,summary u 0 0 1 + eβ0,complete +β1,complete v if βˆcomplete = βˆsummary . Since Equation (13) and Equation (14) cannot hold simultaneously and Equation (13) always holds we prove by contradiction that βˆcomplete 6= βˆsummary
obsctr =
D X n
Now we relax the assumption that nd = n for all d = 1, . . . , D. Let U = UN represent the average position when N , the number of queries in a day, is random. It can be shown that U ≤cx V which gives us Z ∞ Z ∞ ˆ ˆ ˆ ˆ eβ0,summary +β1,summary u eβ0,complete +β1,complete v dFU (u) ≤ dFV (x). (15) ˆ ˆ ˆ ˆ 1 + eβ0,summary +β1,summary u 0 0 1 + eβ0,complete +β1,complete v if βˆcomplete = βˆsummary . As shown earlier this cannot happen hence βˆcomplete 6= βˆsummary Proposition 3.4 The direction of aggregation bias is such that Λ(βˆsummary , x) is greater than Λ(βˆcomplete , x) ∀ x. Proof Since we know Z that ∞
0
Λ(βˆsummary , x)dFU (x) =
Z 0
∞
Λ(βˆcomplete , x)dFV (x),
and by definition of convex order Z ∞ Z ˆ Λ(βcomplete , x)dFV (x) ≥ 0
2
0
∞
Λ(βˆcomplete , x)dFU (x)
We can show that the logit is convex whenever β0 ≤ 0 which is a reasonable assumption given that the probability of the first ad in the list getting clicked is always seen to be significantly less than 0.5. The result holds even when this condition is relaxed as is shown in the simulation.
⇒ Λ(βˆsummary , x) ≥ Λ(βˆcomplete , x) 3.2
Illustrative Examples
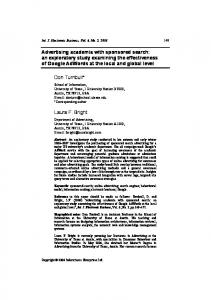
We now turn to simulations to validate the analytical results and identify the cases in which the magnitude of the bias is significant. The inputs to the simulation are the coefficients of the logit model (β0 , β1 ) and the mean arrival rate λ for a Poisson process that determines the number of number of queries in a day. The consumer’s decision to click on the ad conditional on its position is simulated for each query using the random utility model specified earlier 3 . The complete data record the position and the binary click decision for all queries. In addition, the daily total number of impressions, clicks and the mean position for our ad are computed and recorded in the aggregate data. 10 different runs are generated for every set of β0 , β1 and λ. The graph in Figure 1 shows the ctr v/s position for summary and complete data for one particular run 0.4
o +
summary ctr complete ctr
0.2
ctr
+ + + 0.0
+ + + + + + + + + + + + + + + + 0
5
10
15
+ 20
Figure 1: ctr pos v/s position with β0 = 0, β1 = −0.75, λ = 1000. Crosses are the ctr observed at each position in the complete data set and the dotted line is the logit estimated on the complete data. The actual underlying logit function is close to the dotted line and has been omitted for clarity. The dots represent the observed ctr for various daily mean positions during the observation period and the dashed line is the logit function estimated on the summary data. It intuitively follows from Jensen’s inequality that averaged ctr is greater than the actual ctr. Since the regression estimates the parameters on the averaged observations the estimated ctr is greater than the actual logit model. β0,actual 0.25 0.00 -0.25 -0.50 -0.75
β1,actual -1.00 -0.25 -0.75 -0.75 -1.00
β0,complete 0.2596∗∗∗ 0.0086∗∗∗ −0.2531∗∗∗ −0.5098∗∗∗ −0.7383∗∗∗
β1,complete −1.0103∗∗∗ −0.2498∗∗∗ −0.7561∗∗∗ −0.7471∗∗∗ −1.0044∗∗∗
β0,summary -0.0166 0.0076∗ -0.4147 -0.6691 -1.0167
β1,summary -0.7346 −0.2411∗ -0.5946 -0.5882 -0.7259
Table 1: Estimated parameters of logit model on summary data. The reported values are the mean of the estimated coefficients for every set of parameters. actual parameter on a one sample t-test
∗∗∗
implies that the mean lies within the 95% confidence interval about the
We report the results for several βs in Table 1 to illustrate the nature of the bias for different values of β 4 . We observe that as the effect of position on ctr increases the aggregation bias increases. This is due to the increasing convexity of the ctr-position curve. Further, the effect of position is underestimated in all cases. When the decay in ctr with position is not very steep, the aggregation bias is small because ad position 3 4
The decision is a binary variable indication whether the user clicked our ad or not The results are robust to variation in λ.Assuming that λ is sufficiently high, the law of large numbers comes into play.
has little impact on the number of clicks. However as position becomes more important and ctr decreases significantly the bias increases. In additional simulations with other covariates in a richer logit model, we find that this leads to an overestimation of coefficients of regressors that contribute positively to the utility function of the consumer. This implies that some other ad characteristics might have received more credit in prior work than is justified. Simulations show that the results are robust to variations in FV ().
4 Discussion and Conclusion The search engine advertising environment offers rich data on consumer click and conversion behavior. Several recent studies have started analyzing such data to study consumer behavior and inform advertiser strategies. A key contribution of this paper is that it demonstrates that the techniques used in several studies in the literature might not be appropriate given the aggregated nature of the data. We analytically prove the existence of aggregation bias and identify the direction of the bias. We further show that the bias causes the effect of position on ctr to be underestimated. This leads not only to biased estimates for the coefficient of position but also results in flawed estimation of the contribution of various factors on the clickthrough rate. As an extension of this work we are developing a probabilistic model for consumer behavior that accounts for variation in position. Preliminary results show that the parameters of the model can be estimated even from aggregate data.
References [1] A. Agarwal, K. Hosanagar, and M. D. Smith. Location, location, location: An analysis of profitability and position in online advertising markets. SSRN eLibrary, 2008. [2] G. M. Allenby and P. E. Rossi. There is no aggregation bias: Why macro logit models work. Journal of Business and Economic Statistics, pages 1–14, 1991. [3] N. Craswell, O. Zoeter, M. Taylor, and B. Ramsey. An experimental comparison of click position-bias models. In WSDMŠ08, 2008. [4] A. Ghose and S. Yang. An empirical analysis of search engine advertising: Sponsored search and cross-selling in electronic markets. SSRN eLibrary, 2007. [5] F. Hayashi. Econometrics. Princeton University Press, 2000. [6] H. H. Kelejian. Aggregated heterogeneous depentdent data and the logit model: A suggested approach. Economic Letters, pages 243–248, 1995. [7] S. Lahaie and D. M. Pennock. Revenue analysis of a family of ranking rules for keyword. In EC07. [8] O. J. Rutz and R. E. Bucklin. A model of individual keyword performance in paid search advertising. SSRN eLibrary, 2007. [9] O. J. Rutz and R. E. Bucklin. From generic to branded: A model of spillover dynamics in paid search advertising. SSRN eLibrary, 2008.


![iProspect Search Engine User Behavior Study [PDF]](https://m.moam.info/img/260x300/iprospect-search-engine-user-behavior-study-pdf_6479d1eb098a9ee17d8b4694.jpg)


