International Journal of Chemical Sciences Research | Vol 16 Iss 2 DOI: 10.21767/0972-768X.1000266
Modeling Using the Response Surface Methodology the Activation Process of Moroccan Oil Shale for Removal of Cd (II) Nawal Elhammoudi1*, Mina Oumam1, Abdelkrim Abourriche2, Said Mansouri1, Az-iddin Chham1 and Hassan Hannache1,3 Laboratory of Engineering and Materials LIMAT, Faculty of Science Ben M’sik, University Hassan II de Casablanca,
1
Casablanca 20000, Morocco 2
Laboratory of Materials, Processes, Environment and Quality, Cady Ayyed University, National School of Applied
Sciences, Morocco 3
Center of Advanced Materials, (EMINES), University Mohammed VI Polytechnic, Ben Guerir, Morocco
*
Corresponding author: Nawal Elhammoudi, Department of Chemistry, Laboratory of Engineering and Materials LIMAT,
University
Hassan
II
de
Casablanca,
Casablanca
20000,
Morocco,
Tel:+212660365877;
E-mail:
[email protected]
Received: April 09, 2018; Accepted: May 12, 2018; Published: May 15, 2018
Abstract This study for the first time designed to modeling and optimize of activation process for removal of cadmium (II) ions by adsorption on Moroccan oil shale using the response surface methodology. The optimal activation parameters selection was carried out on the basis of three factors by central composite design (CCD). The factors that have been identified are: activation temperature, activation time and massic ratio (mH2SO4/mYC). The capacity of adsorption of the Cd (II), was chosen as a response. The measured parameters were found in accordance with the predicted values with a coefficient of determination (R2) of 0.92. The model has been confirmed by experimental tests to validate the results obtained. Based on the equation of the model and the desirability function, the activation temperature and activation time significantly effect of the adsorption capacity of Cd (II) ions. According to optimal activation conditions obtained using prediction profiler, the powder of oil shale mixed with H2SO4 at 213.8°C during 30 min in a ratio of 1.76, the adsorption capacity of Cd (II) ions is 68.38 (mg/g), the specific BET surface area of activated oil shale equal to 181.35 (m2/g).
Keywords: Modeling; Activation process; Moroccan oil shale; Adsorption; Cd (II); Response surface methodology
Introduction Industrial wastewater containing cadmium is a threat to public health, due to its accumulation in aquatic life. It is a heavy metal of considerable toxicity with a destructive effect on most organ systems, this pollutant originating from the
Citation: Elhammoudi N, Oumam M, Mansouri S, et al. Modeling Using the Response Surface Methodology the Activation Process of Moroccan Oil Shale for Removal of Cd (II). Int J Chem Sci. 2018;16(2):266
© 2018 Trade Science Inc.
1
www.tsijournals.com | May-2018
metallurgical alloying, industrial operations. The principal sources of contamination are welding contaminated food and beverages [1].
Experimental The conventional processes for removing cadmium from aqueous solution include chemical precipitation, ion exchange, membranes and adsorption technologies [2]. Among these different physicochemical processes, adsorption has shown to be the best prospects owing to its economic feasibility [3]. Today the oil shale has received increasing interest in the removal of heavy metals. The oil shale is a sedimentary rock contained the organic and the mineral matter [4]; it is essentially an immature form of petroleum. Morocco has a great resource of the oil shale. The deposits that have been explored are the Timahdit and Tarfaya deposits, the Timahdit deposit is located about 250 kilometers southeast of rabat. The average sulfur content is two percent [5]. The deposits that have been strongly explored are the Timahdit and Tarfaya deposits. The total content from Moroccan oil shale is evaluated 86 billion tons [6]. The objective of the present study is to optimize and modeling of activation conditions of oil shale for removal of cadmium (II) ions using response surface methodology. The response surface methodology is one of statistical method to optimize of the parameters and reducing the number of experimental trials [7]. The initial step in planning the response surface design was to determine the activation parameters that have an influence on the removal of cadmium (II) ions [8]. The second step was the modeling of the response; it consists of selecting the appropriate plan and validating the model. For this reason, we employed a central composite design, to optimize of activation conditions of oil shale for removal of cadmium (II) ions. The final step was the optimization of the conditions for the working of the activation process [9]. The factors studied including, the activation temperature (X 1), activation time (X2) and massic ratio (X3). The response measured, it is the adsorption capacity of Cd (II) ions: Qads(mg/g). The oil shale is composed of the organic and the mineral material essentially formed by calcite, dolomite, silicate and clay. The choice of the Moroccan oil shale for this application was eluted by two factors, the estimated reserve and its composition rich in organic matter constituted a carbon source.
Preparation of the activated oil shale The oil shale (Y) is crushed then ground until we get a fine powder [10]. At a mass of the oil shale was leached with hydrochloric acid, to obtain the concentrated oil shale to be named (YC). The precursor (YC) was mixed with different ratio (mH2SO4/mYC) of the sulfuric acid. The mixture was heated in electric furnace under oxidant atmosphere gaze at different temperatures, after preprocessing at 140°C in oven under air. The product obtained (YCS) is thoroughly washed with distilled water in a soxhlet apparatus, to remove excess sulfuric acid (H 2SO4) and to extract any soluble material, and then to dry at 80°C.
Experimental response The measured response in this study was the adsorption capacity of Cd (II) ions. The removal of cadmium (II) ions on the activated oil shale (YCS) has been realized on the synthetic solution from cadmium chloride CdCl 2. A solution of Cd (II) ions of concentration 20 mg/L was prepared by dissolving 32.62 mg of cadmium chloride CdCl 2 in a 1000 mL. The pH of solution from cadmium chloride CdCl2 was adjusted with 0.1 N HCl or 0.1 N NaOH. In each adsorption test, 200 ml of cadmium solution of 20 mg/L was mixed with a 20 mg mass of activated oil shale (YCS), and then the mixture is stirred for 24 hours. The equilibrium concentration in Cd (II) ions was determined by atomic absorption spectroscopy (AAS), the quantity of Cd (II) ions adsorbed per unit mass of the activated oil shale (YCS) was calculated using the following form of eqn. (1):
2
www.tsijournals.com | May-2018
Qads ((mg/g))=((C0-Ce)*V)/mYCS
(1)
Where Qads is the adsorption capacity of Cd (II) ions (mg/g), V: volume of the solution of Cd (II) ions (L), C 0: initial concentration of Cd (II) ions (mg/L), Ce: equilibrium concentration of Cd (II) ions (mg/L) and m YCS: mass of the activated oil shale (g). Response surface methodology Response surface methodology is a combination of mathematical and statistical techniques used to develop and optimize processes and to determine the relative significance and interaction of all variables, response surface methodology step followed by determination of the optimal region [11]. One of the most popular response surface methods is the Central Composite Design (CCD). The CCD was used to examine the influence of the activation parameters on the response [12,13]. In the central composite design step, experiments were randomly planned to minimize the effect of uncontrolled variables as shown in TABLE 1.
TABLE 1. Experimental factors and levels in the central composite design. Factors
Levels Low (-1)
Central (0)
High (+1)
(X1)
160°C
210°C
260°C
(X2)
15 min
30 min
45 min
(X3)
1.5
2
2.5
A central composite design was used to determine the pertinence of the three factors: the activation temperature (X1), activation time (X2) and massic ratio (X3). The first step of this study is the choice of appropriate plan that suits us ideas to optimize the experimental conditions [14]. We have chosen to work with the composite plan on three factors with three levels. The chosen allows studying the influence of these factors on response. The plan consists of three parts: factorial design helps in optimizing the activation parameters [15], whose factors are two levels -1 and+1, experimental point in the center of the study area 0 and axial points on the axes of each factor. For three variables (n=3) and two levels (low (-) and high (+)), the total number of experiments was 16 determined by the expression: (2n (2 3=8: full factor points)+2n (2*3=6: axial points)+2 (center points)) (TABLE 2). The response measured was the adsorption capacity of Cd (II) ions, the design consisted of 16 experiments point carried out in random order. The suggested model for the quadratic model of the response variable, according to the independent variables [16], the mathematical relationship between the independent variables can be approximated by the second order polynomial model (eqn. 2):
R=a0+a1X1+a2X2+a3X3+a11X12+a22X22+a33X32+a12X1X2+a13X1X3+a23X2X3
(2)
Where R is the predicted response: adsorption capacity of Cd (II) ions. X is are the independent variables, (Activation temperature (X1), activation time (X2) and massic ratio (X3)), the parameter a0 is the model constant, a1, a2, a3 are the linear coefficients, a11, a22 and a33 are the quadratic coefficients and a12, a13 and a23 are the interaction effect [17]. The modeling is performed adjusting polynomial equation obtained by analysis of variance (ANOVA) [18].
3
www.tsijournals.com | May-2018
TABLE 2. Experimental design in coded and reels variables for central composite design. Matrix of the
Matrix of the reels
coded factors
factors
Comment
Experimental value of Qads
1
-1
-1
-1
160
15
1.5
Full factorial
75.1
2
1
-1
-1
260
15
1.5
Full factorial
63.12
3
-1
1
-1
160
45
1.5
Full factorial
50.61
4
1
1
-1
260
45
1.5
Full factorial
62.74
5
-1
-1
1
160
15
2.5
Full factorial
76.99
6
1
-1
1
260
15
2.5
Full factorial
72.69
7
-1
1
1
160
45
2.5
Full factorial
62.74
8
1
1
1
260
45
2.5
Full factorial
16.52
9
0
0
-1
210
30
1.5
Axial point
62.73
10
1
0
0
260
30
2
Axial point
62.74
11
0
1
0
210
45
2
Axial point
45.23
12
0
0
1
210
30
2.5
Axial point
38.68
13
0
-1
0
210
15
2
Axial point
90.91
14
-1
0
0
160
30
2
Axial point
82.74
15
0
0
0
210
30
2
Center point
98.61
16
0
0
0
210
30
2
Center point
87.41
Each experiment was repeated three times.
Results and Discussion Acid attack of oil shale The powder of oil shale (Y-layer) was added, with stirring a solution of hydrochloric acid HCl (1 mol/L) until the complete release of carbon dioxide, according to the following equations. 2 HCl+CaCO3 CaMg(CO3)2+4 HCl
CaCl2+CO2+OH2 CaCl2+MgCl2+2 CO2+2H2O
Activation process of oil shale Activation processes can be classified into physical and chemical activation. During physical activation, the oil shale may undergo gasification produced during carbonization [19,20]. On the other hand, chemical activation consists of impregnating with chemicals such as ZnCl2, H3PO4, HNO3 or H2SO4 [21,22]. The concentrated oil shale (YC) was activated by sulfuric acid H2SO4 at the temperature 300°C for 1 hour. The product obtained, referenced by (YCS) where "S" denotes the activation with sulfuric acid H2SO4. The activation with sulfuric acid H2SO4 has become a widespread method for the manufacture of activated carbon. The use of sulfuric acid (H2SO4) has some environmental advantages such as easy recovery, low energy cost, plays two roles during the preparation of activated oil shale (YCS), acts as an acid catalyst to promote bond cleavage, 4
www.tsijournals.com | May-2018
dehydration, and may function as a template because the volume occupied by sulfuric acid in the interior of the activated is coincident with the micropore volume of the activated oil shale obtained [23]. Optimization using the response surface methodology The variables studied are: the activation temperature (X1), activation time (X2) and massic ratio (X3) and the measured response was the adsorption capacity of Cd (II) ions (Q ads(mg/g)). After choosing the response and the variables, we have sought to optimize and modeling of the activation process for removal of Cd (II) ions by oil shale using the response surface methodology. The central composite design to three levels was conducted to evaluate the influence of experimental factors on the adsorption capacity of Cd (II) ions. We realized an adsorption test of the 16 experiments. The experimental data have been reproduced three times to evaluate the statistical quality of the results (TABLE 2).
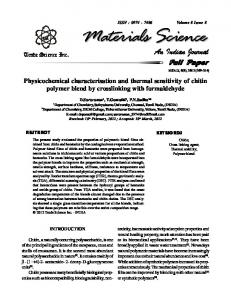
Evaluation of the quality of the model The coefficient of adjusted regression R2 for the adsorption capacity was equal to 0.92. This indicated that more than 92% of the variation observed was explained by the direct effects of the factors. Therefore, the choice of quadratic model to modeling of activation process was best. The result of this test is shown in FIG. 1 and TABLE 3.
FIG. 1. Graphical representation of observed values as a function of predicted values. TABLE 3. Quality of quadratic model chosen to model the activation conditions for removal of Cd (II) ions.
Regression analysis ANOVA test Validation model
Variable studied Adsorption capacity of Cd (II) R square (R2) 0.92 Adjusted R square (RA2) 0.91 F value 50.82 p-value Fα, νmod, νres), where α=0.05. According to the result of ANOVA test, analysis 5
www.tsijournals.com | May-2018
of experimental give a factor Fexp=50.82. The theoretical values determined according to the table of Fisher Snedecor (for νmodel=9, νresidue=38 and confidence level=95%) was Fα, νmod, νres=F 0.05, 9, 38=2.19. This theoretical factor was much lower than the experimental factor, Fexp=50.82 >> Ftheo=2.19. The results of the lack of adjustment of analysis indicate that the p-value was largely experimental factor less than 0.05, these analyses were determined using the JMP12 software, shown in TABLE 3. The results of ANOVA test and the lack of adjustment showed that the quadratic model established was validated.
Equation of the model The significance of each coefficient was determined using the F-test and p-value given by JMP 12 software. A p-value less than 0.05 indicate the significance of an effect at 95% confidence level [24]. The significant effects and their coefficients are shown in TABLE 4. The effects coefficients of model showed that the adsorption capacity of Cd (II) ions was significantly affected by the quadratic term of activation temperature (X 1) and massic ratio (X3), the antagonistic effect of activation time and massic ratio (X23), was not significantly, p-value larger than 0.05, we can neglect this coefficient from the equation of the adsorption capacity of Cd (II) ions. The fitted quadratic model for removal of Cd (II) ions given by eqn. (3). Qads (mg/g)=76.15–15.95*X1–4.76*X2+10.19*X3–5.69 *X12+4.51*X13–12.07*X12+5.95*X22 – 6.50*X32
(3)
TABLE 4. Significant effects coefficients of established equation model for removal of Cd (II) ions.
X1
-15.95
Standard deviation 1.043
X3
10.189
1.04
Term
Estimation
t value
t value
Prob.>|t|
Comment
15.30