Hydrogeol J DOI 10.1007/s10040-015-1337-z
REPORT
Modelling nitrate pollution pressure using a multivariate statistical approach: the case of Kinshasa groundwater body, Democratic Republic of Congo Antoine Mfumu Kihumba 1,2 & Jean Ndembo Longo 2 & Marnik Vanclooster 1
Received: 9 March 2015 / Accepted: 1 November 2015 # Springer-Verlag Berlin Heidelberg 2015
Abstract A multivariate statistical modelling approach was applied to explain the anthropogenic pressure of nitrate pollution on the Kinshasa groundwater body (Democratic Republic of Congo). Multiple regression and regression tree models were compared and used to identify major environmental factors that control the groundwater nitrate concentration in this region. The analyses were made in terms of physical attributes related to the topography, land use, geology and hydrogeology in the capture zone of different groundwater sampling stations. For the nitrate data, groundwater datasets from two different surveys were used. The statistical models identified the topography, the residential area, the service land (cemetery), and the surface-water land-use classes as major factors explaining nitrate occurrence in the groundwater. Also, groundwater nitrate pollution depends not on one single factor but on the combined influence of factors representing nitrogen loading sources and aquifer susceptibility characteristics. The groundwater nitrate pressure was better predicted with the regression tree model than with the multiple regression model. Furthermore, the results elucidated the sensitivity of the model performance towards the method of delineation of the capture zones. For pollution modelling at the monitoring points, therefore, it is better to identify capture-zone shapes based on a
* Antoine Mfumu Kihumba
[email protected] 1
Earth and Life Institute – Environmental Sciences, Université catholique de Louvain (UCL), Croix du Sud, 2 – bte L7.05.02, 1348 Louvain-la-Neuve, Belgium
2
Commissariat Général à l’Energie Atomique, Centre Régional d’Etudes Nucléaires de Kinshasa, B.P. 686 Kinshasa XI, Kinshasa, Democratic Republic of Congo
conceptual hydrogeological model rather than to adopt arbitrary circular capture zones. Keywords Multiple regression . Nitrate . Regression tree . Democratic Republic of Congo . Groundwater statistics
Introduction Nitrate contamination of groundwater is considered to be a serious environmental problem worldwide (Majumdar and Gupta 2000; Laftouhi et al. 2003; Almasri and Kaluarachchi 2004; Widory et al. 2004; Moore et al. 2006; Murgulet and Tick 2009; Ako et al. 2014). This contamination can potentially originate from atmospheric deposition, sewer leakage, septic tank leakage, agriculture fertilizer leaching, river or effluent infiltration, industrial contamination, the mineralization of organic matter and other specific land uses (cemeteries, waste dumps). Increased nitrate concentration in groundwater supplies can potentially cause animal and human health problems such as low oxygen levels in the blood of infants, known as methemoglobinemia (Camargo and Alonso 2006). The maximum allowable concentration of nitrate recommended by the World Health Organization (WHO) for drinking water and commonly used in the Democratic Republic of Congo (DRC) is 50 mg NO−3 /L. Human alteration of the land-use patterns is often one of the major drivers affecting groundwater quality. In the Kinshasa region of the DRC, the vulnerable part of the groundwater body and the part most susceptible to the risk of nitrate pollution is located in the alluvial plain in the northern part of the region (K.A. Mfumu, Earth and Life Institute – Environmental Sciences, Université catholique de Louvain, unpublished data, 2015). The sewage infrastructure of this densely populated area is poorly developed. This area is characterized by urban
Hydrogeol J
land, peripheral undeveloped land, agricultural land and specific service lands. High nitrate concentrations have been reported locally at different monitoring stations, exceeding the WHO limit for drinking water (Ndembo 2008). In such context, the quantitative assessment of the nitrate pollution and the contribution of the different pollution sources is an important step for designing sustainable management and groundwater protection programmes. This can be achieved through a quantitative modelling of groundwater quality in terms of different physical attributes related to the pollution origin and aquifer vulnerability. The Kinshasa region presents a fragmented land use/cover, ranging from residential area, agriculture land, forest and savannah to specific land-use classes encompassing cemeteries and uncontrolled dumps. Residential land use in the northern part of the region is characterized by poorly regulated urban development, fragmented land-use patterns, urban agriculture, absence of proper sewage and septic systems, and weak development of waste-management infrastructure. In addition, groundwater protection efforts are largely neglected, the result of the lack of a well-established water authority and a poorly effective groundwater management policy framework. Therefore, no groundwater protection regulation has yet been developed for the Kinshasa groundwater body and no study supporting regional groundwater protection has yet been performed. Several studies have correlated land use/cover and other environmental variables in the capture zone around the groundwater sampling station to water quality, using different statistical modelling approaches (Nkotagu 1996; McLay et al. 2001; Spruill et al. 2002; Gardner and Vogel 2005; Kaown et al. 2007; Stigter et al. 2008). Mattern et al. (2009), for instance, applied statistical modelling and compared multiple regression and a regression tree to identify the factors affecting the nitrate concentration in the unconfined aquifer of the Brusselian sands (Belgium). They showed further the importance of delineating the shape of the capture zone to explain observed water quality in terms of land-use pressure factors. The capture zone defines a surface beneath which infiltrated water (and/or contaminant) will be Bcaptured^ by a well, well field, monitoring point or spring and can serve as the first area that should be protected against chemical and microbial contamination (Miller et al. 2003). The use of multivariate methods in this study is based on the fact that groundwater nitrate concentration can be influenced by several independent environmental variables considering the fragmented land use in the region. Multivariate statistical models allow an understanding of which terms have the greatest effect on the response, finding the direction of the effect and predicting unobserved values of the response. The classification and regression tree build a set of decision rules for identifying responsible variables based on a dichotomous partitioning of predictor variables. A major advantage of these
models is that assumptions which are required for the appropriated use of parametric statistics such as Gaussian distribution of predictor variables, do not need to be satisfied. Regression tree models allow the complex interactions between the predictor variables to be represented, with no assumptions of linearity; furthermore, while multiple linear regression identifies global relationships in the dataset, regression trees are able to identify local relationships (Rothwell et al. 2008). The objectives of this study are (1) to determine the major environmental factors controlling the nitrate pollution in the Kinshasa groundwater body by means of two multivariate statistical modelling techniques, and (2) to analyse the sensitivity and evaluate the performance of the statistical modelling techniques towards the delineation of the capture zone, by comparing the impact of a simple circular delineation with the delineation by means of a conceptual hydrogeological model.
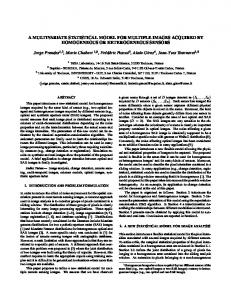
Study area The Kinshasa region encompasses Kinshasa, the capital of DRC. The region is located in the western part of the country and covers an area of 9,965 km2 (Fig. 1a). It is mainly occupied by savannahs, intersected by small steppe and forest galleries; however, this vegetation is rapidly being converted to urban or agricultural land. The urban area, corresponding to residential land, represents 6 % of the region and is located in the alluvial plain along the Congo River and in the hilly zone in the southwest. The urban area is densely populated. Kinshasa was estimated to have 7,500,000 inhabitants in 2005 (Kayembe et al. 2009) but, currently, the population is approximated to be around 10,000,000 inhabitants. The water sanitation infrastructures and equipment of the city are generally very poor. The geology is characterized by sandstones of different geological ages covered by sandy surface layers. These layers are differentiated by the particle sizes or colour; or by the presence of clay or gravels. The sandstones present three stratified levels commonly called series: the polymorphic sandstone series, the cretaceous sandstone series and the sandstones of the Inkisi series, with the latter constituting the regional substratum. Figure 1b shows the hydrogeological cross section in the direction west–east along A–A′ line shown in Fig. 1a. The aquifer is unconfined over most of the region, and consists of Quaternary sands and tender Cretaceous sandstones covering the indurated sandstone of the Inkisi series. It has a thickness varying from a few meters to more than 100 m, particularly in the eastern part of the region. The groundwater recharge is mainly achieved by vertical infiltration due to excess rainfall. Figure 1a shows the estimated depth to groundwater for the region, which was calculated
Hydrogeol J
Fig. 1 a Location of the study area, topography and piezometry of the study area; b Hydrogeological cross section along the A–A′ line (a)
Hydrogeol J
by subtracting the kriged piezometric raster map to a 30-m resolution digital elevation model (DEM). The kriged piezometric map was obtained from the interpolation of piezometric data collected from different drilling enterprises and constrained to the hydrographic network. The estimated depth to groundwater varies from 0 to 420 m with a mean value of 100 m. In general, groundwater flows from the south to the north towards the Congo River. The depth to the water table varies from less than 3–50 m in the plain zone, to more than 100 m in the hilly and plateau zones. The transmissivity of the aquifer varies from 10–5 to 10–2 m2/s and its hydraulic conductivity varies from 10–6 to 10–4 m/s (Ndembo 2008). The region is drained by different rivers, which generally flow from south to north, towards the Congo River. The climate is a tropical dry and wet climate (Aw4 Koppën climate), with an annual mean precipitation of 1,500 mm, a mean air temperature of 25 °C and a mean annual potential evapotranspiration of 1,100 mm.
Materials and methods Groundwater data Groundwater nitrate data were obtained from the study of Ndembo (2008) and from a 2013–2014 survey as part of the study reported here. Groundwater was sampled from different stations (wells, boreholes and springs) used for drinking-water supply. Table 1 presents the summary statistics of the nitrate concentration data collected during these two campaigns. The nitrate concentration data show a large spatial variability (Fig. 2) with values ranging from 0.025 to 339 mg/L. When considering the two measurement campaigns with respect to time, the mean nitrate concentration seems to increase (from 36 to 39.84 mg/L). Locally high nitrate concentrations (>50 mg/L) were observed in urban and peri-urban areas in the north-western part of the region. The nitrate concentration data of the 2008 survey were used to calibrate the statistical models and those from 2013–2014 to evaluate the performance of the model. Land-use map It is known that land use affects the quality of water as it determines the types and amount of contaminants introduced at the land surface. A detailed land-use map of the study area Table 1
was derived from 2013 Landsat images combined with highresolution IKONOS images for the urban area. This land-use map yielded eight classes: residential and peri-urban land, service land, forest, savannah, agriculture land, marshland, water/river, and bare soil (Fig. 2). Capture zone delineation In Kinshasa, the population relies on groundwater for drinking-water supply, particularly in the peripheral zone; thus, protecting the quality of the groundwater by delineating protection areas around drinking-water stations is important. The capture zone or wellhead protection area represents the surface and subsurface area that surrounds a well field, well or spring that supplies a public drinking-water system, and through which potential contaminants can reach the sources within a specified period of time (USEPA 1993; Miller 2005; Fadlelmawla and Dawoud 2006). The delineation of the capture zone is therefore the process of determining the geographic area that should be included in a protection area of a groundwater protection program (Mogheir and Tarazi 2010). In this study, the delineation concept was applied to the monitoring stations (wells, boreholes and springs) of the Kinshasa groundwater body. First, a simplified approach was adopted to delineate the capture zone of the sampling station based on the circular method. Second, a conceptual method was implemented, based on a uniform flow hypothesis in the unconfined aquifer. For this latter method, the Wellhead Analytic Element Model (WhAEM2000), which solves the aquifer flow equation based on the analytic element method (USEPA 1993, 2007), was used. With the first approach, a circular capture zone centred on the water station with an arbitrary fixed radius of 300 m was delineated, using the buffer tools in ArcGIS. Subsequently, use was made of the WhAEM2000 computer model, which provides an interactive computer environment for the design of the protection area based on three methods: the fixed radius, the steady state flow and the uniform flow (Badv and Deriszadeh 2005; Kraemer et al. 2007). In this study, the last method was used supposing further that no interaction between surface water and groundwater occurred. To delineate the capture zone around the water stations, the 5-years travel time isoline was considered. The capture zone designed by the WhEAM model depends on several parameters, including the magnitude and direction of ambient flow near the water station, and the time it takes groundwater to travel a specified horizontal distance. The
Nitrate dataset summary statistics
Period
No. of stations
NO−3 min (mg/L)
NO−3 max (mg/L)
NO−3 mean (mg/L)
NO−3 stdv (mg/L)
2008 2013-2014
55 109
0.03 100 mg/L). The classification and regression tree was applied to the dataset and the estimated nitrate concentrations
were compared to the measured nitrate concentrations resulting in a R2 of 0.89 and a RMSE of 16.17 mg/L for the circular capture zones and in a R2 of 0.94 and a RMSE of 6.35 mg/L for the uniform-flow capture zones (Fig. 6). Figure 7 represents the regression tree based on the circular and the uniform-flow-delineated capture zones. The most important explanatory variable, when considering the uniformflow capture zones is the percentage of surface water in the capture zone around the monitoring station (LU05), and the threshold value is 0.9 %. For a low percentage of surface water ( 0.9 %), the tree shows that the percentage area of service land in the zone around the water station (LU02) has a significant impact on the nitrate concentration in groundwater. Indeed, at high values of LU02 (> 19.2 %), the mean nitrate concentration is 138 mg/L, while at low values it depends on the percentage of mixed forest in the capture zone (LU06), and the threshold value is (1.1 %). For the following stages, the mean nitrate concentration depends on the percentage of forest (LU06) and the percentage of service land (LU02). When the area of service land in the capture zone is high (> 10.5 %) the mean nitrate concentration is 24 mg/L, while at low serviceland area (< 10.5 %), the mean nitrate concentration is decreasing and dependent on the depth to the water table at the monitoring station; it also depends on the area of residential land in the capture zone around the monitoring station. On the other hand, when the area of forest is high (>0.3 %), the mean nitrate concentration is 86 mg/L, and for low forest area, the mean nitrate concentration depends on the other variables, like the area of residential land and the altitude, as shown on the tree (Fig. 7a).The regression tree based on the circulardelineated capture zones (Fig. 7b) indicated that the following are the most important explanatory variables for groundwater pollution by nitrate—the slope, the depth to the water table at the monitoring station, the area of surface water, and the area of residential land in the capture zone around the monitoring station. Evaluation of model performance Environmental variables have an impact on the Kinshasa groundwater nitrate pollution, as demonstrated by the statistical modelling. The regression tree models using the circular and the uniform-flow capture zones (Fig. 6) resulted respectively in an R2 of 0.89 and 0.93. The validity of these two models was evaluated using FITEVAL and independent data collected during the 2013–2014 survey. Results are presented in Fig. 8. The results obtained from the two models yielded different model performance ratings. The regression tree model for data collected in the circular capture zones spans from an unsatisfactory to good prediction of the groundwater nitrate
Hydrogeol J
^ coefficients estimates Fig. 5 β with their 95 % confidence intervals resulting from the multiple regression model using a circular and b uniform-flow delineated capture zones
concentrations—NSE=0.486 (–0.085 to 0.799)—within the observed value range. The scattered data follow the 1:1 line, but the plot scale of observed vs. estimated values is substantially reduced. On the basis of the qualitative goodness-of-fit, the model performance is considered unsatisfactory. Figure 8b illustrates the results of the regression tree model for data collected in the uniform-flow capture zones. The fit spans from unsatisfactory to very good prediction of groundwater nitrate pollution—NSE=0.803 (0.286 to 0.939). The model performance is significant even though there is a probability of obtaining an NSE