ARCHIVES OF ACOUSTICS 31, 2, 213–230 (2006)
MODELLING OF GREEN FUNCTION IN A RECTANGULAR ROOM BASED UPON THE GEOMETRICAL-FILTRATION MODEL
R. MARCZUK, L. MAJKUT AGH University of Science and Technology Department of Mechanics and Vibroacoustics Al. Mickiewicza 30, 30-059 Kraków, Poland e-mail:
[email protected],
[email protected] (received April 30, 2005; accepted October 25, 2005) Significant problem in room acoustic is evaluating an acoustic quality of projected and modernized rooms. Estimation of room impulse response giving posibility to evaluate the subjective and objective room acoustic properties and hence to run the room simulation tests (the sound sources configuration, the room planning) in order to reach optimal solutions, which meet the given criterion. To this end it is necessary to work out an impulse response calculating algorithm for a digital room model. The Green’s function is the solution of wave equation then give consideration to source and receiver positions. For inhomogenous wave equation with function δ(x − y)δ(t − τ ) as excitation, Green’s function corresponds to the impulse response of linear system described by this equation. This paper presents a Green function (impulse response) approximation method based on combined room acoustics model. Sound propagation paths are calculated using geometrical acoustics model (image sources method) while events like reflection from bounding walls, air absorption and delay between events are modeled as digital filters. Results of room impulse response approximation model are compared with analytical solution for rectangular room. Key words: room impulse response, Green’s function, digital filters, image source method.
1. Introduction Performing the evaluation of the acoustic quality of the existing room on the basis of coefficients determined from the impulse response is the task that does not pose significant problems. The principal problem of room acoustics is performing the evaluation of the acoustic quality of planned or modernized rooms. This requires the development of the algorithm of determining the impulse response for the digital model of the room.
214
R. MARCZUK, L. MAJKUT
The possibility of determining the impulse response of the planned or modernized room, thereby performing the objective and subjective evaluation of its acoustic quality allows carrying out the simulation tests of the rooms (the variants of development, configuration of sound sources, etc.) in order to arrive at the optimal solutions in the light of the criteria adopted. The propagation of the acoustic wave in the room is described by the wave equation. One of the solutions of wave equation is the Green function, which, by and large, is the impulse response of the way of sound transmission between the source and the receiver. This solution for any boundary conditions (the shape of the room and the acoustic properties of the surface) is impossible to find in an analytic way. Therefore, the attempt has been made of modelling the Green function in the room (and thus, modelling the impulse response) using the geometrical-filtration model of the acoustic field. Commonly known geometrical methods are used in this model for determining the routes of the acoustic beams, and then, each event along the route (reflection, delay, air absorption) is modelled as the digital filter. This leads to obtaining the network of digital filters that model the acoustic field in the room. Determining the substituting transmittance of this configuration through the inverse Fourier transform we get the impulse response sought, i.e. the Green function. Also the impulse response may be obtained in the classical way, giving the input function in the form of the Dirac delta at the input of the digital filters network. 2. The Green function as the solution of the wave equation One of the principal problems of the field theory in general and specifically acoustic field is the construction of the solutions to the partial differential equation in the space where the point source has been introduced, while the differential equation must meet the specific boundary conditions. Using the Green theorem, the integrated equation may be constructed, linking the effect of action of the source, wave propagation, boundary and initial conditions in the simple formula. The Green function g(x, t|y, τ ) is the solution to the wave equation (1): −
1 ∂2g ∂2g = δ(x − y)δ(t − τ ). + c2 ∂t2 ∂x2i
(1)
The impulse function δ(x − y)δ(t − τ ) represents the omnidirectional point source with unit amplitude, located in point y, emitting the impulse with time τ . g is the response received in observation point with coordinates x with time t. In addition, the function g must meet the proper boundary conditions on the surface S, restricting the volume V , containing the points x, y. Assuming that the sine acoustic wave propagates, the classical wave equation (1) has the form as below, known as the Helmholtz equation [13]: ∂2g − k 2 g = δ(x, y), (2) ∂x2i where k = ω/c0 – wave number.
MODELLING OF GREEN FUNCTION IN A RECTANGULAR ROOM ...
215
The Green function g(x|y) (independent of time) is a very important function which is frequently used to solve the problem of acoustic wave propagation spreading in the ideal, non-viscous, homogenous fluid medium. The Green function for the free space has the form [14]: e−jk|x−y| g(x|y) = − , (3) 4π|x − y| where k = 2πf /c = 2π/λ – wave number, x = xˆ x + y yˆ + z zˆ – receiver position, ˆ + y0 yˆ + z0 zˆ – source position. y = x0 x The above function is the solution of the non-homogenous Helmholtz equation, describing the propagation of the wave in the free space. 2.1. Solution for the arbitrary source The propagation of acoustic signals with small amplitude in the ideal (non-viscous) fluid medium may be described with the following, linear, lossless, non-homogenous wave equation (for the 3-D coordinate system) ∇2 φ(t, x) −
1 ∂2 φ(t, x) = fM (t, x), c2 ∂t2
(4)
where φ(t, x) – the potential of velocity for time t and location x, fM (t, x) is the input function (source distribution function), c – speed of sound. The solution of the above-mentioned equation may be arrived at through treating the fluid medium as the linear filter. This is allowed as the linear wave equation is being solved. Therefore, taking advantage of the linear system theory, incorporating the Fourier transform, we obtain the solution of the linear, non-homogenous wave equation (4) for the free space. Combining the relations between the theory of linear systems and physical propagation of acoustic signals with small amplitude in the fluid medium, we get the alternative solution to this problem (as compared with the conventional approach).
Fig. 1. Scheme of the linear, spatial filter, dependent on time t, τ and location x, y.
In the Fig. 1 the scheme of the linear filter has been presented, for which the relation between the input y(t, y) and output x(τ, x) is described with the relation as below: Z∞ Z∞ x(t, x) =
y(t, y)h(t, x|τ, y) dt dy. −∞ −∞
(5)
216
R. MARCZUK, L. MAJKUT
The function h(t, x|τ, y) is the impulse response of the linear filter described, i.e. the response of the linear system in the point with coordinates x = (xx , yx , zx ) and in time t, if the unit-amplitude impulse has been delivered at the input, with time τ and location y = (xy , yy , zy ). If the filter is causal, then h(t, x|τ, y) = 0 for t < τ , i.e. the filter may not respond before application of an input. The relation (5) is correct for each linear filter that is dependent on time and location, both for the filter constituting the model of the acoustic wave propagation with small amplitude and for each physical system, whose output and input is bound with the linear differential partial equation. Taking into consideration the investigation above, the source function fM (t, x) may be treated as the input function of the linear system y(t, y), while the potential of velocity looked for as the output of the linear system. This allows to write the Eq. (5): Z∞ Z∞ φ(t, y) =
fM (t, x)hM (t, x|τ, y) dt dy.
(6)
−∞ −∞
The function hM (t, x|τ, y) is the impulse response or the Green function along the transmission path between the source in point x and receiver in point y. In order for the Eq. (4) to be solved, both sides of this equation must be subjected to Fourier transform. On completion of these operations we get: ∇2 Φ(f, x) + (2πf /c)2 Φ(f, x) = FM (f, x),
(7)
where Φ(f, x) – the spectrum of velocity potential, FM (f, x) – the spectrum of input function (source), f – frequency [Hz]. Following the transformations we obtain equation: Φ(f, β) = HM (f, β)FM (f, β),
(8)
where β = (βx , βy , βz ) – three-element vector, whose components are natural frequencies, respectively towards direction X, Y , Z HM (f, β) =
(2πf /c)2
− [(2πβx
)2
1 + ((2πβy )2 + ((2πβz )2 ]
(9)
transmittance of the system (transfer function). According to the definition of the linear system, its impulse response is the response to the input function, in the form of the unit-amplitude impulse, delivered at the input of the system. If so, then the input function fM (t, x) may be expressed as follows: fM (t, x) = δ(t − τ )δ(x − y).
(10)
Taking into consideration in the above investigation the form of the input function provided and executing the inverse Fourier transform of the Eq. (8) we obtain the impulse response (Green function) [14]: · µ ¶¸ 1 |x − y| hM (t, x|τ, y) = − δ t − t0 + . (11) 4π|x − y| c
MODELLING OF GREEN FUNCTION IN A RECTANGULAR ROOM ...
217
2.2. Solution for the rectangular room If, in the case of propagation in the free space, it is possible to obtain an accurate solution by introducing the boundary conditions into the equation, we look for the approximate solution only. Same as the case of wave propagation in the free space, we will look for the solution of the non-homogenous Helmholtz equation (12): ∂2g − k 2 g = δ(x, y). ∂x2i
(12)
The solution of the Eq. (12) will be looked for through the input function decomposition into the series of eigenfunctions, i.e. δ(x, y) =
∞ X
dn φn (x),
dn = φy.
(13)
n
Combining the above, the Eq. (12) has the form: ∂2G − k 2 G = λn φn ∂x2i
(14)
while the solution expresses the relation (15): G=
∞ X
gn φn (x).
(15)
n
Providing the above relations to the Eq. (12), we get the Eq. (16) X X φn (y)φn (x). gn λn φn =
(16)
n
n
Hence, Green function: G(x, y) =
X φn (x) · φn (y) n
λn
.
(17)
For the rectangular room, the eigenvectors may be determined by means of the Fourier method, predicting the solution in the form: Gn (x) = X1 (x1 ) · X2 (x2 ) · X3 (x3 ).
(18)
Each of the functions Xi (xi ) must satisfied the impedance boundary conditions (19): ∂G = Z · jωG · n, (19) ∂xi where n k xi – the vector normal to the surface with impedance Z.
218
R. MARCZUK, L. MAJKUT
As a result of calculations, the solution to the equation in the frequency domain is obtained, i.e. the amplitude-frequency characteristics in the receiving point. Executing the inverse Fourier transform, we obtain the impulse response: h(x, y, t) = F −1 {G(x, y)},
(20)
where F −1 – the inverse Fourier transform. 3. Geometrical approximation We may say that the acoustics for centuries have used the geometrical approximation of the acoustic field. There is some evidence that ancient Greeks used to use geometrical methods while testing the acoustics of the planned theatres [5, 12]. Also in our new era, the geometrical model is willingly used, in spite of its restrictions. However, the development of the applications of these methods does not come as an astonishment, as it is due to their simplicity, pictorial nature and relatively high efficiency. Particularly frequently, geometrical approximations are used in non-homogenous systems where the speed of sound is not a constant value. From among approximated geometrical solutions, among the others, the following may be recognized, notably approximation of the geometrical optics, WKB approximation, approximation of the parabolic equation, and so forth [14]. In the case of the steady states, the most interesting in practice, the solution of the Helmholtz equation (2) is sought in the form of the function φ(x) exp(iωt). The mathematical problem is related to the Helmholtz equation: to find φ(x) that fulfils the ¯ ¯ Eq. (2), as well as the boundary condition φ(x) = φ(x) = A¯ exp(iϑ(x)) on a certain surface Σ. Assuming the solution of the linear wave equation (in the form of the Helmholtz equation) in the lossless, homogenous medium and the speed of sound is the function of location c(r) = c(x, y, z), we look for the solution of the Helmholtz equation in the form: ∇2 φf (r) + k02 n2 (r)φf (r) = 0. (21) Inserting into the Eq. (21) the solution of the form φ(r) = A(r) exp(ik0 L) and splitting the equation to the real and imaginary part [2, 14] we have: (∇L)2 = n2 , ∇(A2 ∇L) = 0.
(22) (23)
The equation (22) is eikonal equation. The eikonal equation physically expresses the fact that irrespective of the conduct of amplitude throughout the entire space, the proportion of the speed of sound in the system to the local phase velocity is equal to n, i.e. for the homogenous system n = 1. The equation (23) transport equation is a well known amplitude propagation theorem, in the optical geometry determined exclusively through the changeability of phase. The optics, in addition to the notion
MODELLING OF GREEN FUNCTION IN A RECTANGULAR ROOM ...
219
of equi-phase surfaces L = const (with the same phase), introduces the notion of the beams as the orthogonal lines into the family of surfaces L = const. The equation (23) may be interpreted as the equation expressing the fact that the wave with amplitude A2 propagates along the beams (geometrical acoustics). If the propagation of waves is considered in the rectangular system of coordinates, and the homogenous medium is assumed, the equi-phase will be planes while the beams will be straight lines. The geometrical approximation of the wave equation mentioned above is the solution constituting the bridge between the geometrical and wave optics and refers not only to electromagnetic waves but, through the analogy, also to wave and geometrical acoustics. In the further part of this report, a significantly simpler geometrical interpretation of acoustic field will be used, in the form of the commonly known geometrical model, allowing relatively non-complex calculation implementation. 4. Digital model of the room In the geometrical model of the acoustic field, the room is presented as the set of surfaces, to which the relevant acoustic properties have been assigned (most often, the reverberation coefficient of absorption). The sources are presented as the point with the all-directional or directional characteristics of radiation. The scheme of acoustic wave propagation in the room has been presented in the Fig. 2.
Fig. 2. Scheme transmission’s paths of the acoustic signal in the room.
Let the point source (with coordinates y) emits the unit-amplitude acoustic impulse, received in point x . The signal delivered is filtered through the impulse response of the room. On its way between the source and the receiver, the acoustic wave is subject to a number of reflections, where its energy is lost at the same time (in the function of frequency). Hence, the direct wave from the source reach the receiver, as well as the reflected waves. The direct wave arrrive after |x − y|/c seconds from the signal emission
220
R. MARCZUK, L. MAJKUT
(c – speed of sound). The remaining elements of the signal reaching the receiver constitute the “reverberation” part of the signal. Their amplitude and the arrive time depends on the location of the sources and acoustic properties of the boundary surfaces. As commonly known, in the image method, the walls of the enclousure are replaced with the point sources with relevant power and location. The amplitude and location of each of the source is selected so that the admittance boundary condition is satisfied. For the source emitting the harmonic signal, the complex amplitude of pressure in the observation point may be determined at from the following formula: G(x, y, ω) =
X j
Rj
eiωXj /c , 4πXj
(24)
where ω – angular frequency, c – speed of sound, Xj – the distance between the observation point and the j-th image source, Rj – strength of the j-th image source. ˆ ˆl, m The index j corresponds to the summing against all indexes: k, ˆ corresponding to the directions of the adopted system of coordinates. Each coefficient of reflection Rx , ˆ may be determined from corresponding to the apparent source with coordinates x(k) the recurrsion: ( ˆ ω), Rx (−kˆ − 1, ω)b(k, k < 0, ˆ ω) = Rx (k, (25) ˆ ω), Rx (−kˆ + 1, ω)b(k, k > 0, ˆ ω) is the coefficient of reflection of the plane wave. where b(k, Similar relations may also be written for the remaining coordinates y(ˆl) and z(m). ˆ ˆ The power of the j-th image source may be determined from the relation Rj = Rx (k) Ry (ˆl)Rz (m). ˆ Impulse response in the receiving point for the model of the image sources may be described by the equation: h(x, x, t) =
X j
rj (t) ∗
δ(t − Xj )/c X rj (t)(t − Xj )/c = , Xj Xj
(26)
j
where rj – is the inverse Fourier transform Rj , δ – Dirac delta. As may be seen, the impulse response between the source and the receiver is the convolution of coefficient of reflection and the Dirac delta shifted in time. The denominator Xj reflects the decay of the amplitude with the distance, which is the result of the spherical expansion of the wave from the image source. The impulse response determined in that way (the so-called energy impulse response of the room, also known as reflectogram) is shown in the Fig. 3. The impulse response (reflectogram) obtained in that way delivers useful information about the room subject to modelling, however, for subjective tests (through the convolution with the test signal) is not particularly suitable [3, 6]. By means of the relevant operations, the impulse response of the room may be approximated, treating
MODELLING OF GREEN FUNCTION IN A RECTANGULAR ROOM ...
221
Fig. 3. The typical impulse response h(x, y, ω).
the reflectogram as the input data. This method of modelling has been discussed in works [6, 10]. 4.1. Model of sound transmission path Another approach will be presented in this report, based on the model of image sources. Each bar of the reflectogram corresponds to a certain path of transmission of the acoustic waves in the room. Each path of the sound transmission from the source to the receiver comprises a number of partial events, such as reflection, diffraction, penetration, delay, etc [9]. By treating each of these events as the linear phenomena, they may be described by means of the transmittance, as shown in the Fig. 4. A number of component transmittances depends on the geometrical relation of the objects along the specific transmission path and on the inclusion of the order of the image source or the number of reflections (for the beam method). For the transmittances linked parallel, the equation may be written: H(jω) = H1 (jω) + H2 (jω) + · · · + HN (jω),
(27)
and for the serial system: H(jω) = H1 (jω) · H2 (jω) · · · · · HN (ω).
(28)
222
R. MARCZUK, L. MAJKUT
Fig. 4. The block diagram of the transmittance of the signal transmission paths, where Hij (jω) – component transmittances of the sound transmission path, hij (τ ) corresponding, partial impulse response is of the specific path of sound transmission.
From the Eqs. (27) and (28), it can be concluded that the transmittance of the object presented in the Fig. 4 may be shown by means of the relation: Hw =
K Y N X
Hij (jω)
(29)
j=1 i=1
while the transmittance of the input signal, i.e. received in the listening point, as: Y (jω) = X(jω) · Hw (jω).
(30)
Respectively to the determination of the impulse response of the specific path, the following formula may be used: hpath (τ ) = h1 (τ ) ∗ h1 (τ ) ∗ · · · ∗ hN (τ ).
(31)
The impulse response of the system comprising a number of transmission paths is described by the relation: hw =
K X
hj1 ∗ hj2 ∗ hj3 ∗ · · · ∗ hjN .
(32)
j=1
While the signal arrive the listening point is determined by the equation: y(t) = x(t) ∗ hW , K X y(t) = x(t) ∗ hj1 ∗ hj2 ∗ · · · hjN .
(33)
j=1
Hence, the impulse response of the transmission path may be determined through the convolution of the elementary impulse responses of the individual components of the way, with the incorporation of the total delay: L , (34) c where L – the length of the transmission path, c – the velocity of sound propagation. τ=
MODELLING OF GREEN FUNCTION IN A RECTANGULAR ROOM ...
223
Following summing the impulse responses along all transmission paths, the impulse response adequate for the geometrical models will be determined. 4.2. Model of the acoustic characteristics of the material The presented method of determining the impulse response, in addition to analyzing the acoustic field in the room realized by means of geometrical methods, requires the determination of the partial impulse responses of individual phenomena occurring along the way of transmission of the acoustic signal: reflection, diffraction, absorption of wave in the medium. These impulse responses may be determined by way of measuring methods, such as described in [9]. For the purposes of this paper, the modelling has been proposed of the impulse response of the reflection of the IIR (Infinite Impulse Response) digital filters. 4.2.1. Characteristics of the surface reflection
The characteristics of the acoustic properties of the room boundaring surfaces mostly encountered is the coefficient of absorption α(ω) usually given for the octave bands: 125, 250 500, 1000, 2000 and 4000 Hz. In the measuring methods based upon the DSP (Digital Signal Processing), the impulse response of the reflection r(t) or the complex coefficient of reflection R(jω) = F (r(t)) is obtained, where F is the Fourier transform. As the coefficient of absorption is the proportion of energy absorbed by the surface and the incident acoustic wave [5], the relation between α(ω) and R(jω) is described by the formula: α(ω) = 1 − |R(jω)|2 , (35) p from where obtained |R(jω)| = 1 − α(ω). Relationship between impedance Z(jω) (normalized) and the coefficient of reflection is given by equation: R(jω) =
Z(jω) − 1 . Z(jω) + 1
(36)
Based upon the above-mentioned equation, the acoustic characteristics of the material may be transformed into the form of the coefficient of reflection R(jω) or the impulse response r(t), which are used for the approximation of the characteristics of the given digital filter. 4.2.2. Modelling the characteristics of digital filter
A number of digital filter characteristics are known, based upon AR, MA or ARMA models. MATLAB package of Mathworks Inc., contains relevant functions such as yulewalk, invfreqz, cremez and others. The selection of the method depends on the available data regarding the response of the surface and on ultimate project criteria (computation complexity, accuracy of mapping, etc.).
224
R. MARCZUK, L. MAJKUT
In the tests presented, the Yule-Walker algorithm has been used for determining the coefficients of the recursive filter, type IIR, of the specific order. This method estimates the spectral density of the power of the input signal, adjusting the parameters of the auto-regression model through the minimization of the error in the least square estimation [11, 16].
Fig. 5. Approximated characteristics of filters of order n = 3 and n = 7.
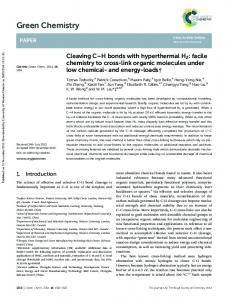
Figure 5 shows the spectral characteristics of the approximated filters IIR, respectively for order 3 and 7 (continuous line) and the characteristics of reflection (bars) for the carpet, from the material database of Raynoise software [15].
MODELLING OF GREEN FUNCTION IN A RECTANGULAR ROOM ...
225
Fig. 6. The impulse response and the chart of poles and zeros for the filter of order n = 7.
The characteristics 6 and 7 presents the impulse response and the chart of poles and zeros for the filter of order 7 and order 3. Each IIR filter may be described with the equation: B(e)jω b(1) + b(2)e−jω + .... + b(m + 1)e−jmω = . A(e)jω a(1) + a(2)e−jω + .... + a(n + 1)e−jnω
(37)
As shown on the charts, all poles and zeros are found inside the unitary circle, which means that the filters designed are stable. It is also possible to see that the higher the order of the filter, the better the adjustment of the spectral characteristics of the filter to the specific characteristics of the material.
226
R. MARCZUK, L. MAJKUT
Fig. 7. The impulse response and the chart of poles and zeros for the filter of order n = 3.
4.3. Characteristics of medium absorption The effect of acoustic wave absorption in the air becomes significant for large acoustic spaces, such as concert halls, where the reflections of higher orders reach (the same points) with significant delay as compared to the direct wave. Theoretically absorption in the air is the function of temperature, humidity and distance (the way traveled by the wave) [5]. The efficient method of approximation has been presented in this publication [4]. As the room considered in this report is not large, the effect of sound wave absorption in the medium (air) has been disregarded.
MODELLING OF GREEN FUNCTION IN A RECTANGULAR ROOM ...
227
4.4. Computational model The computational model proposed may be characterized as follows: the input parameters of the room geometry, positions of the sound sources and reception points, characteristics of absorption of bounding surfaces and medium. The algorithm of the image sources „remembers" the paths of the subsequent reflections from the surface. For each reflection, the characteristics of the digital filter, corresponding to the characteristics of material absorption of the surface, is approximated. The filtration structure realizing the algorithm described is presented in the Fig. 8.
Fig. 8. Geometrical-filtration algorithm scheme.
The filter Mi , modelling the reflection and the filter Ai responsible for the absorption in the air is connected to each branch (corresponding to the way from the specific apparent source), while the branch corresponding to the way of the direct wave is equipped only with the filter responsible for the attenuation in the air A0 (z). Hence, following analyzing the distribution of the acoustic field and incorporating the history of each way (reflections) and replacing each reflection with the digital filter, the network of digital filters is obtained, whose structure in the general form is presented in the Fig. 4. The approximation of the Green function in the rectangular room searched for is obtained through the determination of the impulse response of the network of digital filters. 5. The result of computations and conclusions The geometrical-filtration model of the acoustic field is the promising method of testing acoustic fields. It combines the simplicity of geometrical methods with the technology of digital filters, allowing obtaining the continuous characteristics of changes, which the emitted signal is subject to along the route from the source to the receiver. The geometrical model applied allows analyzing not only the rectangular enclosure, but also rooms of other shapes. The rectangular room has been selected due to the possibility of
228
R. MARCZUK, L. MAJKUT
determining the analytical solution without the necessity of the recourse to numerical methods (the finite or boundary elements methods). The principal difficulty in the evaluation of the correctness of the model as compared to the analytic solution is the selection of the values of coefficient of attenuation for the restricting surfaces corresponding to one another (geometrical-filtration model) and the values of impedance, as the boundary conditions for the wave equation.
Fig. 9. Approximated (top) and analytical (bottom) Green function in rectangular room.
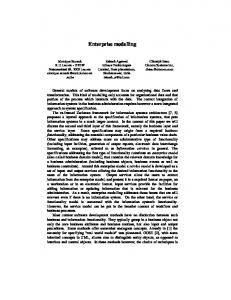
In the Fig. 9 are presented the impulse responses (Green functions) obtained respectively from the geometrical-filtration model (top) and from the solution of the wave equation (bottom). More accurate approximation is possible, when higher order images or reflections (beam acoustics) will be used.
MODELLING OF GREEN FUNCTION IN A RECTANGULAR ROOM ...
229
In the literature, the relations and allowing determining the question of absorption on the grounds of impedance may be encountered [8, 14]. The inverse relation, allowing estimating the impedance based upon the coefficient of absorption is not known. In this work, it has been proposed to incorporate the impedance in the form of the digital filter. The characteristics of the digital filter is shaped on the grounds of the values of reverberation coefficient of absorption (or perhaps reflection). For further testing, it seems necessary to develop the measuring database, containing the characteristics of reflections measured, e.g. in the form of the impulse response or transmittance. In the paper, the solution of the wave equation in the rectangular room has been presented, using the Green function (i.e. the impulse response). Based on this example, the Green function has been subject to modelling, with the application of the geometricalfiltration model. The geometrical methods used in this model allow hoping that the proposed method of modelling the Green function (impulse response) will find its application also for the rooms with irregular shapes. Acknowledgment The paper was presented at the Conference “Structures – Waves – Human Health”, Zakopane 2005. References [1] B ISTAFA S. R., M ORRISSEY J. W., Numerical solution of the acoustics eigenvalue equation in the rectangular room with arbitrary (uniform) wall impedances, Journal of Sound and Vibration, 263 (2003). ´ [2] B OCHENEK K., P LEBA NSKI J., The methods of microwave optics [in Polish], Archives of Electrotechnics, 5 (1956).
[3] G OŁA S´ A., W IERZBICKI J., Ł OPACZ H., Signal simulation based on convolution of room impulse response, 92nd AES Convention, Vienna 1992. [4] H UOPANIEMI J., S AVIOJA L., K ARJALAINEN M., Modeling of reflections and air absorption in acoustical spaces – a digital filter design approach, IEEE Workshop on Application of Signal Processing to Audio and Acoustics, New Paltzo, New York 1997. [5] M ALECKI I., Vibrations and waves [in Polish], PWN, Warszawa 1964. [6] M ARCZUK R., Discrete and continuous models of acoustic systems impulse response [in Polish], PhD. thesis, Akademia Górniczo-Hutnicza, Kraków 2001. [7] M ARKOVI C´ V., M ILOVANOVI C´ B., P RONI C´ O., Determination of complex resonant frequencies in rectangular and circular rooms, Applied Acoustics, 29 (2000). [8] M ORSE P. M., I NGARD K. U., Theoretical acoustics, McGraw-Hill Book Company, 1968. [9] Ł OPACZ H., Design of room impulse response models [in Polish], IX – Structural Acoustics & Mechanics for Enviromental Protection, Kraków – Zakopane 2000.
230
R. MARCZUK, L. MAJKUT
[10] Ł OPACZ H., M ARCZUK R., A new approach to the room impulse response simulation, Archives of Acoustics, 29 (2004). [11] O RFANIDIS S. J., Introduction to signal processing, Prentice Hall, England Cliffs, 1996. [12] S´ RODECKI K., Epidarus theather phenomena – preliminary test of acoustic properties [in Polish], Materiały OSA, Wrocław 1994. [13] W OROSZYŁ S., Basic solution methods of wave partial differential equations [in Polish], PWN, 1984. [14] Z IOMEK L. J., Fundamentals of acoustic field theory and space-time signal processing, CRC Press, 1994. [15] Raynoise – user’s manual, reference manual, examples manual, revision 2.1a, Numerical Integration Technologies. [16] Signal processing toolbox – user’s guide, MathWorks Inc.