Empirical Software Engineering, 6, 207±229, 2001. Ó 2001 Kluwer Academic Publishers. Manufactured in The Netherlands.
Modelling the Likelihood of Software Process Improvement: An Exploratory Study KHALED EL-EMAM
[email protected] National Research Council, Montreal Road, Bldg. M-50, Ottawa, Ontario, Canada K1A OR6 DENNIS GOLDENSON AND JAMES MCCURLEY
[email protected],
[email protected] Software Engineering Institute, Carnegie Mellon University, Pittsburgh, PA 15213-3890, USA JAMES HERBSLEB
[email protected] Software Production Research Department, Lucent Technologies, Naperville, IL, USA Abstract. Software process assessments have become big business worldwide. They can be a powerful tool for initiating and sustaining software process improvement (SPI). However, SPI programs sometimes fail. Moreover there still are very few systematic empirical investigations about the conditions under which SPI initiatives vary in their outcomes. In this paper we present the results of a study of factors that in¯uence the success of SPI. The data come from a sample survey of organizations that have performed assessments based on the capability maturity model for software, and was conducted from 1 to 3 years after the assessments (sucient time had passed for changes to have taken place). The results consist of a multivariate model of the conditions (e.g., how the improvement eorts are organized and funded) that can explain the successes and failures of SPI eorts. The model is constructed using a classi®cation tree algorithm. It identi®es the most important factors that aect the outcome of SPI eorts, and describes how those factors interact with each other to in¯uence success or failure. Keywords: Software process, software process improvement, software process assessment, subjective measurement, classi®cation trees, survey, SW-CMM
1. Introduction Software process improvement (SPI) has become big business worldwide. Based in part on roots in the total quality movement following World War II, the ®rst SEIassisted assessment was conducted by the Software Engineering Institute (SEI) in 1987 (Humphrey and Sweet, 1987). By now thousands of organizations have been formally assessed either as part of competitions for source selection and/or by internal initiatives to improve their own organizational process capabilities. Software process assessments can be a powerful tool for initiating and sustaining SPI. There is in fact a growing body of evidence that improving process capabilities can pay o substantially in product quality and business value (Deephouse et al., 1995±1996; El-Emam and Birk, 2000a, 2000b; Goldenson and Herbsleb, 1995; Goldenson et al., 1999; Herbsleb and Goldenson, 1996; Herbsleb et al., 1994; Herbsleb et al., 1997; Jones, 1999; Krasner, 1999; Lawlis et al., 1995).
208
EL-EMAM ET AL.
However, evidence also shows that SPI programs sometimes fail. Two previous empirical studies have systematically investigated the factors that aect the success of SPI eorts. The ®rst was a follow-up survey of organizations that have conducted capability maturity model (CMM)-based assessments Goldenson and Herbsleb, 1995; Herbsleb and Goldenson, 1996). The second was a follow-up study of organizations that have conducted assessments using the emerging ISO/IEC 15504 international standard (El-Emam et al., 1999). These previous studies were limited to bivariate analysis of the factors aecting SPI success. This means that potential interactions amongst the explanatory variables were not considered. An evaluation of interaction eects is important because this may substantially amplify prerequisites to success or failure that were not detectable in previous analyses, as well as leading to a more general model of critical success factors for SPI. In this paper we present an empirically derived model of the conditions (e.g., organization and funding of improvement eorts) that can explain the successes and failures of SPI eorts. The data set comes from a survey of organizations that have conducted CMM-based assessments (Goldenson and Herbsleb, 1995). In constructing the model we make a number of methodological and substantive contributions to the previous study in (Goldenson and Herbsleb, 1995), including that our model is multivariate, taking into account interactions, and we provide a prioritization of the factors that aect SPI success. The model is constructed using a classi®cation tree algorithm which identi®es the contribution of factors that aect the outcome of SPI eorts, and describes how those factors interact with each other to in¯uence success or failure. Brie¯y, our results indicate that the most important factor in distinguishing between success and failure of SPI eorts is the extent to which the organization is focused in its improvement eort, with clearly de®ned goals and consistent directions set by senior management. However we also found that the impact of this focus in SPI initiatives depends on how it is combined with organizational commitment to process improvement and with the existence of organizational politics. The implications of these results for SPI practitioners are that they provide actionable guidance on the most important issues that need to be managed during an SPI eort. This guidance consists of a prioritized list of factors aecting SPI success, and a model that identi®es how the most critical factors aect SPI success, and under what conditions. For researchers in this area, we provide an operational model of SPI success that can be further empirically tested and re®ned. Section 2 reviews previous work and describes the general model that we test during our study. In Section 3, we present our research method, including the source of the data and the analysis methods we use. This is followed in Section 4 with the detailed results and their interpretation. We conclude the paper in Section 5 by summarizing the analytical results and providing directions for future work.
AN EXPLORATORY STUDY
209
2. Background There is no shortage of expert opinion on how to ensure the success of an SPI eort (Fowler and Rifkin, 1990; Maher and Gremba, 1994; McFeelay, 1996; Miller and Goldenson, 1992; Stelzer and Mellis, 1998). A recent example of success factors for a budding SPI eort has been presented by Dion (Dion, 1999): · The need for ongoing sponsorship. · Clear and appropriate assignment of responsibility for SPI. · Appropriate infrastructure to support SPI (e.g., setting up a management steering group and an SEPG1). · Adequate funding. · Focusing on the needs of software projects. · Keeping the SPI eort simple. · Appropriate transition strategy to aect organisational change. · Planning and monitoring of the SPI eort. · Adequate and continuing SPI program justi®cation. While many of these factors have merit, it is as yet unclear which of these are the most important factors aecting SPI success, and how these factors interact to aect SPI success. It is through systematic empirical investigation that we can begin to identify the most important success factors and how they in¯uence the success of SPI eorts. 2.1. Previous Studies Two previous empirical studies have systematically investigated the factors that affect the success of SPI eorts.2 The ®rst was a follow-up survey of organizations that have conducted CMM-based assessments (Goldenson and Herbsleb, 1995; Herbsleb and Goldenson, 1996). The second was a follow-up study of organizations that have conducted assessments using the emerging ISO/IEC 15504 international standard (El-Emam et al., 1999). The CMM-based assessment study considered the relationship between a number of factors characterising the organisation and the SPI eort itself, and the organisation's success in process improvement. All of the relationships studied were bivariate. The factors that had a statistically signi®cant association with SPI success are summarized in Table 1. The second study also considered bivariate relationships only (El-Emam et al., 1999). It was conducted as a follow-up survey of organisations that performed assessments using the emerging ISO/IEC 15504 international standard. The analysis
210
EL-EMAM ET AL. Table 1. Factors that were found to be related to SPI success in (Goldenson and Herbsleb, 1995) based on statistical signi®cance criteria. Senior management monitoring of SPI Compensated SPI responsibilities SPI goals well understood Technical sta involved in SPI SPI people well respected Sta time/resources dedicated to process improvement Discouragement about SPI prospects SPI gets in the way of ``Real'' work ``Turf guarding'' inhibits SPI Existence of organizational politics Assessment recommendations too ambitious Need guidance about how to improve Need more mentoring and assistance
identi®ed factors directly aecting SPI success, and others that did so indirectly through another variable, namely the extent to which the SPI eort was determined by the ®ndings and the recommendations of the assessment. These are summarized in Table 2 and Table 3 respectively. Since the second study had a smaller scale than the ®rst (i.e., the sample size was smaller), it is not surprising that less variables were found to be statistically significant. While there is mostly consistency in the results of the two studies, there is also a marked inconsistency. The ``organizational politics'' and the ``ambitious recommendations'' variables are statistically signi®cant in both studies, but in the opposite direction. Speci®cally, in (El-Emam et al., 1999) it was found that increases in politics and ambitious recommendations were associated with greater SPI success, and the converse was found in (Goldenson and Herbsleb, 1995). There are two possible explanations for this, one substantive and one methodological. Table 2. Factors that were found to be directly related to SPI success in (El-Emam et al., 1999) based on statistical signi®cance criteria. Ensuring that SPI goals are well understood Technical sta involvement in SPI Creating process action teams Table 3. Factors that were found to be indirectly related to SPI success in (El-Emam et al., 1999) based on statistical signi®cance criteria. Senior management monitoring of SPI Compensated SPI responsibilities Sta and time resources being made available for SPI SPI people are well respected Organizational politics Ambitious recommendations from the assessment
AN EXPLORATORY STUDY
211
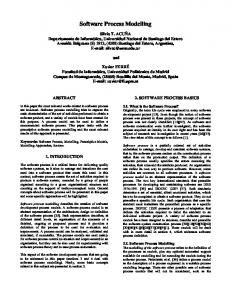
It is plausible that there was a cultural dierence between the organisations in both data sets (the second study was conducted mainly with European organisations, while the ®rst mainly with North American organisations). It was posited in (El-Emam et al., 1999) that organisational politics may prevent an organisation from straying too far beyond the ®ndings of an assessment, and hence ensuring that the assessment ®ndings are addressed. Furthermore, that the ambitious recommendations help to drive an organisation to work harder to address them, hence increasing the likelihood of SPI success. The methodological explanation is that there is an interaction amongst these variables and other variables that is not taken into account in a bivariate analysis. Hence a multivariate analysis may help to better understand the eects. The purpose of our study is therefore to perform a multivariate analysis of factors that aect SPI success. This would allow the identi®cation of interactions. In addition, some of the factors that were not found to be important in these previous studies may play an important role in such interactions. 2.2. Model Speci®cation The general model that we test is graphically represented in Figure 1. In this model, we hypothesize that there are two classes of independent variables that in¯uence SPI success: organizational factors and process factors. We also expect there to be interactions among the two classes of independent variables. Organizational factors are those variables that characterize the organization undergoing SPI, and the characteristics of the organizational SPI eort itself. The variables we selected for analysis are summarized in Table 4. These represent the types of organizational issues that are commonly recommended for ensuring a successful process improvement eort (Dion, 1999; Fowler and Rifkin, 1990; Maher and Gremba, 1994; McFeeley, 1996; Miller and Goldenson, 1992). Process factors comprise those variables that characterize activities or infrastructure that are believed to be necessary for a successful SPI eort. Process
Figure 1. Overall speci®cation of the model being tested.
212
EL-EMAM ET AL.
Table 4. Organization questions. The response categories for these questions were ``Substantial'', ``Moderate'', ``Some'', and ``Little if Any''. Variable
Question
ORG1 ORG2 ORG3 ORG4 ORG5
Are there tangible incentives or rewards for successful software process improvement? How much does ``turf guarding'' inhibit the progress of software process improvement? Is there much organizational politics? Does senior management actively monitor the progress of software process improvement? Is there a feeling among the technical sta that process improvement gets in the way of the real work? To what extent are process improvement goals clearly stated and well understood? How would you characterize the organization's sta time/resources dedicated to process improvement since the appraisal?3 Has there been turnover in key senior management? Has there been involvement of technical sta in the process improvement eort? Have the people who are involved in process improvement been respected for their technical and management knowledge, and their ability to get things done? Has there been clear, compensated assignment of responsibilities for process improvement? Has there been a major reorganization(s) or sta down-sizing? How much turnover has there been among middle management? How much turnover has there been among the technical sta?
ORG6 ORG7 ORG8 ORG9 ORG10 ORG11 ORG12 ORG13 ORG14
variables included in our analysis are summarized in Table 5. Explicit action planning (PROC1) is often said to provide a necessary basis for process improvement after an assessment (Puer, 1999). The establishment of a functioning SEPG (PROC3) is strongly recommended for ensuring that there is an infrastructure to support SPI (Fowler and Rifkin, 1990; McFeeley, 1996). It has also been suggested that having an SEPG in a parent organization supports the functioning of an SEPG in the organization being assessed (PROC4). 3. Research Method The data we use in our study were originally collected in a sample survey of organizations that conducted assessments based on the capability maturity model for Table 5. Process questions. These were stated in reference to the period since the assessment has been completed. The response categories for all questions were ``yes'' and ``no''. Variable
Question
PROC1
Did the organization that was assessed create an action plan for improving its software process based on the results of the assessment? Were Process Action Teams (PATs) or similar working groups established as a result of the assessment to address speci®c process improvements? Does the organization that was assessed have a software engineering process group (SEPG), or other unit(s) that performs similar functions? Does the parent organization of the organization that was assessed have a software engineering process group (SEPG), or other unit(s) that performs similar functions?
PROC2 PROC3 PROC4
AN EXPLORATORY STUDY
213
software (CMMÒ) (Goldenson and Herbsleb, 1995; Herbsleb and Goldenson, 1996). The original analysis relied largely on univariate and ®rst-order bivariate statistics. Here we construct a multivariate model that takes into account interactions among several explanatory factors. Such a multivariate model can provide additional insights into the factors aecting SPI success beyond the original univariate and bivariate results. Furthermore, in our current analysis we prioritize these factors in terms of their contributions to SPI success. 3.1. Data Source The survey took place 1±3 years after the assessments were conducted, allowing sucient time for changes to occur yet recent enough to expect accurate recall from the respondents. The organizations vary considerably in size and are from a wide variety of sectors and domains ranging from embedded military systems through commercial MIS. The sample was drawn in September 1994 from the SEI's Process Appraisal Information System (PAIS) database. At that time data were available on 155 assessments in the PAIS database which met the geographic and time criteria. These assessments were conducted in the USA and Canada during calendar years 1992 and 1993. As described more fully in (Goldenson and Herbsleb, 1995) not all of the original points of contact from the database were easily accessible, and obtaining individual contact information was sometimes dicult. However, there is no a priori reason to expect any bias in the sample of 61 appraisals that were selected. This sample constitutes slightly less than 40% of the assessments in the database. In particular, the assessments in the sample do not appear to be self-selected. Moreover, the survey respondents report widely varying degrees of success in their SPI eorts subsequent to their assessments. Even if the organizations included in our analysis are somehow more successful than others in their SPI eorts, there would have to be very substantial bias in the sample to invalidate our basic results. All told, we received completed questionnaires from 138 respondents (83% of those sent, representing 92% of the organizations that we sampled). 3.2. Roles of Respondents People who ®ll dierent roles in an organization may dier in their perspective about the same events. Hence we purposefully constructed the sample to include individuals who might be expected to dier as a result of their roles in the organization: (1) the project level software manager most knowledgeable about the appraisal; (2) the most knowledgeable and well-respected senior developer or similar technical person; (3) an organizational level SEPG manager, or someone with equivalent responsibilities for SPI.
214
EL-EMAM ET AL.
Contrary to our original expectations, we did not ®nd any consistent role dierences among the survey respondents. We found only two statistically signi®cant relationships (p < 0.05 using a v2 test) among all of the survey questionsÐfar fewer than would be expected by chance alone. We therefore consider that there are no role-speci®c dierences in the responses to the questionnaire. 3.3. Measurement Our independent variables were de®ned as shown in Table 4 and Table 5. We used a single survey question as the dependent variable for our analysis: ``How successfully have the ®ndings and recommendations of the assessment been addressed?'' The response categories were ``Little If Any'', ``Limited'', ``Moderate'', ``Substantial'', and ``Marked''. 3.4. Missing Data Imputation For most organizations in our data set, there were multiple responses. We cannot simply pool all of the 138 responses received and treat this as our data set for two reasons. First, the unit of analysis is the organization rather than the individual, so the analysis should be performed at the same unit about which we wish to draw conclusions. Second, pooling responses from dierent roles is inappropriate because doing so would give more weight to some organization's responses relative to the others (because there are more respondents from some organizations than others), and could therefore bias the results in their favor. Since there were no apparent dierences in response patterns among the three dierent roles (see (Goldenson and Herbsleb, 1995)), it would be possible to analyse the data by role (i.e., divide the data set into three dierent subsets). The above approach, however, presents a number of diculties. First, for some roles there are more responses than for other roles. Performing an analysis by role would result in quite small data sets for some of the role-speci®c subsets. Second, there existed missing values in this survey4 (as in most surveys). A complete-case analysis by each role would reduce our number of observations considerably (see (Little and Rubin, 1987) for a discussion of complete-case analysis). Both of these diculties can be considered as missing data problems. One approach that can be followed to deal with missing data is based on the hotdeck imputation strategy (Sande, 1983). Hot-deck imputation has been commonly used by the US Bureau of the Census and Statistics Canada to deal with missing data problems. The basic idea of the hot-deck is to ®nd a donor observation for each missing value. A donor observation without a missing value is identi®ed, and the missing value is imputed from the donor. There are multiple ways in which a donor can be identi®ed, but in our context it would be an observation from the same organization (i.e., another role).5 For example, if the response on a question for the
AN EXPLORATORY STUDY
215
SEPG manager is missing, then the response for the project manager is used. If multiple donors are identi®ed, then one is selected at random. In practice, an observation with missing values on multiple variables may have imputed values from multiple donors (i.e., more than one role). Hot-deck imputation, however, is based on the premise that the donor will also be used in the same analysis. This would imply that we are pooling the role-speci®c subsets. Since we are not doing so, an alternative strategy is employed. The method of ``®eld substitution'' (Chapman, 1983) reserves a number of units not originally selected for sampling to replace nonresponding units. This substitute unit should have similar characteristics to the nonresponding unit. When there are multiple potential substitutes, one is selected at random. In our case, the substitute would be a respondent from a dierent role within the same organization. Following this approach in our data set to impute missing items, the total number of organizations for which we have complete observations was 50.6 3.5. Data Analysis Methods We employ two dierent data analysis techniques: principal components analysis and classi®cation trees. Principal components analysis (PCA) (Kim and Mueller, 1978) is used to identify a reduced set of organizational components relative to the original set of variables. Intuitively, it would seem that some of these variables are measuring the same construct, and therefore should be combined into one composite dimension.7 PCA provides us a systematic way for performing this reduction. Note that we are following an exploratory strategy here, as opposed to a con®rmatory one since the speci®c dimensions are not speci®ed a priori. When using PCA, it is important to be able to interpret how ``good'' the obtained factor loadings are. Comrey (Comrey, 1973) provides some interpretation guidelines: 0.45 would be considered fair, more than 0.55 is good, those of 0.63 is very good, and those of 0.71 are excellent. We will use the 0.63 as the cuto value in our study given the moderate sample size and its exploratory nature. The algorithm that we used to construct classi®cation trees was CART (Classi®cation and Regression Trees) (Breiman et al., 1984). Constructing classi®cation trees with CART requires that the dependent variable be discrete. We therefore dichotomized the dependent variable around the median value, dierentiating between ``low'' success organizations and ``high'' success organizations. Classi®cation tree algorithms have a number of analytical advantages. First, they do not require a detailed speci®cation of the model to be tested beforehand, making them suitable for exploratory analysis. This is most appropriate in the formative stages of research where detailed and testable theories do not yet exist. Second, the tree is a visually interpretable structure, making the results more accessible to nonspecialists in data analysis. Third, the tree construction process takes into account potentially complex interactions among the independent variables. Fourth, it can easily accommodate categorical and continuous independent variables.
216
EL-EMAM ET AL.
The tree construction process starts o by building a large tree, and then proceeds to prune it from the bottom up for simpli®cation. The CART algorithm constructs binary trees. Tree-building involves the recursive partitioning of the data set. A splitting criterion is used to decide on which independent variable to split and where to make the split in the case of continuous independent variables. An exhaustive search for a ``good'' split is performed. For example, for a k value ordered categorical variable (which all our independent variables are), there are k 1 possible positions to make a split. There are a number of dierent ways in which the ``goodness'' of a split can be judged. In practice, the literature suggests that not much dierence exists between the commonly used splitting criteria in terms of the accuracy of the tree that is constructed (Breiman et al., 1984; Mingers, 1989). The splitting criterion we use is the Gini measure of node impurity (Breiman et al., 1984). The Gini measure reaches a value of zero when only one dependent variable class is present at a node. This measure is computed as the sum of products of all pairs of class proportions for classes present at the node. It reaches its maximum value when class sizes at the node are equal. Tree construction stops when a minimal number of observations in a terminal node has been reached. 8 In the present analysis, we set this minimal number at 5. Pruning starts when all terminal nodes satisfy this criterion. During pruning, trees are generated by removing splits upward until the tree with only a root node is formed. The optimal tree can be selected from this sequence of trees. An initial choice of an optimal tree is often the one that has the highest crossvalidation accuracy (we use threefold cross-validation). However, the accuracy estimate has some uncertainty associated with it. Therefore, the optimal tree is the smallest tree (with the smallest number of terminal nodes) that is within one standard error of the smallest misclassi®cation rate9 (this is also referred to as the SE rule). This approach results in a tradeo between tree accuracy and tree complexity. After a tree is constructed, it has to be judged whether it is good or bad. A commonly used criterion for evaluating a classi®cation model is it's overall classi®cation accuracy (e.g., see Lanubile and Visaggio, 1997; Schneidewind, 1994). Consider the matrix in Table 6 which is commonly used to tabulate the classi®cation results for a binary classi®er. The classi®cation accuracy is de®ned as: n11 n22 N
1
A number of dierent approaches can be used for estimating classi®cation accuracy. The easiest method is to use the resubstitution estimate, whereby the accuracy of the tree is evaluated using the same data set that was used to construct it. This technique, however, is known to be an optimistic estimate of accuracy on unseen cases (Weiss and Kulikowski, 1991). However, one can argue that it is a measure of the tree's ``goodness of ®t'', in much the same manner as an R2 value in an ordinary least
217
AN EXPLORATORY STUDY Table 6. Notation for a matrix that shows the predicted versus the actual classi®cations. The same matrix would be used whether the estimation approach was resubstitution or cross-validation. Actual success
Low High
Predicted success Low
High
n11 n21
n12 n22
N1 N2
N1
N2
N
squares regression model. For estimating accuracy on unseen cases, the approach that we use is a threefold cross-validation.10 Here, we split the sample into three disjoint subsamples. Two of these subsamples are used as a training set, with the third as the test set. Accuracy is calculated by classifying the observations in the test set. This is repeated by making each of the subsamples a test set, and the average accuracy across all test sets is used as the overall tree accuracy.
4. Results 4.1. Descriptive Summary The survey respondents represent a variety of software organizations. The largest single proportion (37%) are from organizations that do contract work for the US federal government. Another 22% are from the federal government and US military services. Firms selling in the commercial market are the second largest category (36%) of software organizations represented by our respondents. Another 5% fall into the ``other'' category. The organizations represented in our sample vary considerably in size. Approximately one-third of the survey respondents say they come from organizations that have 200 or more software employees. Another third come from organizations that employ 70 or fewer people who are primarily engaged in software. Firms selling products in the commercial market are smaller than those in the military and federal government; 43% of the commercial organizations have 70 or fewer software employees as opposed to only 14% of the government organizations. The government contractors vary more in size; 40% have 200 or more software employees, while 34% have 70 or fewer. The survey respondents were roughly evenly distributed among the roles that were sampled: 31% are members of an SEPG and other process champions; approximately 34% are software managers and 34% are senior technical people. One person ®lled both the management and SEPG roles concurrently. The respondents have a considerable amount of software experience. Half of them have worked on software for 16 years or more; a quarter of them have worked in the
218
EL-EMAM ET AL.
®eld for 22 or more years. All but the least experienced 10% of our respondents have worked on software for 10 years or more. 4.2. Dimensions of Organizational Factors The results of the PCA are shown in Table 7. Note that for the results in this table all the variables within each factor were coded so that they are pointing in the same direction (i.e., higher score on each variable means a higher score on the factor). The emergent factor structure is quite easily interpretable. We used a loading of 0.63 as a cuto point (see Section 3.5.). Before going into the details of each of the factors, it is worthwhile to note that variable ORG12 (the occurrence of major reorganization(s) or sta down-sizing) was removed from further analysis since it seemed to relate to a number of factors and its interpretation was not obvious. Although the variable ORG9 did not load on one dominant factor, we retained this variable since a recent study identi®ed it as an important determinant of SPI success (El-Emam et al., 1999). We termed this variable ``INVOLVEMENT'' since it captures the involvement of the technical sta in SPI. The remaining variables fall into one of the ®ve components, and are interpreted below. We used the emergent factors to construct composite variables. A composite was calculated as an unweighted sum of each of its component variables. This is a commonly used approach when working with subjective scales (Spector, 1992). For Table 7. Results of the PCA with rotation for the ``organization'' type variables.
ORG1 ORG2 ORG3 ORG4 ORG5 ORG6 ORG7 ORG8 ORG9 ORG10 ORG11 ORG12 ORG13 ORG14
Factor 1
Factor 2
Factor 3
Factor 4
Factor 5
0.73 0.19 0.09 0.74 0.07 0.44 0.63 0.14 0.35 0.21 0.69 0.25 0.09 0.00
0.02 0.06 0.16 0.00 0.07 0.18 0.36 0.20 0.15 0.09 0.34 0.45 0.79 0.87
0.06 0.86 0.81 0.12 0.46 0.04 0.01 0.02 0.40 0.18 0.33 0.21 0.25 0.10
0.02 0.08 0.02 0.24 0.11 0.26 0.26 0.18 0.38 0.77 0.37 0.53 0.12 0.12
0.03 0.005 0.14 0.18 0.64 0.68 0.17 0.75 0.29 0.12 0.01 0.29 0.12 0.05
Approximately 67% of the variation is explained by these ®ve components. This is a reasonable value given the exploratory nature of this study. The criterion for factor extraction was to stop when the eigenvalue went below one. This is the most common approach for deciding on the number of factors (Kim and Mueller, 1978). The coding scheme for all variables was 1 for the lowest values and 4 for the highest values.
AN EXPLORATORY STUDY
219
each composite scale we calculate its Cronbach a coecient (Cronbach, 1951), a measure commonly used to evaluate the reliability of subjective measurement scales (Carmines and Zeller, 1979). The coecient can vary from 0 to 1 where 1 is perfect reliability and 0 is maximum unreliability. Nunnally has suggested that for the early stages of research a Cronbach a coecient approaching 0.7 is acceptable (Nunnally, 1978). Given that we are at a formative stage in developing SPI theories, and as noted earlier our study was exploratory in nature, it would seem reasonable to use this as a general guideline to judge the reliability of the composite variables.11 Below is our interpretation of each of the ®ve factors that were identi®ed. 4.2.1. Factor 1: Commitment The ®rst factor is termed ``Commitment''. All the variables are concerned with the extent to which resources are made available for SPI and management's interest in SPI. These are considered as indicators of commitment to SPI. This four item measure of commitment had a Cronbach a coecient of 0.718. The ®nal composite variable was constructed to have higher values when commitment is high, and has a range from 4 to 16. 4.2.2. Factor 2: Turnover The two questions that make up this variable concern the turnover at the middle management and technical levels within the organization. Note that turnover in senior management (variable ORG8) does not load on the same factor, and seems to be measuring a dierent construct. The Cronbach a coecient for this two item variable is 0.65. Even though this number is not high, it is actually quite good for a variable consisting of only two items. The ®nal composite variable was constructed to have high values when turnover is high, and has a range from 2 to 8. Thus, for example, for turnover to have the maximum value, there would have to be ``substantial'' turnover in middle management and the technical sta. 4.2.3. Factor 3: Politics The third factor is clearly measuring an underlying construct of ``Politics''. This is a general label for politically motivated activities and incentives that may promote or hinder SPI within an organization. The Cronbach a coecient for this two item variable was 0.732. The composite variable was constructed to have high values the more politics, and has a range from 2 to 8. 4.2.4. Factor 4: Respect The fourth factor consists of a single item, and has been labeled ``RESPECT''. This measures the extent to which individuals involved in SPI are respected within the
220
EL-EMAM ET AL.
organization. This variable was coded to have higher values the greater the respect, and has a range from 1 to 4. 4.2.5. Factor 5: Focus The ®nal factor measures the extent to which the organization is focused in its SPI eorts. Turnover in senior management detracts from this because new management often imposes new directions for the organization as a whole, with consequent eects on ongoing improvement initiatives. If sta feel that improvement initiatives (or the current one speci®cally) get in the way of the ``real'' work then the process improvement will be sacri®ced when pressure builds up (e.g., deadlines). Finally, an organization cannot be focused in its SPI eort if its improvement goals are not clearly stated and understood. The Cronbach a coecient for this variable was 0.62. The composite scale was coded so that higher values indicate greater focus, and has a range from 3 to 12. 4.3. Dependent Variable Figure 2 shows the overall distribution of the dependent variable. As can be seen, the median value is ``moderate'', and the modal response is ``limited'' success. Values at ``moderate'' or below are classi®ed in the ``Low'' category; responses of ``substantial'' or ``marked throughout the organization'' are classi®ed in the ``high'' success category. 4.4. Classi®cation Tree The ®nal tree is shown in Figure 3. We ®rst present the accuracy results, and then interpret the tree. 4.4.1. Accuracy The goodness of ®t criterion (i.e., the resubstitution estimate of accuracy) for this tree was 92%, indicating a very good ®t to the data. However, this is an optimistic estimate of accuracy on unseen cases. There are two ways in which we can calculate the cross-validation estimate of accuracy. The ®rst approach is a ``global'' cross-validation whereby the entire analysis is replicated three times, each time with one-third of the data set used as a test set. However, during each of these replications, these two-thirds of the data set are again split into three samples, and now only approximately 44% of the whole sample is used for constructing each of the trees that CART chooses from. With such small numbers, it is hardly surprising that not many trees are actually constructed and therefore the tree with the root node predominates. The tree with only a root node has an accuracy of 76%, which matches the base rate of 76% of organizations having ``Low'' SPI success. Hence this approach does not provide a reasonable estimate of the accuracy of the tree on unseen cases.
AN EXPLORATORY STUDY
221
Figure 2. Distribution of the dependent variable ``SPI success''.
Figure 3. The CART generated classi®cation tree. The number within each node is the predicted class (0 is LOW, and 1 is HIGH). The predicted class is the most frequent one within the node. The numbers on the edges are the number of observations. If the condition at a nonterminal node is true, then take the path on the left. The percentages next to each terminal node are the resubstitution estimates of accuracy for that particular terminal node.
222
EL-EMAM ET AL.
The second approach uses the cross-validation estimate for the tree that was selected. As noted earlier, CART constructs many trees and then selects the best one. For selection of the best tree, the cross-validation estimate for each tree is used. This estimate for our tree is 84% accuracy. This too is quite high, and is a marked improvement over the chance probability of getting 50% correct classi®cations and the 76% base rate. 4.4.2. Interpretation The decision tree in Figure 3 contains three variables: FOCUS, POLITICS, and COMMITMENT. Below each nonterminal node is a condition. For example, below the root node the condition is ``FOCUS