Sep 25, 1999 - slaughtered at various ages to obtain parameter estimates for ... comparative slaughter technique, which requires ... Slough, England. Bikker, P.
Animal Science 2000, 71: 119-130 © 2000 British Society of Animal Science
1357-7298/00/97000119$20·00
Modelling the relation between energy intake and protein and lipid deposition in growing pigs J. van Milgen, N. Quiniou† and J. Noblet Unité Mixte de Recherches sur le Veau et le Porc, Institut National de la Recherche Agronomique, 35590 Saint-Gilles, France † Present address: Institut Technique du Porc, BP 3, 35651 Le Rheu cedex, France
Abstract When modelling the effect of a changing nutrient supply to growing animals, it is important to distinguish the individual response curve of an animal from the change in this response that may occur during growth. A data analysis model is proposed where, for an individual animal, the relation between protein deposition (PD) and metabolizable energy (ME) intake above maintenance (MEp) is curvilinear, so that PD intersects the origin and reaches its maximum at the maximum protein deposition rate (PDmax). An increase of MEp beyond that required to attain PDmax would not change PD. The MEp not used for protein synthesis can be used for lipid deposition (LD). The relation between PD and LD on the one hand and ME on the other hand can then be described as a function of the maintenance energy requirement (MEm), PDmax, the level of ME required to attain PDmax (F; as a multiple of MEm) and the energetic efficiencies of PD (kp) and LD (kf). Of these statistics, only kp and kf were assumed to be independent of body weight (BW), age or genotype. Variation in PDmax was described as a Gompertz function (of age) whereas variation in F was assumed a linear function of BW. Maintenance energy requirement was expressed as a power function of BW. To evaluate the model, 145 nitrogen and energy (indirect calorimetry) balances were obtained from three types of pigs (Large White castrated males (cLW) and Piétrain ✕ Large White castrated males (cPP✕) and males (bPP✕)) ranging in BW between 45 and 100 kg and housed under thermoneutral conditions. Animals were allotted to one of four energy levels ranging from 0·70 to 1·00 of ad libitum intake. The MEm was not different between genotypes (849 kJ/kg BW0·60) whereas the kp and kf were 0·56 and 0·75, respectively. For castrated animals on ad libitum intake, PDmax started limiting PD at approximately 130 days of age (78 and 86 kg BW for cLW and cPP✕, respectively). Before this age and for bPP✕, PD was limited by MEp. In bPP✕, the difference between PD and PDmax was small (less than proportionately 0·05). The F did not change with BW for bPP✕ (2·85 ✕ MEm) whereas for the other genotypes, it decreased linearly from 4·47 at 45 kg to 2·00 at 100 kg of BW. Due to its nature, the model allows estimation of PDmax even when energy is restricting PD. Keywords: energy, growth, mathematical modelling, pigs, protein.
Introduction
an upper limit to protein deposition (PDmax), which is influenced by factors such as the genetic capacity for growth or environmental conditions. Different nutritional conditions (e.g. a limiting supply of protein or energy) can be imposed that result in a PD lower than PDmax.
The nutrition of the animal can have an important impact on carcass composition through the distribution of nutrients between lipid (LD) and protein deposition (PD). To quantify these effects, several mathematical models have been developed (Whittemore and Fawcett, 1974; Black et al., 1986; Moughan et al., 1987; Pomar et al., 1991; de Lange, 1995). These models often presume the existence of
The relation between PD and ME intake above maintenance (MEp = ME – MEm, where MEm is the energy requirement for maintenance) has often been 119
120
Van Milgen, Quiniou and Noblet
represented as a linear-plateau model (Whittemore and Fawcett, 1974; Black et al., 1986; Campbell and Taverner, 1988; Quiniou et al., 1995). During the linear phase, PD is determined by MEp whereas the plateau represents PDmax. Extrapolation of results to MEp = 0 (i.e. ME = MEm) often suggests a positive PD and negative LD. By definition, there is no net gain or loss of energy at MEm intake and the ME intake equals the energy (heat) production. Although it is theoretically possible that an animal deposits protein at the expense of lipid at MEm, this can only occur if the efficiencies of protein deposition and lipid catabolism equal unity (van Milgen and Noblet, 1999). Although this probably illustrates the limitations of the concept of maintenance for growing animals, no suitable alternatives are currently available. Because a theory based on maintenance is difficult to combine with non-zero intercepts for PD and LD in a linear-plateau model, van Milgen and Noblet (1999) suggested the use of curvilinear models for PD and LD that intersect the origin at MEm. Although the instantaneous response of an animal may be described by one of the concepts described above, the parameters of the response curve may change during the growing and finishing period of pigs. For example, MEm is often described as a power function of BW and also PDmax may change with BW or age. To distinguish the instantaneous response curve of an animal from the change in the response that may occur with a changing BW or age, it is important that the interval of measurement of PD and LD is as short as possible. Given a theory of maintenance energy requirement, the linear-plateau model may not be the best model to represent the instantaneous response curve of PD (and LD) as a function of MEp. The goal of this study is to propose an alternative data analysis model for the response of an individual animal to a changing energy supply and to account for the changes in this response that may occur during growth.
Material and methods Experimental data Data for this experiment were partly those reported by Quiniou et al. (1995 and 1996). In those experiments, 241 nitrogen (N) balances were determined whereas energy balances were estimated from a sub-population of animals (145 energy balances). The results used in the present study only concern the N and energy balances of individual animals in the sub-population.
In short, the effect of energy intake on PD and LD was studied in 20 Large White castrated males (cLW), 20 Piétrain ✕ Large White castrated males (cPP✕) and 21 Piétrain ✕ Large White males (bPP✕) ranging in BW between 45 and 100 kg. For each type of pig, five blocks of five to six littermates were moved to individual pens at 24 kg of BW and maintained at 23°C. They were given free access to a diet containing wheat, barley, soya-bean meal, maize and maize starch. Four littermates from each block of cLW, cPP✕ and bPP✕ were moved to digestibility cages at 38, 42, and 35 kg of BW, respectively. Each animal was randomly allotted to one of four energy levels representing approximately 0·70, 0·80, 0·90 and 1·00 of ad libitum food intake. Food allowance (within littermates) was calculated according the food intake of the pigs offered food ad libitum. In order to change the energy supply without changing the crude protein supply, maize starch was added to a basal diet (based on wheat, barley, soya-bean meal and maize). The minimum crude protein content was 194 g/kg dry matter (DM) for cLW on ad libitum intake whereas the maximum crude protein content was 299 g/kg DM for bPP✕ on 0·70 of ad libitum. Details of the composition of the diet were given by Quiniou et al. (1996). A total of 145 N and energy balances (42 cLW, 54 cPP✕, and 49 bPP✕) were obtained at four different stages of growth (48, 64, 79, and 94 kg of mean BW). The N balances lasted 10 to 11 days and included a correction for gaseous N losses. Energy balances (open-circuit, indirect calorimetry) were measured over 3 to 4 days during the N balance period and extrapolated for the whole balance period. The instantaneous response curve Van Milgen and Noblet (1999) proposed a model in which, in contrast to the factorial approach, PD and LD were seen as the result of variation in ad libitum ME intake. This results in two simultaneous equations (one for PD and one for LD) and requires an hypothesis concerning the fraction of the ad libitum supply of MEp designated toward protein synthesis (X; ranging between 0 and 1); the remainder (1-X) is designated toward lipid synthesis. The PD and LD (MJ/day) for a pig on ad libitum intake are then: PD = kp X (ME – MEm) LD = kf (1 – X) (ME – MEm)
(1)
where kp and kf are the energetic efficiencies of protein and lipid deposition, respectively. It is assumed that at maintenance energy intake level, no protein or lipid will be deposited or lost. Both X and MEm may change with BW and genotype, whereas kp and kf can be affected by the nutrient source.
121
Modelling protein and lipid deposition in growing pigs If one accepts the hypothesis of a genetic or environmental upper limit to PD, it may be possible that some of the pigs on ad libitum intake in the experiment of van Milgen and Noblet (1999) were limited by PDmax and not by ME intake. In those animals, it would have been possible to reduce MEp without affecting PD up to the point where energy starts limiting PD. The concept of fractionation of MEp may still hold but X should then depend on the MEp supply. The simplest hypothesis is to assume that X depends linearly on MEp up to the point where PDmax starts limiting PD. In other words, the fraction of MEp designated toward PD is maximal at low intake levels and lowest at ad libitum intake. Replacing X in equation 1 by a linear function of MEp results in a quadratic relation between PD (and LD) and MEp up to the point where factors other than MEp limit PD. It is assumed that once the quadratic relation reaches a maximum (PDmax), it will continue at that maximum so that a further increase in MEp does not affect PD. Two parameters are required to describe the linear change in X due to a change in MEp. To simplify interpretation, these two parameters can be replaced by PDmax and the
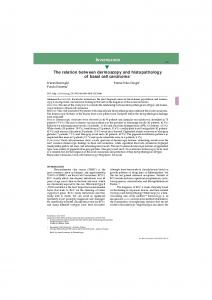
level of ME intake to attain PDmax (F; as a multiple of MEm). This derivation is given in the Appendix. Thus, the instantaneous PD and LD responses to a change in ME intake are determined by kp, kf, MEm, PDmax and F (equations A4, A5, and A6). A numerical example of the concept put forth above is given in Figure 1. At MEm intake level, neither protein nor lipid is deposited and proportionately 0·85 of MEp would have been designated toward PD (although MEp = 0). With increasing ME intake, X decreases linearly up to an intake level of 2 ✕ MEm (F). At this intake level, PDmax (137 g/day) is reached. Increasing the ME intake beyond F will not change PD and only increases LD (the slope for LD then equals kf). At 2 ✕ MEm, only 0·43 of MEp is designated toward PD, after which it declines asymptotically with increasing ME intake. The changing response curve Several variables in the model describing the instantaneous response are likely to vary with genotype, BW or age. The MEm was supposed to vary with BW and genotype according to:
200
1·00
180 160
0·80 PD PDmax
120
0·60
100
X
Deposition (g/day)
140
80
0·40
60 LD 40
0·20
20
F 0·00
0 1·0
1·2
1·4
1·6
1·8
2·0
2·2
2·4
2·6
2·8
ME intake (as a multiple of MEm) Figure 1 Conceptual model of the response of an individual animal to a changing energy supply. PD: protein deposition; LD: lipid deposition; PDmax: upper limit to protein deposition; F: level of energy intake (as a multiple of the maintenance energy requirement) to reach PDmax; X: fraction of metabolizable energy (ME) intake above maintenance designated toward PD.
122
Van Milgen, Quiniou and Noblet MEm = aBWb
(2)
where a is the maintenance ME requirement for a group of animals (kJ/kg BWb per day) and b is a constant. Also F was supposed to vary with BW so that for each genotype: F = F100 + dF (100-BW)
(3)
where F100 is the ME intake (as a multiple of MEm) required to attain PDmax at 100 kg of BW, and dF is the change in F due to a change in BW (per kg). The PDmax reflects the potential of the animal to deposit protein in the absence of nutritional constraints. Although different relationships can be proposed to describe PDmax, it should, at least theoretically, approach zero when animals reach maturity. Protein deposition is the difference between protein synthesis and degradation. Simple models of protein metabolism (e.g. Danfær, 1991) often describe protein synthesis by saturation kinetics (i.e. driven by nutrients) whereas protein degradation is described by mass-action kinetics (i.e. protein degradation is proportional to the protein pool size). Both the fractional rates of protein synthesis and degradation decline with age (Riis, 1983). Lovatto and Sauvant (1999) modelled this decline as an exponential function of age (time). If it is assumed that also the fractional rate of PDmax declines exponentially with age, a Gompertz function for the potential protein mass is implied. The Gompertz function is often parameterized to include the (potential) protein mass at maturity, the initial (potential) protein mass, and a parameter describing the shape of Gompertz function (Ferguson and Gous, 1993a; Whittemore, 1995; Emmans and Kyriazakis, 1997). Because in this study, growth rather than mass was measured and the final observation at 100 kg is far from maturity, the Gompertz function was parameterized to include the PDmax at 100 days of age (PDmax100; MJ/day) and 150 days of age (PDmax150; MJ/day) as well the shape parameter (B). The equation and its derivation are given in the Appendix. Statistical analyses The equations for MEm (equation 2), F (equation 3), and PDmax (equation A8) were substituted in equations A4, A5 and A6. For a given group of pigs (cLW, cPP✕, or bPP✕), the data analysis model includes two response variables (PD and LD), three independent variables (ME intake, BW, and age) and nine parameters, three of which (kp, kf, and b) were a priori assumed constant across groups. The other six parameters (PDmax100, PDmax150, B, F100, dF, and a) may be specific for each group of animals.
The data were analysed using a weighted, multivariate (i.e. PD and LD) non-linear regression procedure (van Milgen and Noblet, 1999) using the NLIN procedure of Statistical Analysis Systems Institute (1989). Bootstrap estimates of the parameters and their standard deviations were obtained as indicated by Neter et al. (1996). Hypotheses concerning group effects on the six parameters mentioned above were tested using the extra sum of squares principle (Ratkowsky, 1983). The ME intake for pigs on ad libitum intake was analysed as an asymptotic function of BW. The predicted ME intake at 50 and 100 kg of BW were used to parameterize the model (van Milgen and Noblet, 1999). In the model, the units of calculating PD and LD were MJ/day. To facilitate interpretation, most results will be reported as g/day by assuming 23·7 kJ/g protein and 39·6 kJ/g lipid (Agricultural Research Council (ARC), 1981).
Results A summary of the main results of the experiment can be found in Table 6 of Quiniou et al. (1996). As the experiment started at about 45 kg of BW, the effect of energy level on age was only marginal at stage 1. However, this effect became more pronounced at higher BW as pigs on restricted intake were 25 to 30 days older at 94 kg BW (stage 4). Protein deposition increased with increasing energy level and ranged from 101 g/day (restricted cLW in stage 1) to 208 g/ day (ad libitum bPP✕). Lipid deposition was lower in bPP✕ than in castrated males (cLW and cPP✕) and
Table 1 Bootstrap estimates and standard errors (in brackets)† describing the effect of body weight on metabolizable energy (ME) intake in growing pigs given food ad libitum (residual s.d. = 11·4% of ME intake) Group‡
ME50 (MJ/day)
ME100 (MJ/day)
cLW cPP✕ bPP✕
28·9 (1·5) 28·8 (1·5) 24·2 (0·9)
38·1 (3·3) 33·1 (1·9) 32·9 (2·8)
† Using the asymptotic model: ME50 (1 – [(ME100/ME50) – 1](BW/50)) ME = ————————————————, 2 – ME100/ME50 where ME50 is the ad libitum intake at 50 kg of BW and ME100 is the ad libitum intake at 100 kg of BW. ‡ cLW: Large White castrated males; cPP✕: Piétrain ✕ Large White castrated males; bPP✕: Piétrain ✕ Large White boars.
123
Modelling protein and lipid deposition in growing pigs
Table 2 Bootstrap parameter estimates and standard errors (in brackets) for the full model† (residual s.d.: PD 329 kJ/day; LD 741 kJ/ day)
Group‡
MEm (kJ/kg BW0·643 per day)
cLW cPP✕ bPP✕
707 (170) 692 (174) 694 (180)
b
}
PD PD max100 max150 (g/day) (g/day)
B
F100
dF (per kg)
kp
kf
}
}
183 (15) 134 (4) 0·0094 (0·0045) 1·69 (0·53) 0·0510 (0·0180) 0·643 (0·053) 188 (13) 156 (10) 0·0105 (0·0041) 2·57 (0·39) 0·0387 (0·0132) 0·520 (0·055) 0·756 (0·026) 196 (7) 175 (9) 0·0126 (0·0021) 2·77 (0·23) 0·0111 (0·0074)
† See text and Appendix for details. MEm: maintenance energy requirement; b: exponent relating BW to the maintenance energy requirement; PDmax100: upper limit to protein deposition at 100 days of age; PDmax150: upper limit to protein deposition at 150 days of age; B: shape parameter of the Gompertz function; F100: energy level (as multiples of MEm) to attain PDmax at 100 kg BW; dF: change in the energy level (as multiples of MEm) to attain PDmax due to a change in BW; kp: energetic efficiency of protein deposition; kf: energetic efficiency of lipid deposition. ‡ cLW: Large White castrated males; cPP✕: Piétrain ✕ Large White castrated males; bPP✕: Piétrain ✕ Large White boars.
ranged from 34 g/day (restricted bPP✕) to 352 g/ day (ad libitum cLW). Parameter estimates of the model that describe ME intake for pigs on ad libitum intake in this experiment are given in Table 1. The ME intake for the castrated males was similar at 50 kg BW (28·9 MJ/day) but cLW had a much higher intake than cPP✕ at 100 kg BW. In contrast, cPP✕ consumed more than bPP✕ at 50 kg BW but consumed similar amounts at 100 kg BW (33·0 MJ/day). Parameter estimates and standard errors for the full model are given in Table 2 whereas those for the reduced model (i.e., after testing the effect of genotype) are given in Table 3. The residual standard deviation was about 2·2 times higher for LD than for PD. Consequently, a statistical weighting scheme (for PD and LD) was adopted so that the weight was inversely proportional to the residual variation. Maintenance energy requirement was expressed as a power function of BW and the exponent was not different from 0·6 (P > 0·05). Moreover, the MEm did not differ significantly (P > 0·05) between the three groups of animals and averaged 849 kJ/kg BW0·60 per day.
The hypothesis of a constant PDmax was rejected (P < 0·001) indicating that PDmax varied with age. There was no difference (P > 0·05) in the scale parameters of the Gompertz function (PDmax100, PDmax150) for the two groups of castrated males (Tables 2 and 3). Moreover, the shape parameter (B) was not different for any group of pigs. The parameter estimates of the Gompertz function can be used to calculate intermediate values for PDmax that are within the range of observations. For the castrated groups of pigs, PDmax declined from 191 g/day at 100 days of age to 112 g/day at 180 days of age. For bPP✕, there was little difference in PDmax between the first observation (177 g/day at 82 days of age) and the last one (175 g/day at 160 days of age). Nevertheless, the PDmax reached a maximum (196 g/day at 117 days of age). The level of energy intake required to attain PDmax did not change with BW for bPP✕ (F = 2·85). At 100 kg of BW, the castrated groups required an intake level of 2·00 ✕ MEm to reach PDmax but this level increased considerably with decreasing BW (dF in Table 3). At 45 kg BW, castrated males had to consume 4·47 ✕ MEm in order to attain PDmax, which was beyond their food intake capacity.
Table 3 Bootstrap parameter estimates and standard errors (in brackets) for the reduced model† (residual s.d.: PD 335 kJ/day; LD 734 kJ/day) MEm (kJ/kg BW0·60 per day)
Group‡ cLW cPP✕ bPP✕
}
849 (22)
PD max100 (g/day)
}
†‡ See Table 2 footnotes.
191 (5)
PD max150 (g/day)
}
143 (4) 182 (8)
B
}
0·0115 (0·0020)
F100
dF (per kg)
kp
}
} 2·00 (0·30) } 0·0449 (0·0079) 0·560 (0·023) 2·85 (0·15) 0
kf
}
0·748 (0·014)
124
Van Milgen, Quiniou and Noblet animals, it is assumed that MEm does not vary with ME intake. However, the fasting heat production (an indicator for MEm) is affected by the level of food intake implying that MEm is not constant (Koong et al., 1982). To our knowledge, there are no data available where young, non-mature animals are actually supplied food at MEm intake level. Although there are studies where animals have been kept at constant BW (Kolstad and Vangen, 1996), this does not assure maintaining an energetic equilibrium.
dPD/dME (g/MJ)
6·0 5·0 4·0 3·0 2·0 1·0 0·0
40
50
60
70
80
90
100
BW (kg) Figure 2 The effect of body weight (BW) on the marginal protein deposition response to a changing energy supply (dPD/dME) in ad libitum fed growing Large White castrated males ( ), Piétrain ✕ Large White castrated males ( ) and Piétrain ✕ Large White males ( ).
The model described by equations A4 and A5 yields the PD response of an individual animal to a change in MEp. The first derivative of this function gives the instantaneous marginal response of PD to MEp (dPD/dME). For ME intake greater than F ✕ MEm, the marginal PD response equals zero (i.e. PD = PDmax) whereas the marginal LD response equals kf. In such a situation, a leaner animal may be obtained by restricting food intake (or reducing the energy content of the diet). The marginal PD response for pigs on ad libitum intake as a function of BW can therefore indicate the point at which food restriction may become important (Figure 2). There was more variation in the marginal PD response for the castrated pigs than for bPP✕. The PDmax in pigs on ad libitum intake was attained at 130 days of age for cLW (78 kg BW) and at 134 days of age for cPP✕ (86 kg BW). Beyond this point, additional ME intake only increases LD (18·9 g LD per MJ ME). In contrast, bPP✕ were never able to consume sufficient ME to attain PDmax, even though the marginal response was low (dPD/dME < 3·5 g PD per MJ ME).
In the present study, it was also assumed that there is no gain or loss of protein or lipid at maintenance energy intake level. However, there are indications that animals, given food at MEm, may deposit protein at the expense of lipid. Le Dividich et al. (1980) found that immediately after weaning, piglets could still maintain a positive PD while in negative energy balance. Previously, van Milgen and Noblet (1999) suggested that energy transformations at zero energy balance could occur only if the efficiencies of transformation would equal unity. It appears that these efficiencies can be different from unity, although this has implications for the way MEm should be interpreted. Figure 3 gives a numerical example of such a situation. In this example, 10 units of lipid are catabolized to yield eight units of protein (i.e. the efficiency of lipid transformation equals 8/ 10). To maintain a zero energy balance, also 10 units of protein need to be deposited, two of which come from the diet (efficiency = 2/3). As 100 units enter the system, this implies that the MEm requirement is 97. In other words, the MEm is lower than the energy
MEm
97
97 100
MERE0
2
protein 8
Discussion Model assumptions In modelling growth in pigs, research has focussed on the PD and LD responses to changing supplies of energy, protein and individual amino acids. The current study only concerns the effect of energy intake on PD and LD under the assumption that no other nutrients are limiting growth. A theory of maintenance implies existence of an energy intake level (MEm) at which there is no net gain or loss of energy (ARC, 1981). To apply the concept of maintenance to normally fed, growing
lipid
2
1 Figure 3 A numerical example of energy partitioning at zero energy balance assuming protein deposition at the expense of lipid catabolism. It is shown that when the efficiencies of transformation are different from unity, the energy intake to maintain energetic equilibrium (MERE0 = 100) will be greater than the maintenance energy requirement (MEm = 97).
Modelling protein and lipid deposition in growing pigs input to assure zero energy balance (MERE0). Thus, the classical concept that MEm = MERE0 no longer holds if there is energy transformation at MERE0 intake level or when the efficiencies of transformation differ from unity. As a result, MERE0 will be a biased estimate of MEm and the bias depends on energy deposited as protein and lost as lipid (∆E) and the energetic efficiencies. In a previous study (van Milgen and Noblet, 1999), ∆E differed significantly from zero when using a linear relation between PD (and LD) and MEp. In the present study, ∆E and an unbiased estimate of MEm can be obtained from the model: PD = kp X (ME – MERE0) + ∆E LD = kf (1 – X) (ME – MERE0) – ∆E where MERE0 = (1 – kf)/kp ∆E + MEm (assuming the efficiencies of lipid catabolism and protein deposition equal kf and kp, respectively). As ∆E did not differ significantly from zero, it was not necessary, from a statistical point of view, to consider energy transformation at MERE0 and to include an intercept in this study. The marginal energetic efficiencies for PD and LD (kp and kf, respectively) were assumed to be constant. However, marginal efficiencies are known to vary with the source of energy (Noblet, 1996). In the current study, a constant supply of protein was assured independently of the energy supply. Because PD was lower in pigs on restricted intake than in pigs on ad libitum intake, more protein (relative to carbohydrate) was available for lipid or ATP synthesis in restricted pigs, which can bias estimates for marginal efficiencies. Housing conditions may have an important effect on the voluntary food intake. Quiniou et al. (1996) observed a 0·15 proportionately higher ad libitum food intake in animals kept in individual pens compared with those kept in metabolism cages. Moreover, as social interactions between pigs were limited, the ad libitum food intake reported in the current study (and the resulting PD and LD) may not be directly comparable with those found under normal production conditions. Energy intake and utilization For cLW and cPP✕, the estimated MEm (849 kJ/kg BW0·60 per day) was similar to those found by Quiniou et al. (1996), who used the same data set but a different model. The MEm for bPP✕ estimated by Quiniou et al. (1996) was slightly lower (807 kJ/kg BW0·60 per day). Within the range of observations, the estimated MEm was similar to that suggested by the ARC (1981; 719 kJ/kg BW0·63 per day). Noblet et al.
125
(1999) reported a considerable higher MEm in pigs on ad libitum intake, ranging from 940 to 1120 kJ/kg BW0·60 per day depending on the type of pig. In the current study, graded levels of food intake were used, with subsequent statistical dependence of MEm on ME at the lowest energy intake. Reduction of energy intake is also associated with a proportionally lower mass of visceral tissues (especially the gastrointestinal tract and the liver). These tissues contribute largely to MEm and the fasting heat production (Koong et al., 1982; van Milgen et al., 1998; Noblet et al., 1999). Consequently, the experimental design of the present study results in an estimate of MEm which is lower than the estimate obtained in pigs on ad libitum intake. This also means that estimates of MEm are dependent on the design of the experiment and the model used for its calculation. The energetic efficiencies for protein (0·56) and lipid deposition (0·75) were very close to the preferred estimates reported by the ARC (1981; 0·54 and 0·74 for kp and kf, respectively) but different from those reported by Quiniou et al. (1996; 0·49 and 0·81 for kp and kf, respectively). The estimated efficiencies were also lower than those reported by Noblet et al. (1999): 0·64 and 0·83 for kp and kf, respectively. The latter difference may be due to the correlation between estimates of MEm and energetic efficiencies on the one hand and the use of graded levels of feeding on the other hand. This means that in applying MEm estimates and efficiencies, values should be used from the same approach or the same set of data. The instantaneous response curve to a changing ME supply Although widely accepted in models describing growth in pigs, there is little evidence that the linearplateau concept represents a biological phenomenon. Introduced by Whittemore and Fawcett (1974), the concept of a linear-plateau relationship between PD and ME is simple and assumes an instantaneous change in the PD response of a growing pig to a changing energy supply at the breakpoint. However, even if the linear-plateau concept were true for an individual animal, a smooth response would be obtained if the nutrient requirement changed over the measurement period (Pomar, 1995) or when describing populations (Curnow, 1973). Therefore, it is very difficult (if not impossible) to obtain data to which a single linear-plateau curve can be successfully applied (Fuller and Garthwaite, 1993). Several instantaneous response curves to changing nutrient supplies have been proposed (Fuller and Garthwaite, 1993) including a quadratic model (Schneider et al., 1982). Although biological
126
Van Milgen, Quiniou and Noblet
mechanisms can be put forward for each model to ‘justify’ its use, there is no clear consensus for its most appropriate form. If the logic of van Milgen and Noblet (1999) is used, a growing pig designates a fraction of MEp toward PD. The curvilinear-plateau model used here is ‘justified’ by assuming that, as long as MEp limits PD, this fraction is a linear declining function of MEp. It thereby accounts for the observation that pigs become fatter with increasing energy intake. The result is that not only is the LD to PD ratio non-linear but also the marginal ratio (dLD/dPD). This contrasts with the view that the marginal ratio is constant (de Greef, 1992; Bikker et al., 1995; Quiniou et al., 1996), which is merely a consequence of assuming linear relationships between ME intake and PD and LD, respectively. The changing response curve The concept of an upper limit to protein deposition (PDmax) and its variation in growing pigs has lead to some debate in the literature (Emmans and Kyriazakis, 1997). The choice of a Gompertz function to describe PDmax has important conceptual consequences. The function is often written as PDmax = B Pmax loge(Pmaxm/Pmax), where Pmaxm is the (potential) protein mass at maturity and Pmax the current (potential) protein mass. Describing the potential and thus not the actual protein mass of the animal, the function varies autonomously with age and nutrition has no effect on its shape or parameters. Consequently, the function can be seen as a blueprint for protein deposition, which may or may not be attained. Nutritional constraints such as food restriction will result in a lower PD and(or) LD. Consequently, at identical weight, pigs on restricted intake will be older than pigs on ad libitum intake. Because PDmax was assumed to vary autonomously with age, restricted pigs will have a different PDmax (in general: a lower PDmax) than pigs on ad libitum intake at the same weight. This implies that compensatory protein gain does not exist for restricted pigs if fed at the same food intake level as non-restricted animals. Using the Gompertz function as defined above, compensatory PD can only exist when accompanied by compensatory food intake. Although there are indications that compensatory food intake exists, compensatory protein deposition occurs mainly in visceral organs and not in lean tissue (Stamataris et al., 1991; Bikker et al., 1996b). To account for compensatory growth, it is possible to use a Gompertz function where PDmax is described as a function of the actual protein mass, rather than the potential protein mass (Whittemore, 1995; Emmans and Kyriazakis, 1997). This approach would fully permit compensatory growth even though there
are indications that physiological age plays a rôle in the growth potential of animals. Lister and McCance (1967) found that pigs on ad libitum intake after a severe food restriction for a year, stopped growing at the same physiological age as pigs on normal intake levels, which resulted in a different mature BW. The concept of a constant PDmax for growing pigs (Möhn and de Lange, 1998) could not be confirmed in this study. The PDmax changed with age and decreased more rapidly for the castrated groups than for male pigs. For bPP✕, PDmax remained high throughout the growing period. Although the level of food intake to attain PDmax was beyond the food intake capacity of the animals, the difference between PD and PDmax was relatively small (less than proportionately 0·05). As a result, the slope of the tangent between PD and ME intake (marginal PD response) was small at high ME intake and confirms the finding of a PDmax when using the linearplateau model (Quiniou et al., 1995 and 1996). For this genotype, it appears that the voluntary food intake evolves in such a way that the lean growth potential can be exploited to an optimum. In young castrated males, food intake capacity appeared the main factor limiting PD. However, due to the increased food intake capacity and the declining PDmax, these animals attained PDmax at approximately 80 kg when given food ad libitum. With the four feeding levels in this study, a plateau could not be found with the linear-plateau model (Quiniou et al., 1996) and may be explained by the fact that only in one of the four stages of growth (94 kg), PDmax was limiting PD. For young, high performing animals an upper limit to PD is not always found (Campbell and Taverner, 1988; Rao and McCracken, 1991; Bikker et al., 1996a; Quiniou et al., 1996), and it has been suggested that genetic selection has increased PDmax to a level beyond the food intake capacity of the pig (Campbell and Taverner, 1988). The bPP✕ on ad libitum feeding had already approached PDmax early on in the growth phase (Figure 2) and the MEp intake capacity of these pigs was almost sufficient to fully exploit the genetic potential of the animal. It may be that genetically improved genotypes have a food intake capacity close to that required to attain PDmax. This hypothesis is supported by the data of McCracken et al. (1994), who found that intragastric overfeeding of high performance boars did not increase PD. Whittemore et al. (1988) and Ferguson and Gous (1993b) both measured protein mass in pigs slaughtered at various ages to obtain parameter estimates for the Gompertz function. Although a completely different technique was used in this
127
Modelling protein and lipid deposition in growing pigs
Although the effect of energy intake on PD has been extensively studied, there is little information available on the effect of stage of maturity (BW and(or) age) on the relation between PD and energy intake. Most research in this field is based on the comparative slaughter technique, which requires relatively long measurement periods in order to obtain a (average) response for that period. Dunkin and Black (1985) and Bikker et al. (1996a) found a higher slope between PD and energy intake at lower BW. However, Möhn and de Lange (1998) and Quiniou et al. (1996), over a narrower BW range, could not confirm these results. The current study indicates that, with maturing, both PDmax and the level of food intake to attain it (F) decrease. This means that the marginal PD response to a changing ME supply also decreases with age and(or) BW. Different model, different conclusions The use of a Gompertz function to describe the change in PDmax as a function of age implies that a simple graphical representation of PD as a function of ME intake for a given stage of growth (e.g. Black et al., 1986; Quiniou et al., 1995) is no longer possible. Pigs on restricted intake will be older at the same BW and may therefore have a different PDmax. Figure 4 illustrates this problem where the instantaneous PD response curve to a changing ME supply is given for a bPP✕ weighing 100 kg which was given one of the four energy levels used in this study. To reach 100 kg BW, a bPP✕ on ad libitum intake required approximately 130 days. However, when on 0·70 of ad libitum, the pig needed 164 days to reach the same BW. Due to this difference in age, the PDmax in the latter group was 21 g/day lower than for pigs on ad libitum intake (172 and 193 g/day, respectively). The solid points in Figure 4 illustrate the expected ME intake and PD response for each of the four cases of food restriction. A linear regression through these
200
1·0 ✕ ad libitum 0·9 ✕ ad libitum 0·8 ✕ ad libitum 0·7 ✕ ad libitum
PD (g/day)
180 160 140 120 100 80 15
20
25
30
35
40
45
ME intake (MJ/day) Figure 4 The effect of metabolizable energy (ME) intake and age on protein deposition (PD) in Piétrain ✕ Large White males weighing 100 kg (solid lines). When offered 0·7, 0·8, 0·9 or 1·0 of ad libitum food intake, the animals required 164 , 158, 145 and 130 days respectively to reach 100 kg body weight. The points (●) indicate the positioning of each animal on its individual (PD) response curve, whereas the dashed line indicates the linear regression between those points.
points (dashed line) indicates the traditional interpretation of the data and resulted in a slope of 7·8 g PD per MJ ME, which is within the wide range of literature values (Möhn and de Lange, 1998). It can be observed that the slope of the regression is greater than the marginal PD response (tangent) at each point. In other words, the expected PD response to an instantaneous change in ME is lower than what can be expected from an experiment based on prolonged food restriction. This effect was even more pronounced for cLW at 100 kg (Figure 5). Irrespective of the food restriction, at 100 kg all pigs were of an 200 180 PD (g/day)
study, the similarity between estimates of the shape parameter (B) is striking: 0·0115 in the current study, 0·0107 and 0·0120 for males and gilts reported by Ferguson and Gous (1993b) and 0·0095, 0·0111 and 0·0104 for males, females and castrated males reported by Whittemore et al. (1988). As indicated earlier, the Gompertz function is often parameterized to include the potential protein mass at maturity (Pmaxm) and the initial protein mass (Pmax0). Although Pmax0 (6·3 kg for cLW and cPP✕, and 1·0 kg for bPP✕) and Pmaxm (48·9 kg for cLW and cPP✕, and 46·0 kg for bPP✕) can be calculated (Appendix), no biological meaning should be attributed to these values as they result from extreme extrapolation. They are given here only to facilitate creation of simulated, intermediate values for comparison with other studies.
160 140
1·0 ✕ ad libitum
120
0·9 ✕ ad libitum 0·8 ✕ ad libitum
100
0·7 ✕ ad libitum
80
15
20
25
30
35
40
45
ME intake (MJ/day) Figure 5 The effect of metabolizable energy (ME) intake and age on protein deposition (PD) in Large White castrated males weighing 100 kg (solid lines). When offered 0·7, 0·8, 0·9 or 1·0 of ad libitum food intake, the animals required 190, 176, 170 and 155 days respectively to reach 100 kg body weight. The points (●) indicate the positioning of each animal on its individual PD response curve, whereas the dashed line indicates the linear regression between those points.
128
Van Milgen, Quiniou and Noblet
age at which PDmax was limiting PD. A change in ME intake for these pigs would therefore not change PD. Nevertheless, the linear regression of PD on ME intake indicated that PDmax was not yet attained. Due to the conceptual difference in analysing the data, the marginal PD responses are much lower than those obtained using the linear-plateau model with the same data set (Quiniou et al., 1995 and 1996). It appears that combining an individual response curve with the effects of BW and age on the response has important consequences on the conclusions that can be drawn from such an experiment. Conclusions When studying the effect of a changing nutrient supply to growing pigs, it is important to distinguish the individual response curve of a pig from the change in this response that may occur during growth. The goal of this study was to combine these approaches into a single data analysis model. Although the choice of functions describing each phenomenon may be arbitrary, it appears to have important consequences on the interpretation of the results. The ambiguity between the methods appears most important at higher BW, as the effects of prolonged food restriction are cumulated over time. Reducing the ME intake in order to obtain leaner pigs leads to two conflicting mechanisms. On the one hand, it results in a leaner animal because a larger fraction of MEp is used for PD. On the other hand, it increases the time required to attain a certain BW and may lower the PDmax of pigs. These mechanisms may be exploited to calculate if and when food restriction may be beneficial. The model developed in this study should not be seen as a complete simulation model describing the effects of nutrition on growth as it only addresses the effects of energy supply on PD and LD. Other nutritional factors (e.g. supply of protein or individual amino acids) and environmental factors (e.g. temperature and health status) will affect the response of the animal and are not accounted for in the current approach. Nevertheless, the concepts developed here may be included in simulation models.
References Agricultural Research Council. 1981. The nutrient requirements of pigs. Commonwealth Agricultural Bureaux, Slough, England. Bikker, P., Karabinas, V., Verstegen, M. W. A. and Campbell, R. 1995. Protein and lipid accretion in body components of growing gilts (20 to 45 kilograms) as affected by energy intake. Journal of Animal Science 73: 2355-2363. Bikker, P., Verstegen, M. W. A. and Campbell, R. G. 1996a. Performance and body composition of finishing gilts (45 to
85 kilograms) as affected by energy intake and nutrition in earlier life. II. Protein and lipid accretion in body components. Journal of Animal Science 74: 817-826. Bikker, P., Verstegen, M. W. A., Kemp, B. and Bosch, M. W. 1996b. Performance and body composition of finishing gilts (45 to 85 kilograms) as affected by energy intake and nutrition in earlier life. I. Growth of the body and body components. Journal of Animal Science 74: 806-816. Black, J. L., Campbell, R. G., Williams, I. H., James, K. J. and Davies, G. T. 1986. Simulation of energy and amino acid utilisation in the pig. Research and Development in Agriculture 3: 121-145. Campbell, R. G. and Taverner, M. R. 1988. Genotype and sex effects on the relationship between energy intake and protein deposition in growing pigs. Journal of Animal Science 66: 676-686. Curnow, R. N. 1973. A smooth population response curve based on an abrupt threshold and plateau models for individuals. Biometrics 29: 1-10. Danfær, A. 1991. Mathematical modelling of metabolic regulation and growth. Livestock Production Science 27: 1-18. Dunkin, A. C. and Black, J. L. 1985. The relationship between energy intake and nitrogen balance in the growing pig. In Energy metabolism of farm animals. Proceedings of the 10th symposium (ed. P. W. Moe, H. F. Tyrrell and P. J. Reynolds), pp. 110-113. Rowman and Littlefield, Beltsville, USA. Emmans, G. C. and Kyriazakis, I. 1997. Models of pig growth: problems and proposed solutions. Livestock Production Science 51: 119-129. Ferguson, N. S. and Gous, R. M. 1993a. Evaluation of pig genotypes. 1. Theoretical aspects of measuring genetic parameters. Animal Production 56: 233-243. Ferguson, N. S. and Gous, R. M. 1993b. Evaluation of pig genotypes. 2. Testing experimental procedure. Animal Production 56: 245-249. Fuller, M. F. and Garthwaite, P. 1993. The form of response of body protein accretion to dietary amino acid supply. Journal of Nutrition 123: 957-963. Greef, K. H. de. 1992. Prediction of production. Nutrition induced tissue partitioning in growing pigs. Ph.D. thesis, Department of Animal Nutrition, Wageningen Agricultural University. Kolstad, K. and Vangen, O. 1996. Breed differences in maintenance requirements of growing pigs when accounting for changes in body composition. Livestock Production Science 47: 23-32. Koong, L. J., Nienaber, J. A., Pekas, J. C. and Yen, J. T. 1982. Effects of plane of nutrition on organ size and fasting heat production in pigs. Journal of Nutrition 112: 1638-1642. Lange, C. F. M. de. 1995. Framework for a simplified model to demonstrate principles of nutrient partitioning for growth in the pig. In Modelling growth in the pig (ed. P. J. Moughan, M. W. A. Verstegen and M. I. Visser-Reyneveld), pp. 71-85. Wageningen Pers, Wageningen. Le Dividich, J., Vermorel, M., Noblet, J., Bouvier, J. C. and Aumaitre, A. 1980. Effects of environmental temperature on heat production, energy retention, protein and fat gain in early weaned piglets. British Journal of Nutrition 44: 313-323.
Modelling protein and lipid deposition in growing pigs Lister, D. and McCance, R. A. 1967. Severe undernutrition in growing and adult animals. 17. The ultimate results of rehabilitation: pigs. British Journal of Nutrition 21: 787-799. Lovatto, P. A. and Sauvant, D. 1999. Modélisation des régulations du métabolisme des acides aminés chez le porc. Journées de la Recherche Porcine en France 31: 255-259. McCracken, K. J., McEnvoy, J., McAllister, A., Lilley, J. and Urquhart, R. 1994. Effects of overfeeding on protein/energy metabolism and body composition of high potential boars. In Energy metabolism of farm animals. Proceedings of the 13th Symposium, pp. 217-220. CSIC Publishing Service, Granada, Spain. Milgen, J. van, Bernier, J. F., Lecozler, Y., Dubois, S. and Noblet, J. 1998. Major determinants of fasting heat production and energetic cost of activity in growing pigs of different body weight and breed/castration combination. British Journal of Nutrition 79: 509-517. Milgen, J. van and Noblet, J. 1999. Energy partitioning in growing pigs: the use of a multivariate model as an alternative for the factorial analysis. Journal of Animal Science 77: 2154-2162. Moughan, P. J., Smith, W. C. and Pearson, G. 1987. Description and validation of a model simulating growth in the pig (20-90 kg liveweight). New Zealand Journal of Agricultural Research 30: 481-489. Möhn, S. and Lange, C. F. M. de. 1998. The effect of body weight on the upper limit to protein deposition in a defined population of growing gilts. Journal of Animal Science 76: 124-133. Neter, J., Kutner, M. H., Nachtsheim, C. J. and Wasserman, W. 1996. Applied linear statistical models. Irwin, Burr Ridge, Illinois. Noblet, J. 1996. Digestive and metabolic utilization of dietary energy in pig feeds: comparison of energy systems. In Recent advances in animal nutrition (ed. P. C. Garnsworthy, J. Wiseman and W. Haresign), pp. 207-231. Nottingham University Press, Nottingham. Noblet, J., Karege, C., Dubois, S. and Milgen, J. van. 1999. Metabolic utilization of energy and maintenance requirements in growing pigs: effects of sex and genotype. Journal of Animal Science 77: 1208-1216. Pomar, C. 1995. A systematic approach to interpret the relationship between protein intake and deposition and to evaluate the role of variation on production efficiency in swine. In Animal science research and development: moving toward a new century (ed. M. Ivan), pp. 361-375. Canadian Society of Animal Science, Ottawa, Canada. Pomar, C., Harris, D. L. and Minvielle, F. 1991. Computer simulation model of swine production systems. I. Modelling the growth of young pigs. Journal of Animal Science 69: 1468-1488. Quiniou, N., Dourmad, J. -Y. and Noblet, J. 1996. Effect of energy intake on the performance of different types of pig from 45 to 100 kg body weight. 1. Protein and lipid deposition. Animal Science 63: 277-288. Quiniou, N., Noblet, J., Milgen, J. van and Dourmad, J.-Y. 1995. Effect of energy intake on performance, nutrient and tissue gain and protein and energy utilization in growing boars. Animal Science 61: 133-143.
129
Rao, D. S. and McCracken, K. J. 1991. Effect of energy intake on protein and energy metabolism of boars of high genetic potential for lean growth. Animal Production 52: 499-507. Ratkowsky, D. A. 1983. Nonlinear regression modeling. A unified practical approach. Marcel Dekker Inc., New York. Riis, P. M. 1983. The pools of tissue constituents and products: proteins. In Dynamic biochemistry of animal production (ed. P. M. Riis), pp. 75-108. Elsevier Science Publishers BV, Amsterdam. Schneider, W., Gaus, G., Michel, A., Susenbeth, A. and Menke, K. H. 1982. Effect of level of feeding and body weight on partition of energy in growing pigs. In Energy metabolism of farm animals. Proceedings of the ninth symposium (ed. A. Ekern and F. Sundstøl), pp. 225-228. Agricultural University of Norway, Aas, Norway. Schnute, J. 1981. A versatile growth model with statistically stable parameters. Canadian Journal of Fisheries and Aquatic Sciences 38: 1128-1140. Stamataris, C., Kyriazakis, I. and Emmans, G. C. 1991. The performance and body composition of young pigs following a period of growth retardation by food restriction. Animal Production 53: 373-381. Statistical Analysis Systems Institute. 1989. SAS/STAT® user's guide, version 6. Statistical Analysis Systems Institute Inc., Cary, NC. Waterloo Maple. 1998. Maple V, version 5·1. Waterloo Maple Inc., Waterloo, ON, Canada. Whittemore, C. T. 1995. Modelling the requirement of the young growing pig for dietary protein. Agricultural Systems 47: 411-425. Whittemore, C. T. and Fawcett, R. H. 1974. Model responses of the growing pig to the dietary intake of energy and protein. Animal Production 19: 221-231. Whittemore, C. T., Tullis, J. B. and Emmans, G. C. 1988. Protein growth in pigs. Animal Production 46: 437-445 (Received 25 September 1999—Accepted 8 February 2000)
Appendix Derivation of the instantaneous response curve For MEp intake (kJ/day) below that required to attain PDmax (kJ/day), X = X0 + dX MEp, where X0 is the fraction of MEp designated towards PD at maintenance ME intake level (MEp = 0) and dX is the change in this fraction due to an increase of MEp (per kJ). This results in a quadratic relation between PD and MEp: PD = kp (X0 + dX MEp) MEp
(A1).
The maximum of this equation corresponds to PDmax. The MEp intake required to attain PDmax can be obtained by taking the first derivative of this equation with respect to MEp and solving dPD/dMEp = 0 for MEp. Substituting the solution (MEp = –X0/(2 dX)) back in equation A1 yields PDmax: PDmax = (–kp X02)/(4dX)
(A2).
130
Van Milgen, Quiniou and Noblet
If F is defined as the energy intake (as multiples of MEm) to attain PDmax, then the previous equation can also be written as (F – 1) MEm = –X0/(2 dX), which can be solved for F. F = 1 – [X0/(2 dX MEm)]
(A3).
Equations A2 and A3 can be rearranged to give: X0 = (2 PD max)/(MEm(F – 1) kp) and dX = (–PDmax)/((MEm(F – 1))2 kp) which can be substituted in equation A1. Thus, if ME < (F MEm): PDmax (2 F MEm – ME – MEm) (ME – MEm) PD = ———————————————————— MEm2 (F – 1)2 (A4) PDmax (2 F MEm – (ME + MEm)) MEp or: PD = ————————————————— MEm2 (F – 1)2
(
)
and when ME ≥ (F MEm), then: PD = PDmax
(A5)
The ME not used for maintenance or protein synthesis can be used for lipid synthesis, so that: LD =
(
PD ME – MEm – —— kp
or: LD =
(
PD MEp – —— kp
)
)
kf (A6)
kf
The Gompertz function for describing PDmax The Gompertz function can be parameterized as: PDmax = B Pmax loge
(
(
Pmaxm ———— Pmax
)
where B is a shape parameter (1/d), Pmax is the current potential protein mass and Pmaxm the potential protein mass at maturity. Integration of this equation with the initial potential protein mass (Pmax0) then yields an equation for Pmax with parameters B, Pmax0, and Pmaxm. Because in the current experiment, PD was measured it may be better to express parameters as a function of PD rather than of protein mass. In addition, the animals used here were far from mature and using Pmaxm in the statistical analysis may result in unstable estimates. As indicated above, the fractional rate of potential protein deposition (PDmax/Pmax = Z) was supposed to decline with age. Schnute (1981) showed that if it is assumed that the fractional rate of change of Z equals B (i.e. (dZ/dt)/ Z = –B), a Gompertz function for Pmax is implied. Thus, the Gompertz function can be described by two differential equations that need to be integrated. Although differential equations are often integrated with initial constraints (i.e. values for Z and Pmax at t = 0), they can also be integrated with different constraints. Because the interest in this study is in PDmax and not in Pmax, the differential equations were integrated with the constraints of PDmax at 100 and 150 days of age (PDmax100 and PDmax150, respectively) using Waterloo Maple (1998): equation (A8) — see below where t is the age of animals (day). The Pmax (i.e. the protein mass of the animal if there had been no nutritional constraints throughout growth) is then given by: equation (A9) — see below. Although these equations are lengthy and not very aesthetic, their parameters are easy to interpret as one parameter describes the shape of the Gompertz function (B) and two parameters describe the level (PDmax at 100 and 150 days of age, respectively). Suitable parameterization of models is required when parameters are to be estimated statistically. In (numerical) simulation models this is much less of an issue and one can opt for a simpler description of the model (i.e. equation A7). Parameters for equation A7 (i.e. Pmaxm and Pmax0) can be obtained by substituting parameter estimates from the present study (PDmax100, PDmax150, and B) in equation A9 using t = ∞ and t = 0, respectively.
(A7)
(
) (
(
))
)
PDmax150 PDmax150 ————— + 50B + loge ———— exp(B(100 – t)) PDmax100 PDmax100 PDmax = PDmax100 ✕ exp B(100 – t) +———————————————————————————————————— (A8) exp (–50B) – 1
Pmax =
– 50B – loge
(
(
))
PDmax150 ————— PDmax100 PDmax100(1 – exp (–50B)) exp ———————————————————————————— exp (–50B) – 1 ——————————————————————————————————————————— PDmax150 B 50B + loge ————— PDmax100
(
(–1 + exp (–B(t – 100)))
(
(
))
50B + loge
)
(A9).