Sun et al. / J Zhejiang Univ Sci A 2009 10(10):1509-1522
1509
Journal of Zhejiang University SCIENCE A ISSN 1673-565X (Print); ISSN 1862-1775 (Online) www.zju.edu.cn/jzus; www.springerlink.com E-mail:
[email protected]
Mapping paddy rice with multi-date moderate-resolution imaging spectroradiometer (MODIS) data in China* Hua-sheng SUN†1,2,6, Jing-feng HUANG†‡1,3, Alfredo R. HUETE4, Dai-liang PENG1,2, Feng ZHANG5 (1Institute of Agricultural Remote Sensing and Information Application, Zhejiang University, Hangzhou 310029, China) (2Key Lab of Agricultural Remote Sensing and Information System, Hangzhou 310029, China) 3
( MOE Key Lab of Environmental Remediation and Ecological Health, Zhejiang University, Hangzhou 310029, China) (4Department of Soil, Water, and Environmental Science, University of Arizona, Tucson, AZ 85721, USA) (5Resources and Environment Department, Xinjiang Agricultural University, Urumchi 830052, China) (6College of Surveying and Mapping, Xuzhou Normal University, Xuzhou 221116, China) †
E-mail:
[email protected];
[email protected]
Received July 15, 2008; Revision accepted Nov. 20, 2008; Crosschecked Aug. 12, 2009
Abstract: The objective of this study was to obtain spatial distribution maps of paddy rice fields using multi-date moderateresolution imaging spectroradiometer (MODIS) data in China. Paddy rice fields were extracted by identifying the unique characteristic of high soil moisture in the flooding and transplanting period with improved algorithms based on rice growth calendar regionalization. The characteristic could be reflected by the enhanced vegetation index (EVI) and the land surface water index (LSWI) derived from MODIS sensor data. Algorithms for single, early, and late rice identification were obtained from selected typical test sites. The algorithms could not only separate early rice and late rice planted in the same fields, but also reduce the uncertainties. The areal accuracy of the MODIS-derived results was validated by comparison with agricultural statistics, and the spatial matching was examined by ETM+ (enhanced thematic mapper plus) images in a test region. Major factors that might cause errors, such as the coarse spatial resolution and noises in the MODIS data, were discussed. Although not suitable for monitoring the inter-annual variations due to some inevitable factors, the MODIS-derived results were useful for obtaining spatial distribution maps of paddy rice on a large scale, and they might provide reference for further studies. Key words: Remote sensing, Moderate-resolution imaging spectroradiometer (MODIS), Enhanced vegetation index (EVI), Land surface water index (LSWI), Paddy rice, China doi:10.1631/jzus.A0820536 Document code: A CLC number: TP753
INTRODUCTION Paddy rice is one of the major staple food crops of the world. In Asia, China is a major rice-producing country, with the rice sown area accounting for 27.8% of the total grain area, and the output accounting for 37.4% of the total grain output in 2005 (CEPD, 2006; ECCAY, 2006), so rice plays an important role in ‡
Corresponding author Project supported by the National High-Tech Research and Development Program (863) of China (No. 2006AA120101), the National Natural Science Foundation of China (No. 40871158/D0106), and the Key Technologies Research and Development Program of China (No. 2006BAD10A01) *
supporting the country’s 1.3 billion population. It is necessary to get rapid seasonal information about paddy rice for managers in the decision making process, for the spatial distribution of paddy rice fields is essential to annual rice production estimation and water resources management. In addition, studies showed that rice fields are significant sources of methane (one of the main greenhouse gases) (Neue and Boonjawat, 1998; van der Gon, 2000; Li et al., 2002), so the information is also helpful in estimating the volume of methane discharged into the atmosphere due to human activities. So far, the national agricultural census mainly relies on statistics based on limited ground samplings
1510
Sun et al. / J Zhejiang Univ Sci A 2009 10(10):1509-1522
taken at the grass-root level for extrapolation on the national scale. Even though the census can provide statistical estimates, the data are unable to provide spatial distribution of crops, and usually the data obtaining process is too slow to provide timely information. Therefore, better ways were sought to tackle the problems. Researchers turned to remote sensing for assistance, for using satellite remote sensing technology is a feasible and efficient way to make studies of the land surface. It can acquire large-scale and periodic vivid images with abundant information, while more economical compared with the in situ field survey. So the technology has been widely used in the agricultural research field since the launch of Landsat-1 in 1972. Rice distribution information has been obtained on different scales from images acquired by various sensors. For instance, a report showed that using Landsat MSS satellite remote sensing data to forecast wheat production in the Large Area Crop Inventory Experiment (LACIE) was successful and the approach could be expanded to other areas and other crops (MacDonald and Hall, 1980). Subsequently, some reports showed that rice maps could be obtained with considerable accuracy using MSS data (McCloy et al., 1987; Nageswara Rao and Rao, 1987). More reports showed that data with finer spatial resolution like TM/ETM+ (30 m) and SPOT (10 m) could be used to extract rice information (Tennakoon et al., 1992; Turner and Congalton, 1998; Hong et al., 1999). Considering the big impact of cloud contamination on data acquisition using optical sensors in regions with serious clouds, data acquired by microwave sensors were also used to extract rice information and obtained satisfying results (Okamoto and Kawashima, 1999; Ribbes and le Toan, 1999; Shao et al., 2001; Li et al., 2003). The studies mentioned above identified rice through image classification procedures because the resolution is fine enough to distinguish rice from other crops by their spectral differences in relatively small regions. If we desire to obtain rice information over a very large area, sensors with a wide field of view are necessary. However, it is hard to obtain both fine spatial resolution and large coverage at the same time using the current sensors aboard satellites. Obviously, the spatial resolution of the sensors with a wide field of view is too coarse compared with the above mentioned ones. For instance, the top spatial resolutions of NOAA-AVHRR, SPOT-VEGETA-
TION, and EOS-MODIS are 1100, 1000, and 250 m, respectively. If we attempt to categorize rice fields from the coarse images at a single time as we do from the fine images, surely we could not obtain satisfying results. Fortunately, the advantages of large and frequent coverage enable the sensors with a wide field of view to have more opportunities to acquire cloud-free images, especially to acquire useful images in a critical period. Temporal information also provides significant information, for the spectral reflectance of different things might be distinctive over time. Moreover, the low cost of the data is another advantage making the sensors with a wide field of view superior to data with high spatial resolution like Landsat and SPOT. The AVHRR and MODIS data with coarse spatial resolution while with frequent coverage were tested for usefulness in extracting rice information on large scales in the studies of Fang et al. (1998) and Xiao et al.(2005; 2006). However, there were still some problems needing to be solved; for example, the extracting algorithms should be optimized to reduce the uncertainties, and the planted area of early rice and late rice should be separated for they might be planted in the same fields in the same year. Therefore, this study aims to obtain the spatial distribution of paddy rice (including single, early and late) with improved algorithms for the whole country of China; moreover, further analyses of the factors that cause errors in the results were made to show the applicability of MODIS data under different conditions.
STUDY AREA Paddy rice is planted in all provincial administrative units except Qinghai in China. A summary of grain crops and the paddy rice sown area in 2005 is listed in Table 1 (CEPD, 2006; ECCAY, 2006). China has diverse climates because of the country’s extensive territory and complicated topography. Therefore, rice planting schedules and rotations are very different due to the diversity of climate and economic factors. To the south of the Nanling Mountains, including Guangdong, Guangxi, Hainan, and Taiwan, rains are prolific and the temperature is high all year round, so a double rice rotation system is dominant in this region; the region to the south of the Yangtze River, including the southern part of Yunnan, Fujian,
1511
Sun et al. / J Zhejiang Univ Sci A 2009 10(10):1509-1522
Table 1 A summary of China’s grain crops and paddy rice sown area on the provincial scale according to statistical data in 2005 (CEPD, 2006; ECCAY, 2006) Sown area of grain crops (×103 hm2) Anhui 6410.9 Beijing 192.2 Chongqing 2501.3 Fujian 1441.3 Gansu 2587.2 Guangdong 2786.5 Guangxi 3496.2 Guizhou 3073.7 Hainan 423.8 Hebei 6240.2 Heilongjiang 8650.8 Henan 9153.4 Hubei 3926.8 Hunan 4838.6 Inner Mongolia 4373.6 Jiangsu 4909.5 Jiangxi 3441.5 Provincial region
Sown area of rice (×103 hm2) 2149.1 0.8 747.9 951.6 5.1 2137.6 2360.4 721.7 300.4 87.7 1650.3 511.1 2077.4 3795.2 84.5 2209.3 3129.0
Percentage of Provincial rice to grain region crops (%) 33.5 Jilin 0.4 Liaoning 29.9 Ningxia 66.0 Qinghai 0.2 Shaanxi 76.7 Shandong 67.5 Shanghai 23.5 Shanxi 70.9 Sichuan 1.4 Taiwan 19.1 Tianjin 5.6 Tibet 52.9 Xinjiang 78.4 Yunnan 1.9 Zhejiang 45.0 Total 90.9
Sown area of grain crops (×103 hm2) 4294.5 3052.0 775.9 245.6 3263.9 6711.7 166.1 3033.6 6564.8 279.4 287.7 177.7 1492.8 4253.9 1510.8 104 557.9
Sown area of rice (×103 hm2) 654.0 568.4 71.3 0.0 147.1 119.8 112.7 2.7 2087.5 269.0 16.7 1.0 69.3 1049.3 1028.5 29 116.4
Percentage of rice to grain crops (%) 15.2 18.6 9.2 0.0 4.5 1.8 67.9 0.1 31.8 96.7 5.8 0.6 4.6 24.7 68.1 27.8
Note: grain crops include cereal (mainly rice, wheat, and corn), soybeans, and tubers in this study
Zhejiang, Jiangxi, Hunan, Hubei, and Anhui, is a transitional region of double and single rice rotation systems, on account of less effective temperatures and the inferior quality of a double rice crop, so double rice and single rice mix together in this region; in the large area to the north of the Yangtze River and in the regions of western China, single rice is dominant.
MATERIALS AND METHODS MODIS data The study focused on mapping the spatial distribution of paddy rice (including single rice and double rice) using time-series MODIS data in China. The MODIS sensor onboard the NASA EOS Terra/Aqua satellite has 36 spectral bands, 7 of which are designed for vegetation and land surface studies. The ranges and spatial resolution of the 7 bands are listed as follows: Band 1 (red: 620~670 nm, 250 m), Band 2 (NIR1: 841~876 nm, 250 m), Band 3 (blue: 459~479 nm, 500 m), Band 4 (green: 545~565 nm, 500 m), Band 5 (NIR2: 1230~1250 nm, 500 m), Band 6 (SWIR1: 1628~1652 nm, 500 m), and Band 7 (SWIR2: 2105~2155 nm, 500 m). The MODIS Land the users from daily as well as various composite
Team provides a suite of standard MODIS products to products. All the data are available freely from the Land Processes Distributed Active Archive Center (LPDAAC) (http://lpdaac.usgs.gov). Because heavy clouds may affect the quality of the images, the 8-d composite surface reflectance images might have more opportunities to avoid the impact of clouds than the daily collected ones. The changes within every 8 d can be ignored and the temporal coverage frequency is fit for the seasonal change detection. Therefore, this study used the 8-d composite surface reflectance images to overcome the cloud problem. Each pixel in the 8-d composite images is the best one in quality within every 8 d on the basis of high observation coverage, low view angle, the absence of clouds, cloud shadows and aerosols (http://modis-land.gsfc. nasa.gov/surfrad.htm), so the selected date might be different for different pixels. However, the date selection could be regarded as a stochastic phenomenon from an overall perspective, so we used the middle date within the 8 d (about the 4th day) to represent approximately the acquiring date of each composite image. MOD09A1 is the 8-d composite land surface reflectance product with 500 m spatial resolution. The MODIS Land Data Operational Product Evaluation (LDOPE) facility (http://landweb.nascom.nasa.gov/
1512
Sun et al. / J Zhejiang Univ Sci A 2009 10(10):1509-1522
cgi-bin/QA_WWW/newPage.cgi) also provides a coordination mechanism for MODLAND’s quality assessment (QA) activities (Roy et al., 2002). The band of QA at pixel level is also provided together with the reflectance data in the products. Useful information is available on the basis of the description of the MODIS 8-d Surface Reflectance QA information (http://edcdaac.usgs.gov/modis/moyd09a1q1_qa _v4.asp) through binary calculation. To cover the whole extent of China for a year, 19 tiles of MOD09A1 images with 46 dates are needed. The tile numbers are H23V (04~05), H24V (04~05), H25V (03~06), H26V (03~06), H27V (04~06), H28V (05~07) and H29V06. The 19 individual tiles were mosaicked into large images. To ensure no distortion in area and to make it convenient for our observation as well, we maintained the initial projection (the equal-area sinusoidal projection) for each resultant image, but the central meridian was transformed from 0° to 105° E. The Earth spheroid of the MOD09A1 product is a sphere with a radius of 6 371 007.181 m (http://edcdaac.usgs.gov/landdaac/tools/mrtswath/info/ ReleaseNotes.pdf). Algorithms for the identification of paddy rice 1. Basis of the algorithms Rice fields are filled with persistent water since the flooding period and the flood duration remains up until approximately a week before harvest, so soil moisture is high in this period, and this is the biggest difference from other crops. However, rice grows rapidly after transplanting. The canopies may cover most of the surface area about 50 to 60 d after transplanting (Xiao et al., 2005; 2006). As for optical sensors, the recorded responses of rice are much the same as those of other crops once the vegetation starts to cover the surface, so the optimum acquiring period should be in the earlier period before being fully covered by the canopies. We found that typically the period could be maintained only in two to four 8-d composites of MODIS images at our test sites. Therefore, the spectral characteristics of water in the flooding and transplanting period can be used to distinguish the potential rice fields, and permanent water bodies and other non-rice areas can be eliminated with the aid of later images (McCloy et al., 1987). This is the basis of rice identification in the study.
2. Preprocessing of MODIS data Vegetation and soil moisture sensitive indices were used to enhance the features of the objects of interest in the study. As the blue band is sensitive to atmospheric conditions, it is used to adjust the reflectance in the red band as a function of the reflectance in EVI. EVI is an improved vegetation index because it accounts for the effects of residual atmospheric contamination and soil background (Huete et al., 1997; 2002), and it is much less sensitive to aerosols than the normalized difference vegetation index (NDVI), so we chose EVI instead of NDVI for vegetation change detection. The SWIR spectral bands are sensitive to leaf water content and soil moisture, so they are used to develop water sensitive indices combined with NIR like normalized difference water index (NDWI) (it was called the shortwave infrared water stress index (5, 2), SIWSI (5, 2)) and LSWI (it was called SIWSI (6, 2), Eq.(2)) (Gao, 1996; Xiao et al., 2002a; 2002b; Fensholt and Sandholt, 2003). Both of them can reflect soil water content. However, because Band 6 is more sensitive to soil moisture than Band 5 in near infrared spectrum, and Fensholt and Sandholt (2003) reported that the SIWSI (6, 2) performed slightly better than the SIWSI (5, 2); the LSWI was also tested to be a success in the studies of Xiao et al.(2005; 2006). So we selected LSWI instead of NDWI for soil moisture detection. Consequently, two indices were selected in our study, i.e., EVI, and LSWI: EVI = 2.5 × LSWI =
ρ NIR1 − ρ red , ρ NIR1 + 6.0 ρ red − 7.5ρ blue + 1
ρ NIR1 − ρSWIR1 . ρ NIR1 + ρ SWIR1
(1) (2)
Although the 8-d composite surface reflectance products of MODIS have been strictly preprocessed to reduce the impacts of clouds, shadows, and aerosols, obviously residual noises still exist due to atmospheric effect and lasting heavy clouds in some regions. There are some methods for noise removing in time-series to obtain seasonal information, like the simplest method of the moving median or average, and some other more complicated ones like the BISE (best index slope extraction) algorithm (Viovy et al., 1992), the Fourier-based algorithm (Sellers et al., 1994; Cihlar, 1996), the wavelet transform function
1513
Sun et al. / J Zhejiang Univ Sci A 2009 10(10):1509-1522
(Sakamoto et al., 2005), the Savitzky-Golay filter (Savitzky and Golay, 1964; Chen et al., 2004; Jönsson and Eklundh, 2004), as well as the conditional temporal interpolation filtering (CTIF) (Groten, 1993). All the above mentioned algorithms are useful in estimating the EVI, because vegetation usually has continuous smooth curves in the time-series profiles of EVI, and the abruptly changed points in the time-series profiles could be regarded as noises. In order not to sacrifice the useful information, the CTIF method was used in our study. The algorithm has the advantage of keeping the ‘good’ pixels and remedying the ‘bad’ ones. It was testified that the algorithm was useful for reducing noises. The CTIF algorithm in the study is depicted as follows. Data quality and cloud state based on QA information were implemented to examine whether a pixel is clear and is produced at ideal quality in all bands in the first step. If it is true, keep its value; otherwise, replace the pixel value by the average of the values of the previous and the next images when both are cloudless. If only one of the values of the previous and the next images is clear, then use the clear one as a substitute; if all the 1.0 0.8 0.6 0.4 0.2 0.0 −0.2 −0.4 1.0 0.8
(a)
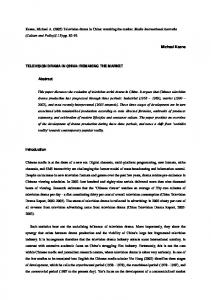
pixels are contaminated in the three adjacent images (the pixels in the previous and the next images are also contaminated), then it is regarded as useless for rice identification and must be removed from the images. However, all the smoothing methods are unsuitable for LSWI, because soil moisture normally changes suddenly due to irrigation or precipitation, so LSWI is too sensitive for smoothing. Therefore, we did not perform smoothing on LSWI but kept the raw data. Because clouds and their shadows block or change the reflectance of the surface features, they have a strong impact on rice identification because of the unreliable data in these regions, so cloud masks were built in terms of the QA information in the MODIS products to remove all the cloud-contaminated pixels. The amount of the cloud contaminated pixels during the flooding and transplanting period in a region is an important index to show the impact of cloud contamination on the extracted results. Typical time-series of EVI and LSWI profiles of rice and the effect of the above mentioned noise removing method for EVI are shown in Fig.1.
Raw EVI Filtered EVI LSWI
Snow
Snow
Flooding and transplanting
(b)
Raw EVI Filtered EVI LSWI
Flooding and transplanting Winter wheat
0.6 0.4 0.2 0.0 −0.2 1.0
(c)
0.8 0.6
Raw EVI Filtered EVI LSWI
Be deleted for lasting cloud
0.4 0.2 0.0 −0.2 4-Jan
Flooding and transplanting
3-Feb
5-Mar
4-Apr
4-May
3-Jun
Flooding and transplanting
3-Jul
2-Aug
1-Sept
1-Oct
31-Oct
30-Nov
30-Dec
Date
Fig.1 Typical time-series of EVI and LSWI profiles of rice at the test sites in 2005 (a) Single rice in Heilongjiang Province (46°26'27" N, 132°47'28" E); (b) Other crop (winter wheat) and single rice in Jiangsu Province (32°41'32" N, 119°09'19" E); (c) Double rice in Jiangxi Province (28°41'32" N, 116°12'04" E)
1514
Sun et al. / J Zhejiang Univ Sci A 2009 10(10):1509-1522
Rice identification in the study A difficult problem is that the flooding and transplanting date is different in China because of the difference in the planting schedules and rotations, which is a challenge for rice classification. Xiao et al. (2005; 2006) used a simple conditional expression of LSWI+0.05≥EVI or LSWI+0.05≥NDVI for paddy rice fields identification on the basis of the characteristic of paddy rice fields in the flooding and transplanting period, irrespective of the acquired date of the images, and used another expression of the EVI value reaching half of the maximum EVI value within five 8-d composites following the flooding and transplanting period as an auxiliary condition. Moreover, the non-rice area was further removed with the assistance of the digital elevation model (DEM) data and masks of cloud, snow, permanent water and evergreen vegetation. Eventually, paddy fields were obtained when all the pixels that met the above conditions in each image were overlaid. This method could avoid the problem of the planting schedule difference; however, if all the images in the entire year were overlaid, some unexpected errors might be included (for example, wetlands or other croplands with high soil moisture because of rainfall or irrigation), so it might overestimate the planted area of rice. Tests did show that there were lots of noises beyond the flooding and transplanting period. Another disadvantage of the algorithm is that early rice and late rice could not be separated if they were planted in the same fields in a year. Therefore, the extracting method was improved in this study. To resolve the above problems, MODIS data were integrated with the known knowledge of the rice growth calendar collected from the agricultural meteorological observatories. The data are available from the National Meteorological Bureau of China. The planting calendar is relatively stable in a region though it has inter-annual variations, so all potential dates of the flooding and transplanting period in different regions are selected according to the statistics over many years. The calendars of the plants in wetlands or other croplands might be different from the rice calendar, so the noises in the images beyond the flooding and transplanting period could be eliminated; at the same time, early rice and late rice could be distinguished according to the known knowledge if they were planted in the same fields. We spatially
interpolated the Julian dates of the flooding and transplanting period and obtained information for all of China. Then the whole extent of China can be divided into some relatively homogenous regions as regions of interest (ROIs) for single rice and double rice to reduce the uncertainties. Usually, the reflectance is the integration of paddy rice fields (composed of water, soil, seedlings, etc.) and the background (ditches, roads, weeds, shelter belts, other crops, etc.) in the flooding and transplanting period. The characteristics of high soil moisture and low coverage of vegetation can be detected by LSWI and EVI, for LSWI is high and EVI is low in this period. If the EVI value is high in this period, the pixel can be regarded as plants (trees, shrubs, grass, etc.). We obtained rice identification algorithms from 123 test sites for single rice and 50 test sites for early and late rice. All the samples were selected in different regions of China to ensure their typicality, and they were selected from the images without cloud contamination in 2005. Average EVI and LSWI at each test site in the flooding and transplanting period were calculated. The results are shown in Fig.2. The algorithms for potential single, early, and late rice were obtained from the above analyses. We used the conditional functions of LSWI>0.12, EVIEVI for single and early rice identification; however, tests showed that the reflectance of the background was strong in the flooding and transplanting period of late rice, and that the background had a big impact on EVI while little on LSWI because the penetrability of the shortwave infrared bands is stronger, so we used LSWI>0.12, EVIEVI for late rice identification. Another conditional function was used with the aid of the images following the flooding and transplanting period to remove permanent water bodies and other non-rice pixels in the above identified regions. Tests showed that the average EVI of the sixth to the eleventh 8-d composites after transplanting was greater than 0.35 for a rice pixel if there was no cloud contamination in the growing season, while the value was less than 0.35 for a permanent water pixel or a non-rice pixel. Furthermore, to improve the extracting accuracy, DEM was also used to remove the non-rice pixels, because most of the rice fields are distributed across regions with a slope of less than 5°
1515
Sun et al. / J Zhejiang Univ Sci A 2009 10(10):1509-1522
0.5 y=x- 0.05
x=0.26
LSWI LSWI
0.4 0.3 0.2 y=0.12 0.1
(a) 0.0 0.5
x=0.26
y=x- 0.05
LSWI LSWI
0.4 0.3
rice in the flooding and transplanting period, so snow can be also eliminated by DEM. Considering the precision demands of DEM, we used the Shuttle Radar Topography Mission (SRTM) elevation data with 3′′ (about 90 m) spatial resolution provided by the Global Land Cover Facility (http://www.landcover. org). Eventually the spatial distribution maps of double and single paddy rice were attained. The whole process for paddy rice identification is shown in Fig.3. Rice calendar statistics
MOD09A1
DEM
Interpolation by GIS
Time-series of EVI and LSWI; cloud detection
Surface analysis
EVI filtering; cloud masks
Slope and elevation masks
Data
0.2 y=0.12 0.1
(b) 0.0 0.5 0.5
Preprocessing Rice calendar regionalization
x=0.35 0.4 0.4
LSWI LSWI
y=x- 0.17 0.3 0.3 0.2 0.2
Computation
y=0.12 0.1 0.1
(c) 0.0 0.0
0.0 0.0
0.1 0.1
0.2 0.2
0.3 0.3
0.4 0.4
Single and early rice: LSWI>0.12, EVIEVI in the transplanting period; average EVI>0.35 in the 6th to 11th 8-d composites after transplanting Late rice: LSWI>0.12, EVIEVI in the transplanting period; average EVI>0.35 in the 6th to 11th 8-d composites after transplanting
0.5 0.5
EVI EVI Results
Fig.2 Characteristics of paddy rice fields reflected by EVI and LSWI in the flooding and transplanting period according to the typical test sites in 2005 (a) Single rice; (b) Early rice; (c) Late rice. The short dash lines are the thresholds for potential rice in the flooding and transplanting period
Spatial distribution and effect evaluation
Fig.3 Flowchart for the identification of paddy rice using MODIS data
RESULTS AND VALIDATION and an elevation of less than 1500 m in the flat provinces. However, it is different in the hilly ones because there are many terraced paddy fields. Most of the terraced paddy fields are distributed across regions with a slope of less than 15° and at an elevation of less than 2400 m. Terraced paddy fields mainly exist in Fujian, Zhejiang, Jiangxi, Hubei, Hunan, Guangdong, Guangxi, Hainan, Sichuan, Chongqing, Guizhou, Yunnan, and Tibet. So we built different masks for the flat provinces and the hilly ones. Snow in the images may affect the extracted results if it does exist in the flooding and transplanting period of rice, because it also has the characteristics of high LSWI and low EVI, just like rice fields. However, rice is a heat-loving crop. Snow has retreated to the high mountains or the high-latitude regions unsuitable for
Spatial distribution of MODIS-derived paddy rice The spatial distribution maps of single rice, early rice and late rice derived from MODIS data were obtained according to the above mentioned extraction algorithms. Paddy rice fields in the years 2001 to 2006 were extracted to test the effect of the MODISderived results. The results of single, early and late rice in 2001~2006 are shown in Figs.4~6 (see p.1519 for Fig.6). Validation of MODIS-derived results 1. Areal accuracy examination Though detailed land use maps have information about paddy rice fields, there are big differences between the paddy fields on land use maps and the rice planted regions in each year, because rice planted
1516
Sun et al. / J Zhejiang Univ Sci A 2009 10(10):1509-1522
N 45°
30°
(a)
(b)
(c)
(d)
(e)
(f)
15° N 45°
30°
15°
100°
120° E
100°
National boundaries
Provincial boundaries
120° E
100°
120° E
Rice
Coastlines
Fig.4 Spatial distribution of single rice derived from MODIS data in China during 2001~2006 (a) 2001; (b) 2002; (c) 2003; (d) 2004; (e) 2005; (f) 2006
N 30°
20°
(a)
(b)
(c)
(d)
(e)
(f)
N 30°
20° 100°
110°
120° E 100°
National boundaries
110°
Provincial boundaries
120° E 100°
Coastlines
110°
120° E
Rice
Fig.5 Spatial distribution of early rice derived from MODIS data in China during 2001~2006 (a) 2001; (b) 2002; (c) 2003; (d) 2004; (e) 2005; (f) 2006
1517
Sun et al. / J Zhejiang Univ Sci A 2009 10(10):1509-1522
regions are not stable year by year and because not all paddy fields on land use maps might be planted with rice. Therefore, land use maps cannot be used to test the MODIS-derived results. However, China’s governments did not carry out this work, taking into consideration the economic benefits and sustainability, so no detailed yearly spatial distribution maps of single, early and late rice are available to check the results derived from MODIS data. Therefore, the areal accuracy of the MODIS-derived results was tested compared with the agricultural statistics in 2001~2006 to show the effect. Relative errors in area are 9%~27% for single rice, 3%~16% for early rice, 2500
RMSE=289 RMSE=289 n=28
MODIS-derived (×103 hm2)
2000
1:1
and 4%~21% for late rice on the national scale in China according to the analytical results, while obvious discrepancies could be seen on the provincial scale from the scatter plots shown in Figs.7~9 for single, early, and late rice, respectively. Therefore, we made further analyses of the results by a statistical hypothesis significance test to show whether the discrepancies can be acceptable statistically. Because the sample sizes are small, we tested the two groups by paired-sample t-test at the significance level of 0.05. The results are shown in Table 2. The analyses showed that the MODIS-derived results and the agricultural statistics have significant correlations 1:1
RMSE=271 RMSE=271 n=28
RMSE=402 n=28
1:1
1500 1000 500
(b)
(a)
(c)
0
2500
RMSE=424 RMSE=424 n=28
2000
RMSE=377 RMSE=377 n=28
1:1
RMSE=294 RMSE=294 n=28
1:1
1:1
1500 1000 500 0
(d) 0
500
1000
1500
2000
(f)
(e) 2500
0
500 1000 1500 2000 2500
0
500 1000 1500 2000 2500
Statistics (×103 hm2)
Fig.7 Correlations between MODIS-derived results and agricultural statistics on the provincial scale for single rice (a) 2001; (b) 2002; (c) 2003; (d) 2004; (e) 2005; (f) 2006 2500
MODIS-derived (×103 hm2)
2000
RMSE=448 RMSE=448 n=14
RMSE=340 RMSE=340 n=14
1:1
RMSE=411 RMSE=411 n=14
1:1
1:1
1500 1000 500
(a)
(c)
(b)
0
2500 2000
RMSE=311 RMSE=311 n=14
RMSE=278 RMSE=278 n=14
1:1
RMSE=369 RMSE=369 n=14
1:1
1:1
1500 1000 500 0 0
(d) 500 1000 1500 2000 2500
(f)
(e) 0
500 1000 1500 2000 2500 3
0
500 1000 1500 2000 2500
2
Statistics (×10 hm )
Fig.8 Correlations between MODIS-derived results and agricultural statistics on the provincial scale for early rice (a) 2001; (b) 2002; (c) 2003; (d) 2004; (e) 2005; (f) 2006
1518
Sun et al. / J Zhejiang Univ Sci A 2009 10(10):1509-1522
2500
RMSE=338 RMSE=338 n=16
2000
1:1
RMSE=321 RMSE=321 n=16
1:1
RMSE=192 RMSE=192 n=16
1:1
MODIS-derived (×103 hm2)
1500 1000 500
(b)
(a)
(c)
0 2500
RMSE=268 RMSE=268 n=16
2000
RMSE=258 RMSE=258 n=16
1:1
RMSE=254 RMSE=254 n=16
1:1
1:1
1500 1000 500
(e)
(d)
0 0
500 1000 1500 2000 2500
0
(f)
500 1000 1500 2000 2500 Statistics (×103 hm2)
0
500 1000 1500 2000 2500
Fig.9 Correlations between MODIS-derived results and agricultural statistics on the provincial scale for late rice (a) 2001; (b) 2002; (c) 2003; (d) 2004; (e) 2005; (f) 2006
Table 2 Significance analyses between the MODIS-derived results and the agricultural statistics on the provincial scale by paired-sample t-test at the level of 0.05 Year
Single rice
Early rice
Late rice
t
Threshold
Significance
t
Threshold
Significance
t
Threshold
Significance
2001
3.072
1.703
No
0.053
1.771
Yes
1.169
1.753
Yes
2002
0.378
1.703
Yes
0.636
1.771
Yes
0.783
1.753
Yes
2003
0.736
1.703
Yes
0.556
1.771
Yes
0.912
1.753
Yes
2004
0.638
1.703
Yes
0.921
1.771
Yes
1.393
1.753
Yes
2005
1.805
1.703
No
0.458
1.771
Yes
1.013
1.753
Yes
2006
1.171
1.703
Yes
0.039
1.771
Yes
1.309
1.753
Yes
except for single rice in 2001 and 2005. The results also demonstrated that the overall accuracy might be better in a very large region, because the errors of underestimation and overestimation might offset each other. However, the sources of the errors in the results need to be analyzed further. 2. Spatial matching examination To test the spatial matching of the MODISderived results, a typical test region in Heilongjiang and Jilin provinces, was selected in the study. Rice fields in the test region were classified using two neighboring Landsat-7 ETM+ images with 30 m spatial resolution collected on Aug. 13, 2001 (Path/Row: 117/029) and Sept. 21, 2001 (Path/Row: 118/029). Comparison between the two results is
shown in Fig.10. The MODIS-derived rice area was 300 408 hm2, and the ETM+-derived area was 316 077 hm2 in the region, so the two results were very close. Then the two results were overlaid to examine the spatial agreement, and it showed that the area of the common parts was 218 283 hm2, which accounted for 72.7% of the MODIS-derived area and 69.1% of the ETM+-derived one. Moreover, rice purity in each 500 m×500 m MODIS pixel was calculated on the hypothesis that the ETM+-derived result was the ‘ground truth’ for testing the problem of mixed pixels in MODIS data (Fig.11). It was indicated that the accuracy relied on the purity of rice in a MODIS pixel. The higher the purity, the higher the accuracy.
1519
Sun et al. / J Zhejiang Univ Sci A 2009 10(10):1509-1522
N 30°
20°
(a)
(b)
(c)
(e)
(f)
N 30°
20°
(d) 110°
100°
120° E 100°
National boundaries
120° E 100°
110°
Provincial boundaries
110°
120° E
Rice
Coastlines
Fig.6 Spatial distribution of late rice derived from MODIS data in China during 2001~2006 (a) 2001; (b) 2002; (c) 2003; (d) 2004; (e) 2005; (f) 2006 N
N
0
Rice 25 50 km
0
Rice 25 50 km
(b)
(a)
Fig.10 Comparison between the MODIS-derived result (a) and the ETM+-derived result (b) in the typical test region N
0
25
Rice proportion 0.00~0.25 0.25~0.50 50 km 0.50~0.75 0.75~1.00
Fig.11 Proportion of paddy rice in each 500 m×500 m MODIS pixel The purity was graded into four levels. At the level of 0.00~0.25, only 9.4% was classified as rice; at the level of 0.25~0.50, 34.2% was classified as rice; at the level of 0.50~0.75, 52.1% was classified as rice; at the level of 0.75~1.00, 82.3% was classified as rice
1520
Sun et al. / J Zhejiang Univ Sci A 2009 10(10):1509-1522
DISCUSSION AND CONCLUSION In the study, we analyzed the time series of MODIS data and obtained the algorithms for rice identification. The areal and spatial validations showed that the algorithms were useful to classify rice using MODIS data. Though the algorithms in the study could avoid uncertainties as far as possible, discrepancies still exist in the MODIS-derived results. We attempted to analyze the factors that might cause errors in the results. The factors are depicted as follows. Firstly, clouds and their shadows in the images have a great impact on the results, because all cloud contaminated pixels in the flooding and transplanting period are removed in the rice identifying algorithms due to their unreliability, so cloud contamination is a big source that can cause errors of omission. To reveal the impact of cloud contamination in the results, pixels contaminated by clouds and their shadows in the flooding and transplanting period were detected in each county according to the rice growth calendar. Detected results in the years 2001~2006 showed that in some counties of Guizhou, Sichuan, Chongqing, and southern Hunan, cloud contaminated pixels accounted for 30%~60%, or even more, in the flooding and transplanting period of single rice, while in the counties of Guangxi and southern Guangdong, cloud contaminated pixels accounted for about 20%~50%, or even more, in the flooding and transplanting period of early rice and late rice. Therefore, MODIS data are not suitable for rice identification in the regions with frequent heavy clouds in the flooding and transplanting period. Secondly, though MODIS has two 250-m spatial resolution bands (Bands 1 and 2), paddy rice fields were extracted mainly by identifying the characteristics of high soil moisture and low vegetation cover in the flooding and transplanting period, so the spatial resolution of the results depends on the water sensitive bands. That is, it depends on Band 6 with 500-m spatial resolution used in LSWI. However, the 500-m spatial resolution of MODIS data might be too coarse for some fields, for MODIS is unable to distinguish the details. The accuracy relied on the purity of rice in a MODIS pixel, as shown in the spatial matching validation. Typically, rice fields in China are small and the structures are complicated because of topography restrictions and individual management. Actually, the reflectance
recorded by MODIS is the integration of rice fields and the background in most regions, so mixed pixels are popular in MODIS images. The characteristics of paddy rice fields might not be identified correctly because of the strong interference of the background. In the plain regions, paddy rice fields are usually large in size and homogeneous in structure, even for the small fields, and the contiguous ones can also form big fields. There are more relatively ‘pure’ rice pixels in these regions, so rice fields could be extracted easily from the images, while in the hilly regions rice fields are usually small in size owing to the restrictions of topography, and the reflectance of rice fields is badly integrated with objects in the vicinity. The extracted results depend on the background, so both errors of omission and commission might be big in these regions. It is a big challenge to achieve rice identification in hilly regions using MODIS data. Thirdly, though the wetlands or other irrigated croplands could be removed by our algorithms if the plant calendars in these fields are different from the rice calendar, they might be identified as rice fields if they have the same calendars as rice, so the results might overestimate the planted area. The above mentioned three factors are the major ones that cause errors in the results, where the first two are with respect to the MODIS data, and the third is with respect to the algorithms we used. Therefore, for more detailed information, sensors with high spatial resolution are necessary, and microwave sensors might be more useful if we want to obtain rice information in the regions with serious cloud contamination. The third factor is difficult to solve if the algorithms are merely based on soil moisture identification; this issue can be avoided by identifying the textures using images with fine spatial resolution. Another method for solving the problem is to use accurate land use maps with detailed rice fields to mask the non-paddy fields. The MODIS-derived results in the study have relatively serious errors in some regions due to some inevitable factors like cloud contamination and mixed pixels caused by the coarse spatial resolution, as well as the flaws in the extraction algorithms, so the results are unsuitable for monitoring the inter-annual variations of the rice planted area because of their low accuracy. However, they are still useful for obtaining spatial distribution sketch maps on a large scale if no such work has been done before, and they might
Sun et al. / J Zhejiang Univ Sci A 2009 10(10):1509-1522
provide valuable reference for further studies using other data or other methods. For example, they could provide the spatial distribution of clouds together with maps of rice fields. The results might guide the researchers to those places where radar data are needed to avoid the impact of cloud contamination, and the results might be useful if associated with land use maps and topography maps for choosing images with high spatial resolution. Moreover, the advantages of large and frequent coverage as well as the low cost of MODIS data could make up for the disadvantages of coarse spatial resolution, so they are significant in the applications of rice identification on a large scale, especially in plain regions with few clouds during the crucial period of flooding and transplanting. In the future more studies need to be done to analyze the issue of mixed pixels in MODIS data and to obtain more accurate rice information in different regions.
ACKNOWLEDGEMENTS The MODIS data used in the study are distributed by the Land Processes Distributed Active Archive Center (LP DAAC), located at the U.S. Geological Survey (USGS) Center for Earth Resources Observation and Science (EROS) (http://www. lpdaac.usgs.gov); the SRTM elevation data are provided by the Global Land Cover Facility (GLCF) (http://www.landcover.org); the rice growth calendar data are provided by National Meteorological Bureau of China. We are very grateful for their generous support. We also thank the two anonymous reviewers for their valuable comments. References CEPD (Council for Economic Planning and Development), 2006. Taiwan Statistical Data Book 2006. Council for Economic Planning and Development, Taipei. Chen, J., Jönsson, P., Tamura, M., Gu, Z., Matsushita, B., Eklundh, L., 2004. A simple method for reconstructing a high-quality NDVI time-series data set based on the Savitzky-Golay filter. Remote Sensing Environ., 91(3-4): 332-344. [doi:10.1016/j.rse.2004.03.014] Cihlar, J., 1996. Identification of contaminated pixels in AVHRR composite images for studies of land biosphere. Remote Sensing Environ., 56(3):149-153. [doi:10.1016/ 0034-4257(95)00190-5]
ECCAY (Editorial Committee of China Agriculture Yearbook),
1521
2006. China Agriculture Yearbook 2006. China Agricultural Press, Beijing (in Chinese). Fang, H., Wu, B., Liu, H., Huang, X., 1998. Using NOAA AVHRR and Landsat TM to estimate rice area year-by-year. Int. J. Remote Sensing, 19(3):521-525. [doi:10.1080/014311698216134]
Fensholt, R., Sandholt, I., 2003. Derivation of a shortwave infrared water stress index from MODIS near- and shortwave infrared data in a semi-arid environment. Remote Sensing Environ., 87(1):111-121. [doi:10.1016/j.rse. 2003.07.002]
Gao, B.C., 1996. NDWI: a normalized difference water index for remote sensing of vegetation liquid water from space. Remote Sensing Environ., 58(3):257-266. [doi:10.1016/ S0034-4257(96)00067-3]
Groten, S.M.E., 1993. NDVI: crop monitoring and early yield assessment of Burkina Faso. Int. J. Remote Sensing, 14(8):1495-1515. [doi:10.1080/01431169308953983] Hong, S.Y., Lee, K.S., Rim, S.K., Kim, K.U., 1999. Estimation of Rice Field Area Using Two-date Landsat TM Images in Korea. Proc. IEEE Int. Geoscience and Remote Sensing Symp., 2:732-734. [doi:10.1109/IGARSS.1999.774422] Huete, A.R., Liu, H.Q., Batchily, K., van Leeuwen, W., 1997. A comparison of vegetation indices global set of TM images for EOS-MODIS. Remote Sensing Environ., 59(3):440-451. [doi:10.1016/S0034-4257(96)00112-5] Huete, A.R., Didan, K., Miura, T., Rodriguez, E., Gao, X., Ferreira, L., 2002. Overview of the radiometric and biophysical performance of the MODIS vegetation indices. Remote Sensing Environ., 83(1-2):195-213. [doi:10.1016/ S0034-4257(02)00096-2]
Jönsson, P., Eklundh, L., 2004. TIMESAT: a program for analyzing time-series of satellite sensor data. Comput. & [doi:10.1016/j.cageo.2004.05. Geosci., 30(8):833-845. 006]
Li, C., Qiu, J., Frolking, S., Xiao, X., Salas, W., Moore, B., Boles, S., Huang, Y., Sass, R., 2002. Reduced methane emissions from large-scale changes in water management of China’s rice paddies during 1980-2000. Geophys. Res. Lett., 29(20):1972. [doi:10.1029/2002GL015370] Li, Y., Liao, Q., Li, X., Liao, S., Chi, G., Peng, S., 2003. Towards an operational system for regional-scale rice yield estimation using a time-series of Radarsat ScanSAR images. Int. J. Remote Sensing, 24(21):4207-4220. [doi:10. 1080/0143116031000095970]
MacDonald, R.B., Hall, F.G., 1980. Global crop forecasting. Science, 208(4445):670-679. [doi:10.1126/science.208. 4445.670]
McCloy, K.R., Smith, F.R., Robinson, M.R., 1987. Monitoring rice areas using Landsat MSS data. Int. J. Remote Sensing, 8(5):741-749. [doi:10.1080/01431168708948685] Nageswara Rao, P.P., Rao, V.R., 1987. Rice crop identification and area estimation using remotely sensed data from Indian cropping patterns. Int. J. Remote Sensing, 8(4):639650. [doi:10.1080/01431168708948670] Neue, H., Boonjawat, J., 1998. Methane Emissions from Rice Fields. In: Galloway, J., Melillo, J. (Eds.), Asian Change
1522
Sun et al. / J Zhejiang Univ Sci A 2009 10(10):1509-1522
in the Context of Global Climate Change. IGBP Book Series. Cambridge University Press, Cambridge, UK, p.187-209. Okamoto, K., Kawashima, H., 1999. Estimation of riceplanted area in the tropical zone using a combination of optical and microwave satellite sensor data. Int. J. Remote Sensing, 20(5):1045-1048. [doi:10.1080/014311699213 091]
Ribbes, F., le Toan, T., 1999. Rice field mapping and monitoring with RADARSAT data. Int. J. Remote Sensing, 20(4):745-765. [doi:10.1080/014311699213172] Roy, D.P., Borak, J.S., Devadiga, S., Zheng, M., Descloitres, J., 2002. The MODIS land product quality assessment approach. Remote Sensing Environ., 83(1-2):62-76. [doi:10.1016/S0034-4257(02)00087-1]
Sakamoto, T., Yokozawa, M., Toritani, H., Shibayama, M., Ishitsuka, N., Ohno, H., 2005. A crop phenology detection method using time-series MODIS data. Remote Sensing Environ., 96(3-4):366-374. [doi:10.1016/j.rse.2005.03. 008]
Savitzky, A., Golay, M.J.E., 1964. Smoothing and differentiation of data by simplified least squares procedures. Anal. Chem., 36(8):1627-1639. [doi:10.1021/ac60214a047] Sellers, P.J., Tucker, C.J., Collatz, G.J., Los, S.O., Justice, C.O., Dazlich, D.A., Randall, D.A., 1994. A global 1° by 1° NDVI data set for climate studies: Part II. The generation of global fields of terrestrial biophysical parameters from the NDVI. Int. J. Remote Sensing, 15(17):3519-3545. [doi:10.1080/01431169408954343]
Shao, Y., Fan, X., Liu, H., 2001. Rice monitoring and production estimation using multitemporal RADARSAT. Remote Sensing Environ., 76(3):310-325. [doi:10.1016/ S0034-4257(00)00212-1]
Tennakoon, S.B., Murty, V.V.N., Eiumnoh, A., 1992. Estimation of cropped area and grain yield of rice using remote
sensing data. Int. J. Remote Sensing, 13(3):427-439. [doi:10.1080/01431169208904047]
Turner, M.D., Congalton, R.G., 1998. Classification of multi-temporal SPOT-XS satellite data for mapping rice fields on a West African flood plain. Int. J. Remote Sensing, 19(1):21-41. [doi:10.1080/014311698216404] van der Gon, H.D., 2000. Changes in CH4 emission from rice fields from 1960s to 1990s: 1. Impacts of modern rice technology. Glob. Biogeochem. Cycles, 14(1):61-72. [doi:10.1029/1999GB900096]
Viovy, N., Arino, O., Belward, A., 1992. The best index slope extraction (BISE): a method for reducing noise in NDVI time-series. Int. J. Remote Sensing, 13(8):1585-1590. [doi:10.1080/01431169208904212]
Xiao, X., Boles, S., Frolking, S., Salas, W., Moore, B., Li, C., He, L., Zhao, R., 2002a. Landscape-scale characterization of cropland in China using Vegetation and Landsat TM images. Int. J. Remote Sensing, 23(18):3579-3594. [doi:10.1080/01431160110106069]
Xiao, X., Boles, S., Frolking, S., Salas, W., Moore, B., Li, C., He, L., Zhao, R., 2002b. Observation of flooding and rice transplanting of paddy rice fields at the site to landscape scales in China using Vegetation sensor data. Int. J. Remote Sensing, 23(15):3009-3022. [doi:10.1080/014311 60110107734]
Xiao, X., Boles, S., Liu, J., Zhuang, D., Frolking, S., Li, C., Salas, W., Moore, B., 2005. Mapping paddy rice agriculture in southern China using multi-temporal MODIS images. Remote Sensing Environ., 95(4):480-492. [doi:10.1016/j.rse.2004.12.009]
Xiao, X., Boles, S., Frolking, S., Li, C., Babu, J.Y., Salas, W., Moore, B., 2006. Mapping paddy rice agriculture in South and Southeast Asia using multi-temporal MODIS images. Remote Sensing Environ., 100(1):95-113. [doi:10.1016/j. rse.2005.10.004]