Abstract. The response of beryllium to dynamic loading has been extensively studied, both experimentally and theoretically, due to its importance in several ...
MOLECULAR DYNAMICS SIMULATION OF DYNAMIC RESPONSE OF BERYLLIUM Aidan P. Thompson∗ , J. Matthew D. Lane∗ and Michael P. Desjarlais∗ ∗
Sandia National Laboratories, Albuquerque, New Mexico 87185, USA
Abstract. The response of beryllium to dynamic loading has been extensively studied, both experimentally and theoretically, due to its importance in several technological areas. We use a MEAM empirical potential to examine the melt transition. MD simulations of equilibrated two-phase systems were used to calculate the HCP melting curve up to 300 GPa. This was found to agree well with previous ab initio calculations. The Hugoniostat method was used to examine dynamic compression along the two principal orientations of the HCP crystal. In both directions, the melting transition occurred at 230 GPa and 5000 K, consistent with the equilibrium melting curve. Direct NEMD simulations of uniaxial compression show a transition to an amorphous material at shocked states that lie below the equilibrium melt curve. Keywords: Molecular dynamics, MEAM, thermodynamic and mechanical properties PACS: 02.70.Ns, 62.50.+p.
EQUILIBRIUM CALCULATIONS The dynamic response of solid beryllium up to and including the melt transition is of considerable technological importance. At ambient conditions, beryllium is a crystalline metal, but exhibits a variety of unusual properties, such as very low Poisson ratio and non-ideal hexagonal crystal aspect ratio. Many of these anomalies are probably due to the presence of directional bonding not normally found in metals [1, 2]. To study the behavior of beryllium under dynamic loading, we recently developed a new parameterization of the MEAM empirical potential [3], which we refer to as Ba09i. This parameterization was fit to properties of the HCP crystal at ambient conditions, the hydrostatic compression curve up to 200 GPa, and the melting temperature of beryllium at low pressure. These quantities and the MEAM predictions are summarized in Table 1. In this work, we extended the low-pressure melting point calculation to the entire melting curve up to a pressure of 300 GPa and a temperature of 5450 K. The intersection of the principal Hugoniot with this melting curve provides an estimate of where shock-
melting is expected to occur. To calculate the melting temperature at different pressures, we employed the two-phase coexistence method. We used the procedure described in our previous work to construct a 2,048 atom system containing a slab of HCP crystal sandwiched between layers of liquid. A Langevin thermostat was used to maintain an average temperature of 1390 K, the previously established ambient melting point. The three periodic cell dimensions were coupled to independent Berendsen barostats, so as to maintain zero average stress in the three principal directions. Starting from this equilibrated state, we ran a short (2.5 ps) MD simulation during which the barostat set pressure was ramped from zero to 10 GPa and the thermostat set temperature was ramped from 1350 K to 1700 K. The latter value was found by trial and error to prevent either rapid freezing or melting of the sample. This was followed by a longer (25 ps) MD simulation at the final set points of the thermostat and barostat. Starting from this equilibrated state, several 25 ps MD simulations were performed at slightly higher and lower temperatures. The growth of the solid or liquid phase was observed by monitoring the average potential energy per atom
TABLE 1. Comparison of experimental and calculated properties using the Ba09i MEAM interatomic potential [3].
B C11 C33 C12 C13 C44 C66 υ c/a M.P.
[GPa] [GPa] [GPa] [GPa ] [GPa ] [GPa] [GPa] [Å3 ] [–] [K]
Expt.
Ba09i
117 294 357 27 14 162 133 16.2 1.57 1550
115 259 329 77 9 65 91 16.1 1.62 1390
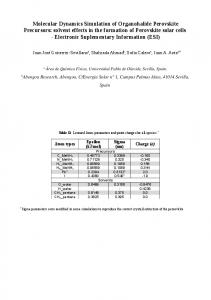
as a function of time. In this way, a robust estimate of the equilibrium melting temperature could be obtained. The procedure was repeated for pressures of 20, 40, 70, 100, 150, 200, 250, and 300 GPa. In each case, the starting point was an equilibrated state at the previous pressure. The MD timestep was 0.125 fs, the thermostat relaxation time was 100 fs, and the barostat relaxation rate was 0.01 fs−1 GPa−1 . All calculations were performed using the LAMMPS molecular dynamics package [4, 5]. Fig. 1 (top) shows the potential energy trajectories used to estimate the melting point at 150 GPa. At 4100 K, all of the liquid layer freezes in about 10 ps. Conversely, at 4400 K, all of the solid melts in about the same time. These results provide reliable upper and lower bounds on the melting point. In the simulation at 4200 K, the solid slab appears to be slowly melting. Linear regression of melting/freezing rate versus temperature predicted zero melting rate at a temperature of 4170 K. The simulation at this temperature verified that the net melting is indistinguishable from zero after 25 ps. Fig. 1(bottom) shows a snapshot taken from the final trajectory at 300 GPa, confirming that the two-phase structure (HCP and liquid) was preserved throughout the entire set of simulations. The full set of estimated melting points are plotted in Fig. 3. The agreement with the previous estimates using DFT [6] and a recently published equation of state [2] is surprisingly good.
E [eV/atom]
Quantity
-2.0
Heating/Compression Ramp Equilibration (4250 K) 4400 K 4200 K 4170 K 4100 K
-2.1
-2.2 0
10
20
30 t [ps]
40
50
60
FIGURE 1. Top: Variation of potential energy during two-phase calculations at 150 GPa; Bottom: Visualization of configuration from two-phase simulation at 300 GPa and 5450 K. Atoms are colored by the value of their centrosymmetry parameter φ [7], green/dark indicating φ < 3.8, yellow/light indicating φ > 3.8. [color online]
DYNAMIC RESPONSE In order to efficiently survey the dynamic response of beryllium as represented by the Ba09i potential, we have used uniaxial Hugoniostat MD simulations. The method is that of Selezenev et al. [9], and is similar to the NPzz Hug method developed by Ravelo et al. [10]. The primary difference is that instead of controlling temperature and pressure using integral feedback with damping (akin to the NoséHoover thermostat), we use linear feedback (akin to the Berendsen thermostat). Beginning with an equilibrated HCP crystal, consisting of a 10 × 10 × 10 supercell of the 4–atom HCP unit cell, the system was uniaxially compressed to a specified axial stress while scaling the atom velocities to meet the Rankine-Hugoniot jump conditions. The compression rise time was 10 ps, while the total duration of each simulation was 50 ps. The average final volume, temperature and stress tensor were obtained from the final 5 ps of the simulation. An MD
300
5000 Temperature [K]
250
6000 Experimental (Marsh) Ba09i a-axis
P [GPa]
200 150 100
1.2
1.4
ρ/ρ0
1.6
1.8
5000 Temperature [K]
P [GPa]
2000
50
100
150 200 P [GPa]
250
300
150 200 P [GPa]
250
300
6000 Experimental (Marsh) Ba09i c-axis
200 150 100
Ba09i c-axis DFT DFT Melt Line EOS Benedict et al. Two-phase MD
4000 3000 2000 1000
50 0 1
3000
0 0
2
300 250
4000
1000
50 0 1
Ba09i a-axis DFT DFT Melt Line EOS Benedict et al. Two-phase MD
1.2
1.4
ρ/ρ0
1.6
1.8
2
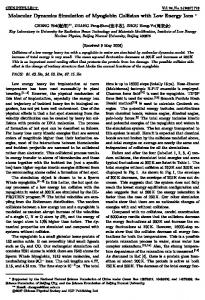
FIGURE 2. Plot of axial stress versus compression ratio from Hugoniostat MD simulations (diamonds) of uniaxial compression along the a-axis (top) and c-axis (bottom) crystal orientations, compared to experimental data for polycrystalline beryllium (crosses) [8]. The horizontal dashed lines indicate the location of the melt pressure in the MD simulations.
timestep of 0.5 fs was used. Except for the case of elastic-plastic shockwaves occuring at intermediate shock strengths, the final states from these Hugoniostat simulations can be expected to closely match those obtained from direct NEMD simulation of a shockwave travelling through a long sample. In Fig. 2 we show axial stress for different degrees of compression oriented along the a-axis (top) and c-axis (bottom). For both orientations, we see qualitatively similar results. A smoothly increasing initial elastic response at low shock strength is followed by a rather jumpy plastic response at higher shock strengths, and finally a smoothly increasing re-
0 0
50
100
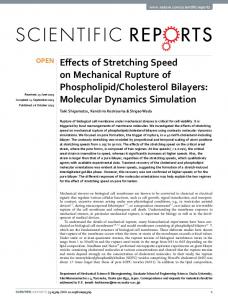
FIGURE 3. Plot of temperature versus axial stress from Hugoniostat MD simulations (diamonds) of uniaxial compression along the a-axis (top) c-axis (bottom) crystal orientations. The vertical dashed lines indicate the location of the melt pressure in the MD simulations. Also shown is the equilibrium melting curve for the Ba09i potential (circles), DFT calculations of HCP and liquid Hugoniot states [6], the melting line estimated from these calculations, and the melting line from the equation of statte of Benedict et al. [2]
sponse at the highest shock strengths corresponding to molten beryllium. The elastic-plastic transition, or Hugoniot elastic limit (HEL), occurs at much higher shock strengths than is observed in experiments on polycrystalline beryllium [8], where the HEL is less than 1 GPa. This is to be expected, since the usual mechanisms for initiating plasticity, pre-existing defects and grain boundaries, are absent from the simulations. The location of the melting transition is indicated by the horizontal dashed line.
The melting transition is more apparent in Fig. 3, where we have plotted axial stress versus temperature. For both orientations, we observe a drop in temperature at the melting point (indicated by the vertical dashed lines), corresponding to a jump from the solid Hugoniot to a point on the liquid Hugoniot. This transition occurs at the same temperature and pressure for both orientations (4500-5500 K, 225230 GPa). The solid Hugoniot extends to somewhat above the equilibrium melting curve, which is consistent with a small amount of superheating. The liquid Hugoniot begins below the equilibrium melting curve, indicating that the liquid is slightly supercooled. For both orientations, the solid and liquid Hugoniot points near the melting transition fall quite close to previous DFT calculations [6]. This indicates that the Ba09i potential quite accurately captures the potential energy surface of HCP and liquid beryllium over the entire range of pressures from 0 to 300 GPa. Nonequilibrium molecular dynamics (NEMD) simulations were conducted to further investigate the beryllium shock response. Shock waves were driven by a warm momentum mirror with a weak co-moving Langevin damping region in the 5 Å ahead of the piston. The 23Å x 39Å x 3706Å sample was initially thermalized at 300 K and had periodic boundary conditions in the directions transverse to the shock propagation. The free surface opposite the piston was frozen to prevent surface relaxation. The simulation duration depended on the speed of shock propagation, but was typically on the order of tens of picoseconds. Simulations were run on 1600 processors of Sandia’s Red Sky supercomputer for four days per Hugoniot point. The shock strength was controlled by setting the piston velocity, which was held constant throughout the simulations. Piston velocities ranged from 1 km/s to 8 km/s. The NEMD showed good agreement with Hugoniostat calculations at piston velocities below 5 km/s and above 7 km/s. These ranges correspond to the elastic regime (below 5 km/s) and the shock melting regime (above 7 km/s). However, in the middle range qualitatively different response was observed in the NEMD simulations. Specifically, an amorphous structure developed in the NEMD simulations. The material remained crystalline in the Hugoniostat simulations. The amorphous material was initially believed to represent a melt transition, but diffusion, stress and temperature calculations are more
consistent with an amorphous solid. The differing responses between the two methods are not yet fully understood, although they appear to be related to the rate of compression. For the 4 km/s and 5 km/s shocks, systems with twice and half the transverse dimensions were shown to produce similar response. Further study will be required to determine the cause, nature and validity of these solid amorphous states. In conclusion, we have presented results of dynamic melt transition simulations for a recently proposed interatomic potential for Beryllium. We found that these two-phase calculations agreed well with previous ab initio calculations. Hugoniostat methods were employed which indicate shock melting at 230 GPa and 5000 K, consistent with the equilibium melting curve. NEMD simulations support these results at both high and low shock strengths, but indicate an intermediate amorphous solid state, which requires further study. ACKNOWLEDGMENTS This work was supported by the Laboratory Directed Research and Development program at Sandia National Laboratories. Sandia is a multiprogram laboratory operated by Sandia Corporation, a Lockheed Martin Company, for the United States Department of Energy’s National Nuclear Security Administration under Contract DE-AC04-94AL85000. REFERENCES 1. 2. 3. 4. 5. 6. 7. 8. 9.
Feibelman, P. J., and Stumpf, R., Phys. Rev. B, 50, 17480 (1994). Benedict, L., Ogitsu, T., Trave, A., Wu, C., Sterne, P., and Schwegler, E., Phys. Rev. B, 79, 064106 (2009). Thompson, A. P., Lane, J. M. D., Desjarlais, M. P., and Baskes, M. E., Shock Compression in Condensed Matter, AIP Proc., 1195, 833 (2009). LAMMPS MD code http://lammps.sandia.gov. Plimpton, S. J., J. Comp. Phys., 117, 1 (1995). Desjarlais, M., Knudson, M., and Lemke, R., Personal Communication (2009). Kelchner, C. L., Plimpton, S. J., and Hamilton, J. C., Phys. Rev. B, 58, 11085 (1998). Marsh, S. P., editor, LASL Shock Hugoniot Data, University of California Press, 1980. Selezenev, A. A., Aleynikov, A. Y., Ganchuk, N. S., Ermakov, P., Ganchuk, S. N., Aidun, J. B., and Thompson, A. P., Shock Compression in Condensed Matter, AIP Proc., 1195, 821 (2009).
10. Ravelo, R., Holian, B. L., Germann, T. C., and Lomdahl, P. S., Phys. Rev. B, 70, 014103 (2004).