simple alternative schemes. I. INTRODUCTION .... existing instantaneous monitoring approaches and simple al- ternative ..... and local violation also provide past vi values. After a ...... ing,â http://www.cc.gatech.edu/â¼smeng/WISE.pdf, 2008.
Monitoring Continuous State Violation in Datacenters: Exploring the Time Dimension Shicong Meng, Ting Wang, Ling Liu College of Computing, Georgia Institute of Technology {smeng, twang, lingliu}@cc.gatech.edu Abstract— Monitoring global states of an application deployed over distributed nodes becomes prevalent in today’s datacenters. State monitoring requires not only correct monitoring results but also minimum communication cost for efficiency and scalability. Most existing work adopts an instantaneous state monitoring approach, which triggers state alerts whenever a constraint is violated. Such an approach, however, may cause frequent and unnecessary state alerts due to unpredictable monitored value bursts and momentary outliers that are common in large-scale Internet applications. These false alerts may further lead to expensive and problematic counter-measures. To address this issue, we introduce window-based state monitoring in this paper. Window-based state monitoring evaluates whether state violation is continuous within a time window, and thus, gains immunity to short-term value bursts and outliers. Furthermore, we find that exploring the monitoring time window at distributed nodes achieves significant communication savings over instantaneous monitoring. Based on this finding, we develop WISE, a system that efficiently performs WIndow-based StatE monitoring at datacenter-scale. WISE is highlighted with three sets of techniques. First, WISE uses distributed filtering time windows and intelligently avoids global information collecting to achieve communication efficiency, while guaranteeing monitoring correctness at the same time. Second, WISE provides a suite of performance tuning techniques to minimize communication cost based on a sophisticated cost model. Third, WISE also employs a set of novel performance optimization techniques. Extensive experiments over both real world and synthetic traces show that WISE achieves a 50%-90% reduction in communication cost compared with existing instantaneous monitoring approaches and simple alternative schemes.
I. I NTRODUCTION Today’s Internet applications and services (e.g., email, instant messaging, search, online games, e-commerce) must serve millions of users distributed across the world. To match system performance and scalability with the voluminous demand, service providers usually spread applications over a large number of computing nodes in datacenters. For instance, Amazon’s Elastic Computer Cloud(EC2)[1] can power a web application with hundreds, even thousands, of server instances, which enables the web application to process a sheer amount of user requests simultaneously. While applications are distributedly deployed, their global states still need to be monitored for various purposes. For instance, service providers usually monitor the overall request rate on a web application deployed over multiple hosts, as they want to receive a state alert when the overall request rate exceeds a threshold, e.g. the capacity limit of provisioned hosts.
As another example, service providers who offer software-asa-service to organizations often need to perform distributed rate limiting(DRL) to restrict each organization to use the software within its purchased level (e.g. 100 simultaneous sessions). Because software services are usually deployed over distributed servers in one or multiple datacenters, it requires DRL to check if the total number of running sessions from one organization at all servers is within a certain threshold. We refer to this type of monitoring as state monitoring, which continuously evaluates if a certain aspect of the distributed application, e.g. the overall request rate, deviates from a normal state. State monitoring is widely used in many applications. Table I summaries a few examples. State monitoring in large-scale distributed environments such as datacenters poses two fundamental requirements. First, results of state monitoring must be correct[5]. For instance, if the service provider in the first example receives a state alert, the web application should indeed be overloaded and need more computing resources. This correctness requirement still holds even if monitored values contain momentary bursts and outliers. Second, communication related to state monitoring should be as little as possible[6], [7], [8]. Datacenters usually run a large number of state monitoring tasks for application and infrastructure management[1]. As monitoring communication consumes both bandwidth and considerable CPU cycles[9], state monitoring should minimize communication. This is especially important for infrastructure services such as EC2, as computing resources directly generate revenues. One intuitive state monitoring approach is the instantaneous state monitoring, which triggers a state alert whenever a predefined threshold is violated. This approach, though makes algorithm design easy, idealizes real world monitoring scenarios. As unpredictable short-term bursts in monitored values are very common for Internet applications[10], [11], [12], instantaneous state monitoring may cause frequent and unnecessary state alerts. In the first example, momentary HTTP request bursts trigger unnecessary state alerts whenever their rates exceed the threshold. Furthermore, since state alerts usually invoke expensive counter-measures, e.g. allocating and deploying new web server instances, unnecessary state alerts may cause significant resource loss. Surprisingly, we find most of the existing work to date[13], [14], [15], [16], [17], [18] deals only this type of state monitoring. In this paper, we study a more practical state monitoring approach for Internet applications, namely window-based
Applications Content Delivery Rate Limiting[2] Traffic Engineering[3] Quality of Service[4] Fighting DoS Attack Botnet Detection
Description Monitoring the total access to a file mirrored at multiple servers to decide if serving capacity is sufficient. Limiting a user’s total access towards a cloud service deployed at multiple physical locations. Monitoring the overall traffic from an organization’s sub-network (consists of distributed hosts) to the Internet. Monitoring and Adjusting the total delay of a flow which is the sum of the actual delay in each router on its path. Detecting DoS Attack by counting SYN packets arriving at different hosts within a sub-network. Tracking the overall simultaneous TCP connections from a set of hosts to a given destination.
TABLE I: Examples of State Monitoring state monitoring, in large-scale distributed environments. Since short periods of state violation are well acceptable in many cases, window-based state monitoring triggers state alerts only when observing continuous state violation within a time window. With the persistence checking window, it gains immunity to momentary monitoring value bursts and unpredictable outliers. While window-based state monitoring can be straightforwardly performed in a centralized manner, we find that exploring the monitoring time window at distributed nodes yields significant communication savings. Based on this finding, we develop WISE, a system that performs accurate and efficient WIndow-based StatE monitoring over distributed nodes. WISE is highlighted with three sets of techniques. • WISE employs a novel distributed monitoring algorithm which deploys time windows for message filtering and intelligently avoids global information collecting to achieve communication efficiency. More importantly, it guarantees monitoring correctness. • WISE uses a monitoring parameter tuning scheme based on a sophisticated cost model to choose parameters that minimize communication cost. • The performance of WISE is further optimized by several novel optimization techniques aiming at its subroutines. We conduct extensive experiments over both real world and synthetic monitoring traces, and show that WISE incurs a communication reduction from 50% to 90% compared with existing instantaneous monitoring approaches and simple alternative window based schemes. The rest of this paper is organized as follows. Section II introduces our system model and defines the problem of window based state monitoring. Section III gives an overview of our approach. Section IV presents the detail of the WISE monitoring algorithm and Section V describes the parameter setting scheme. We discuss optimization techniques to further improve the performance of WISE in Section VI. Section VII presents the experimental evaluation. Section VIII discusses related work. We conclude the paper in Section IX with a summary and an outline of our future work. II. P ROBLEM D EFINITION A. System Models We study state monitoring in a general distributed system which consists of a set M of nodes. A state monitoring task can be associated with a set N of nodes where |N | = n, N ⊆ M . Among nodes associated with a state monitoring task, one is selected to be a coordinator which performs global operations such as collecting monitored values from
other nodes and triggering state alerts. This monitor and coordinator nodes setting is common in practice and accords with previous work[13], [14], [15], [16], [17], [18]. Note that our setting also allows multiple monitoring tasks to be executed simultaneously. In this paper, we focus on developing efficient schemes for a single monitoring task. We leave other problems such as load balance and multi-task optimization as our future work. For a given monitoring task, node i locally observes a variable vi which is continuously updated at each time unit 1 . The value of vi at time unit t is vi (t) and we assume vi (t) is correctly observed. When necessary, each monitor node can communicate with the coordinator by sending or receiving messages. We consider that communication is reliable and its delay is negligible in the context of datacenter state monitoring. As communication cost is of concern, we are interested in the total number of messages caused by monitoring. We also consider the size of messages in our experiment. A state monitoring task continuously evaluates a certain monitored state is normal or abnormal. Similar to previous work[13], [14], [15], [16], [17], [18], we distinguish states based on sum aggregate of monitored values. For instance, we determine whether a web application is overloaded based on the sum of HTTP request rates at different hosts. We use sum aggregates because they are widely applied and also simplify our discussion, although our approach supports any aggregate that linearly combines values from nodes. B. The Instantaneous State Monitoring The instantaneous state monitoring model[13], [14], [15], [16], [17], [18] detects state alerts by comparing the current aggregate value with a global threshold. Specifically, given vi (t), i ∈ [1, n] and the global threshold T , it considers the state Pn at time t to be abnormal and triggers a state alert if i=1 vi (t) > T , which we refer to as global violation. To perform instantaneous state monitoring, the line of existing work decomposes the global threshold T into a set of Pnlocal thresholds Ti for each monitor node i such that i=1 Ti 6 T . As a result, as long as vi (t) 6 Ti , ∀i ∈ [1, n], i.e. the monitored value at any node is lower or equal to its local threshold, P Pn the global threshold is satisfied because n v (t) 6 i i=1 i=1 Ti 6 T . Clearly, no communication is necessary in P this case. When vi (t) > Ti on node i, it is n possible that i=1 vi (t) > T (global violation). In this case, node i sends a message to the coordinator to report local violation with the value vi (t). The coordinator, after receiving 1 While we consider v as integer, extending our approach to support float i values is straightforward.
Web Server A
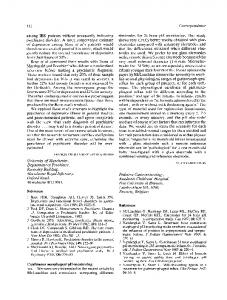
D. A Motivating Example
Request Rate 450
T1
300 150
Time Units
1 2 3 4 5 6 7 8 9 10 11 12 13 14 15 16 17 18
Request Rate
Web Server B
450
T2
300 150 1 2 3 4 5 6 7 8 9 10 11 12 13 14 15 16 17 18
Time Units
Fig. 1: A Motivating Example the local violation report, invokes a global poll procedure where it notifies other nodesPto report their local values, n and then determines whether i=1 vi (t) 6 T . The focus of existing work is to find optimal local threshold values that minimize the overall communication cost. C. The Window-based State Monitoring As monitored values often contain momentary bursts and outliers, instantaneous state monitoring[11] is subject to cause frequent and unnecessary state alerts, which could further lead to unnecessary counter-measures. Since short periods of state violation are often well acceptable, a more practical monitoring model should tolerate momentary state violation and capture only continuous one. Therefore, we introduce window-based state monitoring which triggers state alerts only when the normal state is continuously violated for L time units. We study window-based state monitoring instead of other possible forms of state monitoring for two reasons. First, we believe continuous violation is the fundamental sign of established abnormality. Second, window-based state monitoring tasks are easy to configure, because the window size L is essentially the tolerable time of abnormal state, e.g. degraded service quality, which is known to service providers. Our study in this paper focuses on finding efficient ways to perform distributed window-based state monitoring, as this problem is difficult to solve and, to the best of our knowledge, has not been addressed before. Formally, we define the distributed window-based state monitoring problem as follows: Problem Statement 1: Given the threshold T , the size L of the monitoring window, and n monitor nodes with values vi (t), i ∈ [1, n] at time devise an algorithm that triggers Pt, n state alerts only when i=1 vi (t − j) > T, ∀j ∈ [0, L − 1] at any t while minimizes the associated communication cost. Solving this problem, however, is challenging, as it requires careful handling of monitoring windows at distributed nodes to ensure both communication efficiency and monitoring correctness. Simple solutions such as applying modified instantaneous monitoring approaches either fail to minimize communication or miss state alerts. We next present a motivating example to show the reason as well as some insights into the solution.
Figure 1 shows a snippet of HTTP request rate traces collected from two web servers in a geographically distributed server farm[19], where time is slotted into 5-second units. Let us first consider an instantaneous monitoring task which triggers state alerts when the sum of request rates at two servers exceeds T = 600. For simplicity, we assume server A and B have the same local thresholds T1 = T2 = T /2 = 300, as indicated by dashed lines. A local violation happens when a bar raises above a dashed line, as indicated by bars with red borders. In the example, server A and B report local violation respectively at time unit 2,4,6,14,15, and time unit 3-7, which generates 10 messages. When receives local violation reports, the coordinator invokes global polls at time unit 2,3,5,7,14,15 to collect values from the server that does not report local violation. No global poll is necessary at time unit 4 and 6 as the coordinator knows local values of both servers from their local violation reports. Each global poll includes one message for notification and one message for sending back a local value, and all global polls generate 6 × 2 = 12 messages. Thus, the total message number is 10 + 12 = 22. Now we perform window-based state monitoring to determine whether there exists continuous global violation against T lasting for L = 8 time units. We start with the most intuitive approach, –applying the instantaneous monitoring algorithm. Specifically, a monitor node i still evaluates whether vi (t) > Ti and reports local violation to the coordinator if it is true. P The coordinator then invokes a global poll to determine if vi (t) > T . The only difference is that the coordinator triggers state alerts only when observing continuous global violation of 8 time units. As a result, the communication cost is the same as before, 22 messages. Note that 22 messages are generated for only 2 monitor nodes and all messages have to be processed by the coordinator. Our experiment suggests that the total message number in this scheme grows quickly with increasing monitor nodes. This can cause significant bandwidth and CPU cycle consumption at the coordinator, which limits the scalability of monitoring. In fact, invoking a global poll for every local violation is not necessary. Since state alerts require continuous global violation, the coordinator can delay global polls unless it observes 8 continuous time units with local violation. When it observes a time unit t with no local violation, it can clear all pending global polls, as the violation is not continuous, and thus, avoids unnecessary communication. This modified scheme avoids all 6 global polls, as no local violation exists at time unit 8 and 16. Therefore, by avoiding unnecessary communication at the coordinator side, the total message number is reduced to 10. Reducing communication at monitor nodes is relatively more difficult. One may propose to let each node report the beginning and the end of a continuous local violation period, instead of reporting for each time unit with local violation. This scheme, which we refer to as double-reporting, saves
Node 1 v1
TM
PT PT
Node 2
p2 v2
Filtering Windows
Coordinator
...
p1
TM
...
Node n vn
TM
Termination Message Local Violation Report
TM Skeptical Windows
pn
Parameter Tuning
Global Poll
State Alerts
Staged Global Poll
Notification/ Value Collecting
Reactions
Fig. 2: A High Level Overview of WISE 3 messages on server B by reporting at time 3 and 7, but performs poorly (8 messages) on server A as each violation period costs two messages, even when it is short (e.g. time unit 2, 4, 6). The total message number is still 10. One may also suggest monitor nodes to report only the end of violation period for less communication. This end-reporting scheme, however, fails to ensure monitoring correctness. Assume server A P observes local violation throughout time unit 2-10 and vi (t) > T ∀t ∈ [2, 10]. The coordinator inevitably fails to trigger a state alert at time unit 9 without knowing server A starts to observe local violation at time unit 2. One solution is to lower the granularity of local violation reporting, as approximate information on local violation is often adequate to rule out state alerts. Monitor nodes, after reporting one local violation, can employ message filtering time windows with pre-defined lengths to suppress subsequent local violation reporting messages. For instance, assume both server A and B use 5-time-unit filtering windows. Server A reports local violation at time unit 2, and then enters a filtering window, during which it avoids to report at time unit 4 and 6. Similarly, it reports at time 14 and server B reports once at time 3. At the coordinator side, as filtering windows span 5 time units, the worst case that one reported local violation could imply, is a local violation period of 5 time units. Thus, the worst case scenario indicated by the three reports is global violation in time units 2-7 and 14-18, which suggests no state alert exists. The resulting message number is 3, a 86.36% communication reduction over 22 messages. While the above approach seems promising, devising a complete solution requires answers to several fundamental questions. For instance, How to process reported local violation and filtering windows at the coordinator side to guarantee monitoring correctness? How to tune monitoring parameters, e.g. local threshold and filtering window size, at each node to achieve minimum communication? How to optimize different subroutines, e.g. global poll, to further reduce communication? To answer these questions, we next present WISE, a system that performs accurate and efficient window-based state monitoring over distributed monitor nodes. III. S YSTEM OVERVIEW Figure 2 shows a high level overview of WISE. WISE consists of the WISE monitoring algorithm, monitoring parameter tuning schemes and performance optimization techniques. A. The WISE Monitoring Algorithm The idea behind the WISE monitoring algorithm is to report partial information on local violation series at the monitor node
side to save communication cost. These partial information is then used by the coordinator to determine whether it is possible to have state alerts. The coordinator collects further information only when the possibility of having state alerts can not be ruled out. Specifically, the monitor node side algorithm employs two monitoring parameters, the local threshold Ti and the filtering window size pi . When detects local violation(vi(t) > Ti ), a monitor node i sends a local violation report and starts a filtering window with size pi during which it only records monitored values and does not send violation reports. The coordinator considers a reported local violation at node i as possible continuous local violation spanning pi time units, since it does not know the complete violation information within the corresponding filtering window. It then “merges” possible continuous local violation reported from different nodes into a potential global continuous violation against T , namely skeptical window. The skeptical window holds a nature invariant that no state alert is necessary as long as the length of the skeptical window does not exceed L. The coordinator continuously maintains the skeptical window and tries to rule out the possibility of state alerts based on this invariant. It invokes a global poll to collect complete violation information only when the length of the skeptical window exceeds L. The WISE monitoring algorithm makes two effects to achieve communication efficiency. One is to avoid unnecessary global polls by optimistically delaying global polls, because later observed time units with no local violation indicate that previous continuous global violation does not lead to state alerts. The other is to avoid frequent local violation reporting with monitor node side filtering windows. Filtering windows, when their sizes are properly tuned (as we soon introduce), can save significant communication from reporting long or frequent local violation without noticeably diminishing the chance of ruling out state alerts and avoiding global polls. The WISE monitoring algorithm ensures monitoring correctness because of two reasons. First, the coordinator side algorithm always considers the worst case based on received partial information on local violation series, and thus, ensures no state alert is missed (false negative). In addition, since the coordinator collects complete information on local violation when it can not rule out state alerts based on reported partial information, it never mis-triggers state alerts (false positive) after examining the complete information of local violation. The most distinct feature of the WISE monitoring algorithm is its use of filtering time windows in local violation reporting. The benefits of this filtering windows based reporting are several-fold. First of all, it provides a simple yet flexible way to report partial information on local violation while still gives sufficient information to ensure monitoring correctness. Compared with WISE’s filtering window based reporting, alternative schemes we introduced earlier either fail to achieve communication efficiency, e.g. time-unit-based reporting (efficient only for short violation) and double-reporting (efficient only for long violation), or lead to incorrect monitoring results, e.g. end-reporting.
Second, this filtering window based reporting is adjustable to achieve maximum communication efficiency for different monitoring tasks. As an example, for monitoring tasks with relatively large L, monitor nodes can use filtering windows with larger size to reduce more reporting communication. Last but not the least, different monitor nodes can employ different filtering window sizes to match their observed local violation patterns for the best communication efficiency. For instance, nodes that often observes long-term local violation should employ relatively large filtering windows. B. Parameter Tuning Schemes State monitoring environments are usually heavily diversified. They may involve monitoring tasks with very different monitoring threshold T and time window L, as well as heterogeneous monitored value distributions across different nodes. As a result, monitoring parameters, i.e. Ti and pi , should be properly tuned towards the given monitoring task and monitored value patterns for the best communication efficiency. For instance, if a given state monitoring task tries to capture a very rare event, monitor nodes should employ large filtering windows to deliver coarse information to maximally save communication. As another example, if a node often observes higher monitored values compared with other nodes, it should be assigned with relatively higher Ti accordingly. This type of parameter tuning, however, is significantly more difficult than the corresponding part in instantaneous monitoring, because it requires holistic consideration of both value and time dimensions. Therefore, we develop a sophisticated cost model to capture important performance-related factors and devise a parameter tuning scheme based on this cost model. The parameter tuning scheme explores different parameter settings and chooses the one that the cost model predicts to have the least communication cost. Our cost model is also general enough to model different types of monitoring data. Note that parameter tuning only needs to run once for environment setup, and thus, introduces little overall cost in communication and computation. C. Performance Optimization Window-based state monitoring involves more sophisticated subroutines compared to instantaneous monitoring due to its time dimension. For example, the global poll subroutine used in window based monitoring is quite different from the one used in instantaneous monitoring, because it collects values of multiple time units from monitor nodes. The sophistication of these subroutines creates space for optimization which is also critical for overall communication efficiency. Through careful observation, we devise two novel performance optimization techniques, the staged global poll and the termination message. The staged global poll divides the original global poll process into several stages. Each stage tries to rule out or confirm state alerts based on a fraction of monitored values that would be collected by the original global poll. Since later stages can be avoided if a previous
Notions n vi (t) T Ti L pi τ κ
Meaning The number of total monitor nodes the value of v at node P i at time t the global threshold on i vi (t), ∀t the local threshold at node i the maximum size of the skeptical window the size of the local filtering window at node i the filtering window the skeptical window
TABLE II: Table of Notions stage makes a deterministic decision, staged global poll reduces considerable communication. The termination message deals with “over-reported” local violation periods, which only contain little local violation and may increase the chance of invoking global poll. It tries to remove “over-reported” local violation periods by sending an extra message at the end of a filtering window to indicate real local violation. IV. T HE M ONITORING A LGORITHM A. Algorithm Description 1) The Monitor Node Side: A monitor node i reports partial information of local violation based on two monitoring parameters, local threshold Ti and filtering window size pi . Pn Local thresholds of different nodes satisfy T ≤ T. i i=1 This restriction ensures the sum of monitored values at all nodes does not exceed T if each value is smaller than its corresponding local threshold. The filtering window size is the time length of a filtering time window and is defined over [0, L]. Specifically, filtering windows are defined as follows. Definition 1: A filtering window τ of node i is pi continuous time units during which node i does not send local violation reports even if it observes vi (t) > Ti where t is a time unit within τ . In addition, we use |τ | to represent the remaining length of a filtering window τ , ts (τ ) and te (τ ) to denote the start time and the end time of τ . If pi = 0, ts (τ ) = te (τ ) and |τ | = 0. When a node i detects vi (t) > Ti at time unit t and if it is currently not in a filtering window(|τ | = 0), it sends a local violation report to the coordinator, and then enters a filtering window by setting |τ | = pi . During a filtering window(|τ | > 0), it does not report local violation and decreases |τ | by 1 in every time unit. Node i starts to detect and report violation again only after |τ | = 0. For now, we assume Ti and pi are given for each node. We will introduce techniques for selecting proper values for Ti and pi in Section V. 2) The Coordinator Side: The coordinator side algorithm “reassembles” potential periods of local violation indicated by local violation reports into a potential period of continuous global violation, which we refer to as skeptical window. The skeptical window essentially measures the length of the most recent continuous global violation in the worst case. The coordinator considers reported local violation from node i as continuous local violation lasting pi time units, i.e. assuming filtering windows fully filled with local violation. It concatenates reported filtering windows that overlaps in time into the skeptical window, which is defined as follows:
Definition 2: A skeptical window κ is a period of time consisting of most recent overlapped filtering windows related with reported local violation since last global poll. Initially, the size of a skeptical window |κ| is 0 and its start and end time are set to the time when the monitoring algorithm starts. Given a set of filtering windows T = {τi |i ∈ [1, n]} observed at time t, κ can be updated as follows: ( ts (κ) te (κ) ≥ t ′ ts (κ ) ← (1) t otherwise t + max {te (κ) − t, |τi |} te (κ) ≥ t ∀τi ∈T te (κ′ ) ← (2) max {t, te (τi )} otherwise ∀τi ∈T
where κ′ is the updated skeptical window, ts (·) and te (·) is the start and the end time of a window. In addition, |κ| = te (κ) − ts (κ) + 1. In our motivating example, server A and B with pA = pB = 5 report local violation at time 2 and 3 respectively. The corresponding skeptical window covers both filtering windows as they overlaps, and thus, spans from time 2 to time 7. Figure 3 shows an illustrative example of skeptical windows. When t − ts (κ) = L, it indicates that there may exist continuous local violation for the last L time units (which could lead to continuous global violation of L time units). Thus, the coordinator invokes a global poll to determine whether a state alert exists. The coordinator first notifies all nodes about the global poll, and then, each node sends its buffered vi (t − j), j ∈ [0, t′ ], where 0 < t′ 6 L, to the coordinator in one message. Here t′ depends on how many past values are known to the coordinator, as previous global polls and local violation also provide past vi values. After a global poll, if the coordinator detects continuous global violation of L Pn time units, i.e. i=1 vi (t − j) > T, ∀j ∈ [0, L − 1], it triggers a state alert and set |κ| = 0 before continuing. Otherwise, it updates κ according to received vi . Clearly, the computation cost of both monitor node and coordinator algorithms is trivial. Filtering windows greatly reduce communication on local violation reporting, but may also cause overestimated local violation periods at the coordinator when filtering windows cover time units with no local violation. This, however, rarely leads to less chance of ruling out global polls and noteworthy increased cost in global polls. First, state alerts are usually rare events. With filtering windows, the coordinator still finds enough “gaps”, i.e. time units with no local violation, between reported filtering windows before skeptical window size grows to L. Second, the parameter tuning scheme we introduce later sets proper filtering window sizes so that the saving in local violation reporting always exceeds the loss in global polls. Last but not the least, we also develop a staged global poll procedure in Section VI which significantly reduces communication cost in global polls. B. Correctness The WISE monitoring algorithm guarantees monitoring correctness because of two reasons. First, the coordinator never misses state alerts (false negative), as the skeptical
p3 p2 Timeline
p1 t1+p1-1 t3+p3-1
t1 Coordinator
t1, p1
t2, p2
t3, p3
local violation sceptical window filtering window
Fig. 3: Filtering Windows and Skeptical Windows. window represents the worst case scenario of continuous global violation. Second, the coordinator never triggers false state alerts (false positive) as it triggers state alerts only after examining complete local violation information. Theorem 1 presents the correctness guarantee of the WISE algorithm. Theorem 1: Given a monitoring task (T, L, N ), the WISE algorithm triggers a state alert at time unit t if and only if Pn v (t − j) > T, ∀j ∈ [0, L − 1]. i i=1 Proof: In a filtering window of a node i, there may exist multiple periods of continuous local violation. We use ′ ′ ′ pi1 , pi2 , . . . , pik to denote these periods of local violation ′ ′ ′ ′ where k ∈ [1, pi ]. Let pimax = max{pi1 , pi2 , . . . , pik } be the longest local violation period. Clearly, the filtering window ′ τi (|τi | = pi ) contains pimax , i.e. τi starts at least as early as ′ ′ pimax and ends at least as late as pimax does. We denote this ′ inclusion relation as pi < pimax . If constraints on T and L are violated, then there exists at least one series of local violation periods which overlap with each other and the total length of the overlapped period is ′ L. For any one of such series pi∗ , consider any one of its local violation periods p′i . If p′i is within one filtering window of node i, we have pi < p′i . If p′i spans multiple filtering windows, denoted as p∗i , it is not hard to see p∗i < p′i . Since it is the same for all p′i , all associated filtering windows, Pi∗ , ′ must satisfy Pi∗ < pi∗ . As a result, a global poll is invoked no later than the state alert. The global poll sets κ to the length ′ of observed pi∗ . Similarly, subsequent global polls will keep ′ increasing κ to the length of observed pi∗ until the last global poll which triggers the state alert at time t. The other direction can be proved in a similar way. C. Performance Estimating the general performance of the WISE algorithm is difficult as it depends on the distribution of monitored values and monitoring parameter setting. Therefore, we next compare the communication efficiency between WISE and a perfectly tuned instantaneous monitoring algorithm under an example setting to provide some insights into the performance of WISE. Consider a state monitoring task with n(n > 1) monitor nodes. Assume each Ti is perfectly tuned in the sense that one local violation occurs if and only if a global violation exists. Clearly, this is almost impossible in reality, as local violation does not always lead to global violation and global violation may correspond to multiple local violation. We use these “perfectly” tuned Ti to obtain the optimal performance of the instantaneous monitoring algorithm, so that we can study the lower bound of communication saving of the WISE
algorithm. In addition, as Zipf distribution is often observed in distributed monitoring values[20], we assume the number of continuous local violation across nodes follows a Zipf distribution. Specifically, the probability of detecting continuous 1 1 local violation of i time units is P r(x = i) = HL+1 i+1 , th where HL+1 is the (L + 1) Harmonic number defined by PL+1 HL+1 = j=1 1j . Using Zipf distribution here is to simplify our analysis. In reality, continuous local violation needs not to follow this distribution. Furthermore, let the communication cost of local violation be 1 and that of global polls be n. Theorem 2: Given the above settings, let CI be the communication cost of running the instantaneous monitoring algorithm with perfectly tuned Ti , and let CW be the communication cost of running the WISE algorithm, which uses the same Ti and simply sets pi = 1. The resulting gain in communication cost, given by gain = CCWI , is n(1 − 1 n−2 log(L+1) )/(1 + log(L+1) ) Proof: Since each local violation causes one global poll in the algorithm, we have CI = n · PL instantaneous triggering n i=1 P r(x = i) = n − log(L+1) . The communication cost of WISE consists of two parts, PLone is local violation, the other is global poll. Thus, CW = i=1 P r(x = i)+L·(n−1)·P r(x = L). Therefore, the gain of using WISE is gain =
CI CW
n−
>
1+
n log(L+1) n−2 log(L+1)
∈ [1, n)
The above theorem suggests that WISE yields more gain given 3n larger L and n. For instance, when L = 15, gain > n+3 , the gain approximates to 3 when n is enough large. This implies WISE scales well, which is confirmed by our experiment results. Furthermore, gain is a theoretical bound derived with the unoptimized WISE algorithm. The actual gain is generally better (50% to 90% reduction in communication cost) with parameter tuning and optimized subroutines.
Independent Global Poll
Global Poll
L
In this section, we study the problem of tuning local monitoring parameters for best communication efficiency. To begin with, we first introduce our cost model for estimating communication cost of WISE. A. Cost Model Communication in the WISE algorithm consists of local violation reporting and global polls. We use Cl and Pl (i) to denote the communication cost of sending a local violation report and the probability of sending it at one time unit on node i. Since a local violation report is of fixed size, we set Cl to 1. Pl (i) is the probability of vi (t) > Ti and no local violation occurs during last pi time units, because otherwise node i is in a filtering window during which it suppresses all violation reports. Estimating the communication overhead for global polls is relatively complicated. To ease our discussion, we first define independent and continuous global polls:
Timeline
L for a continuous global poll, because a continuous global poll contains more than one global poll and the first component global poll is of size L. We use Cgj to represent the cost associated with a j-windowed global poll. Since a j-windowed global poll requires all nodes to upload their vi values of previous j time units, Cgj = n · j. In addition, we define Pgj be the probability of a j-windowed global poll, since the probability of a global poll is also related with j. Given the above settings, the communication cost of the WISE algorithm can be estimated as follows: C=
V. PARAMETER T UNING S CHEMES
L
Continuous Global Poll
n X i=1
Cl Pl (i) +
∞ X
Cgj Pgj
(3)
j=L
Note that C is essentially the expectation of communication cost for any time unit. Based on this cost function, we now define our parameter tuning problem as follows. Problem Statement 2: Given the global threshold T , monitoring window size L, and n monitor nodes, determine the values of Ti , pi , ∀i ∈ [1, n] so that the total communication cost C, given by Equation 3, is minimized. B. A Local Search Based Parameter Tuning Scheme We next introduce a local search based parameter tuning scheme for solving the above problem. The tuning scheme runs at the coordinator and determines the best parameter setting by performing a EM-style local search. To search for the best Ti and pi values, the tuning scheme needs to compute values of Pl (i) and Pgj to minimize the cost given by Equation 3. Recall that Pl (i) is the probability that a local violation occurs at time t and no local violation occurs during last pi time units. Let Vit be the event of a violation
on node i at time t, and correspondingly, Vit be the event of no violation on node i at time t. We have, Pl (i) = P [
pi \
Vit−k ] · P [Vit ]
(4)
k=1
Compared with Cl Pl (i), computing the cost for global polls is more complicated, as it depends on the states of monitor nodes. Pgj is the probability that the size of a skeptical window equals to j. It is also the probability that at least one filtering window exists for each of the past j time units. Let W t represent the event of at least one filtering window exists at t. Since W t is independent among different t , we have, Pgj = P [
j−1 \
W t−k ] = (P [W t ])j
Pl (i) = P [vi 6 Ti ](P [vi 6 Ti |vi′ 6 Ti ])pi −1 P [vi > Ti |vi′ 6 Ti ] (8) n Y Pw = 1 − P [vi 6 Ti ](P [vi 6 Ti |vi′ 6 Ti ])pi −1 (9)
k=0
Denoting P [W t ] by Pw , the cost of global polls is: ∞ X
Cgj Pgj = n
∞ X
j · Pwj
i=1
j=L
j=L
The sum part of the result is a variant of infinite geometric series, which can be solved via Taylor expansion[21]. By solving this series, we have, ∞ X
Cg (Pw ) =
Cgj Pgj = n
j=L
LPwL − (L − 1)PwL+1 (1 − Pw )2
As the cost for global polls can be considered as a function of Pw , we use Cg (Pw ) to denote the cost of global polls. The value of Pw can be computed as, Pw = 1 − P [
pi n \ \
Vit−k ]
(5)
i=1 k=1
This is because the probability of W t is the probability of at least one node existing in its filtering window at time t. Up to this point, the only thing left unknown in both Equation 4 and 5 is the probability of Vit , which depends on values of Ti , pi and the distribution of vi . To further compute Pl (i) and Pw , we need to distinguish two types of stream values vi . One is time independent values where vi observed at the current moment is independent from those observed previously. The other type, time dependent values means vi observed at the current moment is dependent from previous values. We next discuss the computation of Pl (i) and Pw in both cases. Time Independent vi assumes vi in different time units is i.i.d. In this case, P [Vit ] and P [Vit−1 ] are independent. Thus, Equation 4 can be written as, Pl (i)
= (P [vi 6 Ti ])pi (1 − P [vi 6 Ti ])
(6)
Similarly, Equation 5 now can be written as, Pw
= 1−
n Y
(P [vi 6 Ti ])pi
each node maintains a histogram of the values that it sees over time as Hi (x), x ∈ [0, T ], where Hi (x) is the probability of i observing vi = x. Given Hi (x), P [vi 6 Ti ] = PTnode i H (x). i x=0 Time Dependent vi . We choose discrete-time Markov process, i.e. Markov chain, for modeling time dependent values, since it is simple and has been proved to be applicable to various real world stream data. Under this model, the values of future vi and past vi are independent, given the present vi value. Formally, P [vi (t + 1) = x|vi (t) = xt , . . . , vi (1) = x1 ] = P [vi (t + 1) = x|vi (t) = xt ]. For simplicity, we use vi and vi′ to denote the present value and the value of the previous time unit respectively. Assuming vi is time dependent, Equation 4 and 5 can be written as,
(7)
i=1
Based on Equation 6 and 7, we only need the value of P [vi 6 Ti ] to compute Pl (i) and Pw . To obtain P [vi 6 Ti ],
To compute Pl (i) and Pw , each monitor node maintains a set of transition probabilities P [vi = x|vi′ = x′ ] where x T ]. Given these transition probabilities, P [vi 6 Ti ] = P∈T [0,P Ti ′ ′ x=0 P [vi = x|vi = y], P [vi 6 Ti |vi 6 Ti ] = Py=0 Ti PTi ′ ′ y=0 x=0 P [vi = x|vi = y] and P [vi > Ti |vi 6 Ti ] = ′ 1 − P [vi 6 Ti |vi 6 Ti ]. Interestingly, looking for the best values for Ti and pi is essentially finding the best tradeoff between local violation and global polls which leads to the minimal communication cost. When increasing(decreasing) Ti , we reduce(increase) Pl (i) which causes local violation to reduce(increase). However, larger(smaller) Ti also leads to larger(smaller) Pw which in turn increases(decreases) Cg (Pw ). It is also the same case for increasing or decreasing pi . To determine best values for Ti and pi , we adopt an EMstyle local search scheme which iteratively looks for values leading to less cost. This scheme starts with two sets of initial values for Ti and pi . Iteratively, it fixes one set of parameters and performs hill climbing to optimize the other set of parameters until reaching local minimum. It then fixes the optimized set and tunes the other one. It repeats this process until no better solution is found. To avoid local minimum, we run the scheme multiple times with different initial Ti and pi values, and choose the best results. To overcome the the exponential growth of search space with increasing nodes, we also use a set of techniques to reduce running time including searching a predefined solution space[21]. VI. P ERFORMANCE O PTIMIZATION The performance of WISE can be further optimized by improving its major subroutines. We next describe two interesting optimization techniques of this kind, one for enhancing the global poll at the coordinator side and the other for improving local violation reporting at the monitor node side. Staged global polls. In the original global poll process, each node sends its buffered vi (t − j) values, where j ∈ [0, L], to
the coordinator for state alert verifying. While this scheme is simple, the coordinator often requires only part of buffered values to rule out or to trigger state alerts. To make global polls more efficient, we propose a novel staged global poll technique. The staged global poll divides the original global poll into three stages. In each stage, only part of the vi (t − j), j ∈ [0, L] values are transmitted. If an early stage rules out or triggers a state alert, the rest stages can be avoided. Even if all stages are required, the staged global poll transmits the same amount of monitoring data as the original one does. In the first stage, node i only sends those vi (t − j) values that satisfy vi (t − j) 6 Ti . Once received all the data, the coordinator tries to rule out the state alert by looking for a time unit t′ in which vi (t′ ) < Ti , ∀i ∈ [1, n]. If such a time unit is found, there exists at least one gap, i.e. a time unit without violation, among reported local violation, and thus, the state alert can be ruled out. Otherwise, the global poll enters the second stage, P where the coordinator computes a partial slack S ′ (t) = i∈G(t) Ti − vi (t), where G(t) = {i|vi (t) < Ti } for all time units associated with the global poll. Let O = {t|S ′ (t) > |N − G(t)|} where N is the set of all monitor nodes and t is any time unit associated with the global poll. If O = ∅, violation exists for all time units, and thus, a state alert is triggered. Otherwise, the last stage begins, where the coordinator notifies all nodes that were locally violated at time units t ∈ O to send the rest of their unsent vi data. Once the data is received, the coordinator performs normal state alert verification. Our experiment shows the staged global poll remarkably reduces communication cost. Termination messages. In the original WISE algorithm, although each local violation report indicates continuous violation, there may exist time units without local violation within the corresponding filtering window. Such overestimated filtering windows may increase the chance of invoking global poll, which is communication intensive. To mitigate this problem, we propose another optimization technique, –the termination message. This technique, when necessary, sends a message at the end of a filtering window to indicate time units indeed containing violation, which increases the chance of ruling out state alerts at the coordinator. Due to space limitation, we leave the detail of this technique to our technical report[21]. VII. E XPERIMENTAL E VALUATION We performed extensive experiments over both real world and synthetic traces to evaluate WISE. We highlight the most important observations in our experiments as follows: • WISE achieves a reduction from 50% to 90% in communication cost compared with instantaneous monitoring algorithm[18] and simple alternative schemes. • The optimization techniques, especially the staged global poll, further improve the communication efficiency of WISE in different monitoring settings. • The parameter tuning scheme is practical as it not only effectively improves the communication efficiency of WISE, but also contributes little to the total communication cost.
•
WISE scales better than the instantaneous algorithm in terms of communication overhead.
A. Experiment Settings We consider our simulation scenario as detecting DDoS attacks for a set of distributed web servers. Each server is equipped with a monitoring prob. In addition, a centralized monitoring server watches the total number of HTTP requests received at different web servers. When the total number of requests continuously stays above a predefined threshold T for L time units, the monitoring server triggers a state alert. We compare communication efficiency and scalability of the WISE algorithm, the instantaneous monitoring algorithm, and simple alternative window-based schemes. We choose the non-zero slack instantaneous monitoring algorithm[18] for comparison, as it is the most recent instantaneous monitoring approach and is reported to achieve significant communication reduction(6 60%) over previous approaches. The non-zero slack algorithm employs a local value threshold at each monitor node and reports local violation whenever the local value exceeds the local value threshold. It uses a set of optimization P techniques to set optimal local threshold values so that Ti − T > 0, a.k.a the slack may be positive. We also use several simple alternative window based state monitoring schemes as evaluation baseline. These schemes include the aforementioned “double reporting” scheme and WISE with naive parameter setting. Monitor nodes running the double reporting scheme report both the beginning and the end of a local violation period and the coordinator delays the global poll until necessary. The naive parameter setting simply sets Ti = Tn and pi = max{ L n , 2} for node i. We measure communication cost by message volume (the total size of all messages) and message number. By default, we use message volume for comparison. In addition, we categorize messages into data messages and control messages. Data messages are those containing monitored values, e.g. local violation reports. The size of data message is m where m is the number of values encapsulated in the message. Control messages refer to all the other messages and their size is 1. Our trace-driven simulator runs over two datasets. One dataset, WorldCup, contains real world traces of HTTP requests across a set of distributed web servers. The trace data comes from the organizers of the 1998 FIFA Soccer World Cup[19] who maintained a popular web site that was accessed over 1 billion times between April 30, 1998 and July 26, 1998. The web site was served to the public by 30 servers distributed among 4 geographic locations around the world. Thus, the traces of WorldCup provide us a real-world, large-scale distributed dataset. In our experiments, we used the server log data consisting of 57 million page requests distributed across 26 servers that were active during that period. We set the length of time unit to 1 minute and invoke a reconfiguration every 1,000 time units. The other dataset, Synthetic, contains randomly generated traces that give us the freedom of evaluating parameters can not be controlled in real world traces. For instance, we can
2500
3000 T
3500
4000
4
10
10
(a) WorldCup - Increasing T
15
20 L
25
30
Conventional Double Report WISE−Naive WISE−Tune−Ind WISE−Tune−Dep
5
10
4
10
20
(b) WorldCup - Increasing L
30
40
50 T
60
70
80
Communication Overhead (Msg Volume)
2000
Conventional Double Report WISE−Naive WISE−Tune−Ind WISE−Tune−Dep
5
10
Communication Overhead (Msg Volume)
4
10
Communication Overhead (Msg Volume)
Communication Overhead (Msg Volume)
Conventional Double Report WISE−Naive WISE−Tune−Ind WISE−Tune−Dep
5
10
Conventional Double Report WISE−Naive WISE−Tune−Ind WISE−Tune−Dep
5
10
4
10
5
(c) Synthetic - Increasing T
10
15 L
20
25
(d) Synthetic - Increasing L
2000
2500
3000 T
3500
(a) WorldCup - Increasing T
4000
Conventional Double Report WISE−Naive WISE−Tune−Ind WISE−Tune−Dep
5
10
4
10
10
15
20 L
25
30
(b) WorldCup - Increasing L
Communication Overhead (Msg Num)
4
10
Communication Overhead (Msg Num)
5
10
Communication Overhead (Msg Num)
Communication Overhead (Msg Num)
Fig. 5: Comparison of Communication Efficiency in Terms of Message Volume Conventional Double Report WISE−Naive WISE−Tune−Ind WISE−Tune−Dep
Conventional Double Report WISE−Naive WISE−Tune−Ind WISE−Tune−Dep
5
10
4
10
20
30
40
50 T
60
70
(c) Synthetic - Increasing T
80
Conventional Double Report WISE−Naive WISE−Tune−Ind WISE−Tune−Dep
5
10
4
10
5
10
15 L
20
25
(d) Synthetic - Increasing L
Fig. 6: Comparison of Communication Efficiency in Terms of Message Number increase the number of monitor nodes from 20 to 5000 for scalability evaluation. We first generate a trace of aggregate values and then distribute values to different nodes based on Uniform or Zipf distributions. Unless otherwise specified, the number of nodes is 20 and Uniform distribution is applied. B. Results Comparison of communication efficiency. Figure 5 and 6 compare the communication overhead of WISE(WISE) with that of the instantaneous monitoring algorithm(Instantaneous), the double reporting scheme(Double Report) and WISE with naive parameter setting(WISE-Naive) for the World Cup dataset and Synthetic dataset. We vary T and L in a way that the total length of global violation takes up from 0% to 50% of the total trace length. By default, we set T = 2500(20) and L = 15(10) for the WorldCup(Synthetic) dataset. Figure 5(a) shows the total message volume generated by WISE is nearly a magnitude lower than that of the instantaneous approach. Double Report and WISE-Naive, while outperform the instantaneous approach as they delay global polls, generate more traffic compared with WISE combined with our parameter tuning scheme(WISE-Tune). Double Report suffers from frequent reporting for short violation periods, especially when T is small. WISE-Naive fails to achieve better efficiency because it does not explore different value change patterns at different nodes. In general parameter setting schemes using the time independent model(Ind) performs slightly better than those using time dependent one(Dep). However, as the time dependent model associates higher communication and computation cost, the time independent model is more desirable. In Figure 5(b), while the instantaneous approach is not benefited from large values of L, the WISE algorithm pays
less and less communication overhead as L grows, since nodes increase filtering window sizes and the coordinator rules out more global polls with increasing L. Figure 5(c) and 5(d) show similar results for the Synthetic dataset. Furthermore, as Figure 6 shows, WISE achieves even better efficiency advantage in terms of message number, as global polls in WISE collects multiple values, instead of a single value in the instantaneous approach. Thus, WISE is even more favorable when per message payload is insensitive to message sizes. Effect of optimization techniques. Figure 7(a) and 7(b) shows effects of termination messages(T) and staged global polls(S) in terms of communication reduction, where the Y axis is the percentage of message volume saved over the instantaneous scheme for the WorldCup dataset. In Figure 7(a), the WISE monitoring algorithm achieves 60% to 80% saving after optimization. However, the saving of unoptimized ones reduces as T grows because of two reasons. First, the instantaneous scheme also causes less communication as T grows. Second, with growing T , the portion of global poll communication increases(as suggested later by Figure 8(a)) due to reduced local violation, and the original global poll is very expensive. Termination messages achieve relatively less saving compared with staged global polls. In Figure 7(b), the saving increases when L grows, as larger L leads to larger pi . Figure 7(c) and 7(d) show similar results for the Synthetic dataset. Communication cost breakup analysis. Figure 8(a) and 8(b) show communication cost breakup of WISE for the WorldCup dataset, where communication overhead is divided into three parts: local violation reporting, global polls, and control. The first part is the overhead for value reporting in local violations, i.e. messages sent by nodes during local violations. The second part is the overhead for value reporting in global
60
40
20
0
2000
2500
3000 T
3500
80 70 60 50 40 30
4000
100
WISE−Tune WISE−Tune−T WISE−Tune−T+S
(a) WorldCup - Increasing T
10
15
20 L
25
90 80 70 60 50 40 30
30
100
WISE−Tune WISE−Tune−T WISE−Tune−T+S
% Saving(Over Conventional)
80
90
% Saving(Over Conventional)
100
WISE−Tune WISE−Tune−T WISE−Tune−T+S
% Saving(Over Conventional)
% Saving(Over Conventional)
100
(b) WorldCup - Increasing L
20
30
40 T
50
90 80 70 60 50 40 30
60
WISE−Tune WISE−Tune−T WISE−Tune−T+S
(c) Synthetic - Increasing T
5
10
15 L
20
25
(d) Synthetic - Increasing L
Fig. 7: Effectiveness of Optimization Techniques in Enhanced WISE(Message Volume)
60
40
20
0
Local Global Control 2000
2500
3000 T
3500
4000
(a) WorldCup - Increasing T
80
60
40
20
0
10
15
20 L
25
30
(b) WorldCup - Increasing L
100 % Communication Cost Breakup
80
100 % Communication Cost Breakup
100 % Communication Cost Breakup
% Communication Cost Breakup
100
80
60
40
20
0
20
30
40 T
50
60
(c) Synthetic - Increasing T
80
60
40
20
0
5
10
15 L
20
25
(d) Synthetic - Increasing L
Fig. 8: Communication Cost Breakup of WISE (Message Volume and Message Number) polls, which consists of messages with buffered stream values sent by nodes during global polls and notification messages from the coordinator. All the rest of the messages, most of which generated by the parameter tuning scheme, are classified as control messages. Furthermore, the left bar in each figure shows the percentage of different types of communication in message volume, and the right bar measures the percentage in message number. In Figure 8(a), as T grows, the portion of global poll communication steadily increases, as local violation occurs less frequently. The portion of control communication also increases, due to the reduction of local violation reporting and global polls. Similarly, Figure 8(b) observes the growth of the global poll portion along with increasing L, as nodes increase pi to filter more reports. Figure 8(c) and 8(d) provide similar results for the Synthetic dataset. Scalability. Figure 9(a) and 9(b) evaluate the communication saving for WISE with different number of monitor nodes and different monitored value distributions. For World Cup dataset, we distributed the aggregated requests randomly to a set of 20 to 160 monitor nodes by Uniform and Zipf distributions. For the Synthetic dataset, we increased the number of nodes from 20 to 5000 nodes. For Zipf distribution, we chose a random Zipf exponent in the range of 1.0 to 2.0. Same as before, we measure communication cost in both message volume and message number. In Figure 9(a) and 9(b), the saving of WISE increases up to over 90% when the node number increases, which indicates that WISE scales better than the instantaneous approach. Interestingly, WISE performs better when Zipf distribution is used, because the parameter tuning scheme can set higher Ti and pi to nodes observing higher values, which avoids considerable local violation and global polls. Again, WISE
achieves higher advantage in communication reduction when we measure communication cost in number of messages generated, as global polls in WISE collect values in multiple time units. VIII. R ELATED W ORK Distributed data streams monitoring has been an active research area in recent years. Researchers have proposed algorithms for the continuous monitoring of top-k items[22], [23], sums and counts [14], quantiles[24], skylines[25], joins[26] and max/min values[12]. Problems addressed by these work are quite different from ours. While these work study supporting different operators, e.g. top-k and sums, over distributed data streams with guaranteed error bounds, we aims at detecting whether an aggregate of distributed monitored values violates constraints defined in value and time. Recent work[13], [16], [15], [17], [18] on the problem of distributed constraint monitoring proposed several algorithms for communication efficient detection of constraint violation. They study a different problem by using an instantaneous monitoring model where a state alert is triggered whenever the sum of monitored values exceeds a threshold. By checking persistence, the window-based state monitoring model we study gains immunity to unpredictable bursty behavior and momentary outlier data [10], and provides more space for improving communication efficiency. In addition, the instantaneous model is a special case of ours when L = 1. The early work[13] done by Dilman et al. propose a Simple Value scheme which sets all Ti to T /n and an Improved Value which sets Ti to a value lower than T /n. Jain et al.[27] discusses the challenges in implementing distributed triggering mechanisms for network monitoring and they use local constraints of T /n to detect violation. The more recent work of
96 94 92 90
WISE−Uni−Msg−Vol WISE−Uni−Msg−Num WISE−Zipf−Msg−Vol WISE−Zipf−Msg−Num
88 20
40
60
80 100 120 Number of Nodes
140
% Saving(Over Conventional)
% Saving(Over Conventional)
98
ACKNOWLEDGMENT
93 92 91 90 89 88
WISE−Uni−Msg−Vol WISE−Uni−Msg−Num WISE−Zipf−Msg−Vol WISE−Zipf−Msg−Num
87 86
2
160
(a) WorldCup - Increasing n
10
3
10 Number of Nodes
(b) Synthetic - Increasing n
Fig. 9: Scalability of the WISE Monitoring Algorithm Sharfman et al.[16] represents a geometric approach for monitoring threshold functions. Keralapura et al.[15] propose static and adaptive algorithms to monitor distributed sum constraints. Agrawal et al.[17] formulates the problem of selecting local constraints as an optimization problem which minimizes the probability of global polls. Kashyap et al. [18] proposes the most recent work in detecting distributed constraint violation. They use a non-zero slack scheme which is close to the idea of Improved Value scheme in [13]. They show how to set local thresholds to achieve good performance. We choose this non-zero slack scheme for comparison purpose. The work that is perhaps closest to ours is that of Huang et al.[11]. They consider a variant of the instantaneous tracking problem where they trackPthe cumulative amount of “overflows” which is max{0, i vi − T }. This work makes two assumptions which may not be true: (1) All local threshold values are equal, and (2) local values follow a Normal distribution. In addition, it is unclear if the computed local thresholds in [11] optimize total communication costs. WISE employs a sophisticated cost model to estimate the total communication overhead and optimizes parameter setting based on this estimation. Furthermore, while [11] allows missed detections, WISE guarantees monitoring correctness. IX. C ONCLUSIONS
AND
F UTURE W ORK
We identified the weakness of the existing instantaneous state monitoring model and introduced window-based state monitoring for large-scale distributed systems such as data centers. More importantly, we showed challenges of distributed window-based state monitoring, and presented WISE, a system for efficient window-based state monitoring with correctness guarantee. WISE achieves communication efficiency by using a novel time window based filtering technique. We further improve the performance of WISE with the parameter tuning scheme and optimized subroutines. Through extensive experiments, WISE achieves significant communication reduction compared with instantaneous monitoring approaches and simple alternative schemes. Many other data stream monitoring operators such as topk also evaluate queries with instantaneous criteria. As part of our ongoing work, we are studying techniques to enhance these data stream monitoring operates with window-based state monitoring approaches.
This work is partially supported by grants from NSF CyberTrust, NSF NetSE, and IBM faculty award, IBN SUR grant and a grant from Intel research council. The authors also would like to thank the anonymous ICDE reviewers for their insightful and valuable comments that helped improve this paper. R EFERENCES [1] Amazon, “Amazon elastic computer cloud(amazon ec2),” 2008. [2] B. Raghavan, K. V. Vishwanath, S. Ramabhadran, K. Yocum, and A. C. Snoeren, “Cloud control with distributed rate limiting,” in SIGCOMM07. [3] L. Gao, M. Wang, and X. S. Wang, “Quality-driven evaluation of trigger conditions on streaming time series,” in SAC, 2005. [4] L. Raschid, H.-F. Wen, A. Gal, and V. Zadorozhny, “Monitoring the performance of wide area applications using latency profiles,” in WWW03. [5] A. Bulut and A. K. Singh, “A unified framework for monitoring data streams in real time,” in ICDE, 2005. [6] S. Madden, M. J. Franklin, J. M. Hellerstein, and W. Hong, “Tinydb: an acquisitional query processing system for sensor networks,” ACM Trans. Database Syst., vol. 30, no. 1, pp. 122–173, 2005. [7] A. Manjhi, S. Nath, and P. B. Gibbons, “Tributaries and deltas: Efficient and robust aggregation in sensor network streams,” in SIGMOD, 2005. [8] M. Li, Y. Liu, and L. Chen, “Non-threshold based event detection for 3d environment monitoring in sensor networks,” in ICDCS07. [9] S. Meng, S. R. Kashyap, C. Venkatramani, and L. Liu, “Remo: Resource-aware application state monitoring for large-scale distributed systems,” in ICDCS, 2009. [10] A. Deligiannakis, V. Stoumpos, Y. Kotidis, V. Vassalos, and A. Delis, “Outlier-aware data aggregation in sensor networks,” in ICDE, 2008. [11] L. Huang, M. N. Garofalakis, A. D. Joseph, and N. Taft, “Communication-efficient tracking of distributed cumulative triggers,” in ICDCS, 2007, p. 54. [12] A. Silberstein, K. Munagala, and J. Yang, “Energy-efficient monitoring of extreme values in sensor networks,” in SIGMOD, 2006. [13] M. Dilman and D. Raz, “Efficient reactive monitoring,” in INFOCOM, 2001. [14] C. Olston, J. Jiang, and J. Widom, “Adaptive filters for continuous queries over distributed data streams,” in SIGMOD Conference, 2003. [15] R. Keralapura, G. Cormode, and J. Ramamirtham, “Communicationefficient distributed monitoring of threshold counts,” in SIGMOD, 2006. [16] I. Sharfman, A. Schuster, and D. Keren, “A geometric approach to monitor threshold func. over distrib. data streams,” in SIGMOD, 2006. [17] S. Agrawal, S. Deb, K. V. M. Naidu, and R. Rastogi, “Efficient detection of distributed constraint violations,” in ICDE, 2007. [18] S. R. Kashyap, J. Ramamirtham, R. Rastogi, and P. Shukla, “Efficient constraint monitoring using adaptive thresholds,” in ICDE, 2008. [19] M. Arlitt and T. Jin, “1998 world cup web site access logs,” http://www.acm.org/sigcomm/ITA/, August 1998. [20] L. A. Adamic and B. A. Huberman, “Zipfs law and the internet,” Glottometrics, 2002. [21] S. Meng, T. Wang, and L. Liu, “Efficient window-based state monitoring,” http://www.cc.gatech.edu/∼smeng/WISE.pdf, 2008. [22] B. Babcock and C. Olston, “Distributed topk monitoring,” in SIGMOD, 2003. [23] M. Wu, J. Xu, X. Tang, and W.-C. Lee, “Monitoring top-k query inwireless sensor networks,” in ICDE, 2006, p. 143. [24] G. Cormode, M. N. Garofalakis, S. Muthukrishnan, and R. Rastogi, “Holistic aggregates in a networked world: Distributed tracking of approximate quantiles,” in SIGMOD Conference, 2005, pp. 25–36. [25] B. Cui, H. Lu, Q. Xu, L. Chen, Y. Dai, and Y. Zhou, “Parallel distributed processing of constrained skyline queries by filtering,” in ICDE, 2008. ¨ [26] X. Yang, H.-B. Lim, M. T. Ozsu, and K.-L. Tan, “In-network execution of monitoring queries in sensor networks,” in SIGMOD, 2007. [27] A. Jain, J. M. Hellerstein, S. Ratnasamy, and D. Wetherall, “The case for distributed triggers,” in HotNets, 2004.