Aug 4, 1995 - Direct monitoring of the free Ca2+ concentration in the lumen of the endoplasmic reticulum (ER) is an important but still unsolved experimental ...
The EMBO Journal vol.14 no.22 pp.5467-5475, 1995
Monitoring dynamic changes in free Ca2l concentration in the endoplasmic reticulum of intact cells Mayte Montero, Marisa Brini, Robert Marsault, Javier Alvarez, Roberto Sitial, Tullio Pozzan and Rosario Rizzuto2 Department of Biomedical Sciences and CNR Center for the Study of Mitochondrial Physiology, University of Padova, Padova and IDepartment of Biological and Technological Research (DIBIT), Milano, Italy 2Corresponding author
Direct monitoring of the free Ca2+ concentration in the lumen of the endoplasmic reticulum (ER) is an important but still unsolved experimental problem. We have shown that a Ca2+-sensitive photoprotein, aequorin, can be addressed to defined subcellular compartments by adding the appropriate targeting sequences. By engineering a new aequorin chimera with reduced Ca2+ affinity, retained in the ER lumen via interaction of its N-terminus with the endogenous resident protein BiP, we show here that, after emptying the ER, Ca2> is rapidly re-accumulated up to concentrations of >100 ,uM, thus consuming most of the reporter photoprotein. An estimate of the steady-state Ca2+ concentration was obtained using Sr2+, a wellknown Ca2+ surrogate which elicits a significantly slower rate of aequorin consumption. Under conditions in which the rate and extent of Sr2+ accumulation in the ER closely mimick those of Ca2+, the steady-state mean lumenal Sr2+ concentration ([Sr2+Ier) was -2 mM. Receptor stimulation causes, in a few seconds, a 3-fold decrease of the [Sr2+]e, whereas specific inhibition of the ER Ca2+ ATPase leads to an -10-fold drop in a few minutes. Keywords: calcium/endoplasmic reticulum/photoprotein(s)/ signal transduction/targeting
Introduction Fluorescent indicators (Tsien et al., 1982) and photoproteins (Ashley and Ridgway, 1968) have been used in the last two decades to monitor Ca2+ concentration in living cells. While the indicators can be loaded into cells either via intracellularly trappable esters or by microinjection, until recently only the latter technique could be employed with Ca2+-sensitive photoproteins. However, thanks to the cloning of the cDNA encoding the photoprotein aequorin, the time-consuming and traumatic procedure of microinjection can be now be replaced by the simpler technique of cDNA transfection. This latter approach, i.e. the modification of the aequorin cDNA with the insertion of targeting sequences and thus the specific subcellular localization of the photoprotein has provided © Oxford University Press
another important opportunity in the study of Ca>' homeostasis. In this way, we have constructed aequorin chimeras targeted to the mitochondrial matrix (Rizzuto et al., 1992), nucleus (Brini et al., 1993) and cytosol (Brini et al., 1995) of living cells, which have provided new and often unexpected information on Ca>2 homeostasis in intact cells. The targeting of aequorin or the fluorescent Ca2+ indicators to the lumen of the endoplasmic reticulum (ER) has also been attempted by various groups. However, several problems have arisen. In the case of fluorescent dyes, trapping within the ER is not specific, and identification of the loaded structures is very often impossible. Moreover, in the ER lumen, Ca2+ dyes appear to be saturated with Ca2+ (Glennon et al., 1992) and/or, as in the case of lower affinity indicators such as Mag-fura-2 (Hofer and Machen, 1993), Mag-indo- 1 (Tse et al., 1994) or furaptra (Hirose and lino, 1994), to have such a poor selectivity over Mg>2 that calibration is highly uncertain. This notwithstanding, an estimate of the free Ca2+ concentration in the ER lumen could be obtained, which was, at rest, in the range 60-200 ,uM (Tse et al., 1994; Hofer et al., 1995). Different problems have plagued the approach of targeting Ca2+-sensitive photoproteins to the ER. Appending a Lys-Asp-Glu-Leu (KDEL) motif to the C-terminus of the photoprotein allows ER targeting (Kendall et al., 1992a, 1994) but causes a spontaneous, Ca2+-independent degradation (Nomura et al., 1991; Watkins and Campbell, 1993). The signal of ER-targeted aequorin, although quite difficult to calibrate, apparently indicated a mean Ca2+ concentration in the order of 1-5 ,uM (Kendall et al., 1992a). This value not only appears much lower than that measured with the fluorescent indicators, but also is difficult to reconcile with the known affinities of ER Ca2+ binding proteins and with the kinetic characteristics of the ER Ca2+ channels and pumps. We here describe the use of an aequorin chimera targeted to the ER employing a new strategy which allows for the specific localization of the recombinant protein to the ER lumen without modifying its critical C-terminal proline. We show that not only a normal aequorin moiety but also a low-affinity aequorin (generated by the point mutation of one of the three Ca2+ binding sites) is endowed with a Ca2+ affinity which is too high to reliably measure the concentration of this cation in the ER lumen. By taking advantage of Sr2+, a divalent cation which is transported by Ca2+ ATPases and permeates through Ca2+ channels but elicits a slower rate of photoprotein consumption than Ca2+ itself, we demonstrate that divalent cation homeostasis in this endomembrane system can be followed quantitatively in intact cells both under resting conditions and upon cell stimulation. We conclude that the Ca2+ concentration in the ER lumen under resting conditions is -2-3 mM, and drops very rapidly upon the receptor-
5467
M.Montero et al. .AEK"^ CDNA ?.
ig heavy rhaiin gene __
_
I"''
.
I.. .. ....
''-
i-i
0 -1
x- -2E -3 -4 0 -j
erAEO
-5
4.7
-6 -7
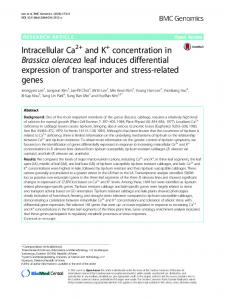
Fig. 1. Schematic map of the chimeric erAEQ cDNA. In the Ig moiety (on the left), shaded boxes and thick lines indicate coding and intronic regions, respectively; in the aequorin portion, the coding and noncoding regions of the cDNA are indicated by a white box and a thin line, respectively. The short sequence encoding the HAI tag, located upstream of the aequorin moiety, is indicated by a black box. An asterisk shows the position of the single amino acid substitution of erAEQmut (AspI 19-*Ala), which decreases the affinity of aequorin.
8
7
6
5
4
3
2
1
pCation
Results
Fig. 2. Determination of the Ca>+ and Sr2+ affinities of the erAEQ chimeras. (U) Ca2+ response curve of the erAEQ chimera including the wild-type aequorin cDNA (erAEQwt); the Ca2+ affinity of this chimera is virtually identical to that of native aequorin (results not shown). (0) Ca)+ response curve of the erAEQ chimera including the Aspl 19-Ala mutation (erAEQmut). (A) Sr2+ response curve of erAEQmut. Each data point is the average of at least five different trials. The standard deviation, when significant, is shown. pCation, -log[cation2+]; L, rate of photon emission immediately after mixing the cell lysate with the Ca2+ (or Sr2+) buffer; Lmax, integral of counts from the mixing to the end of the experiment (i.e. after aequorin consumption with excess cation2+). For the calibration curve, the supernatant of a lysate of HeLa cells expressing erAEQwt or erAEQmut was employed, and the cation2+ affinity of the recombinant photoprotein was measured as described in Materials and methods.
Figure 1 shows the structure of the chimeric cDNA. The encoded polypeptide (erAEQ) includes the leader sequence (L), the VDJ and CH 1 domains of an Igy2b heavy chain (HC; Sitia et al., 1990), and aequorin (Inouye et al., 1985) at the C-terminus. In this chimera, retention in the ER should depend not on the typical C-terminal sequence KDEL (Pelham, 1989), but on the presence at the Nterminus of aequorin of the CH 1 domain. This domain is known to interact with the lumenal ER protein BiP, thus causing the retention of the Ig HC in the lumen. In plasma cells, the interaction is displaced by the light chain (LC), while in any other cells a chimeric polypeptide including the CH 1 domain of the HC is expected to be selectively retained in the ER (Sitia et al., 1990, and references therein). The photoprotein domain was also modified by introducing an epitope tag (Field et al., 1988) and a point mutation (Aspl19-4Ala), which reduce the Ca2+ affinity of the photoprotein (Kendall et al., 1992b). The latter modification appeared necessary because aequorin is well suited for measuring [Ca2+] between 0.1 and 10.0 ,uM (Blinks et al., 1978b), whereas the [Ca2+]er was expected to be much higher (Pozzan et al., 1994). The shift in Ca2+ affinity is clearly apparent from the in vitro calibration (Figure 2). Interestingly, because of the cooperativity between the three Ca2+ binding sites of aequorin, the mutation, which affects the second EF-hand domain, changed the slope of the curve. The range of aequorin sensitivity can be expanded further by employing divalent cations other than Ca2+ (Blinks et al., 1978a). We utilized Sr2+, which is known to be a suitable Ca2+ surrogate (Somlyo and Somlyo, 1971); Sr2+ permeates across Ca2+ channels (Bezprozvanny and Ehrlich, 1994) and is actively transported, although with a lower affinity, by both the plasma membrane and the sarco-endoplasmic Ca2+ ATPases (SERCAs; Fleschner and Kraus-Friedmann,
1986; Holguin, 1986; Horiuti, 1986). As shown for the ER-targeted aequorin chimera with low Ca2+ affinity (erAEQmut) in Figure 2, the calibration curve of aequorin for Sr2+ is similar in slope to that for Ca>2, but shifted to the right. Altogether, by combining the two approaches, an aequorin-based ER probe can measure [cationI2+ ranging from the gM to the mM range. The chimeric cDNA, inserted in the expression vector pcDNAI (Invitrogen), was employed successfully both in transient expression experiments and in generating clones that stably express the chimeric photoprotein. To verify the effectiveness of the retention strategy, the release of erAEQmut in the culture medium of a transfected clone was measured. On average, -0.1%/h of total erAEQmut was released in the medium, confirming that indeed the photoprotein is mostly retained intracellularly. As for the intracellular localization, Figure 3 compares the immunofluorescence staining of the ER endogenous marker ERp72 (Figure 3A; Haugejorden et al., 1991) with that of erAEQmut (Figure 3B) in transiently transfected, doubly stained HeLa cells. It is apparent that the staining, which in the former case obviously labels all the cells, shows a very similar distribution and pattern; the high magnification of a cell expressing erAEQmut (Figure 3C) clearly shows the delicate reticular pattem typical of the ER. Native aequorin is composed of an apoprotein and a covalently bound coenzyme, coelenterazine. To utilize recombinant aequorin as a Ca>2 indicator, the holoprotein must be reconstituted, and this is accomplished by incubating the cells with the membrane-permeant prosthetic group coelenterazine (Rizzuto et al., 1994a,b, 1995). However, after a standard incubation with coelenterazine, i.e. in culture medium containing -2 mM Ca>, the total number of photons obtained with an erAEQmut-expressing clone was very low ( homeostasis, but in general for a better comprehension of ER physiology.
5468
Changes in free Ca2+ concentration in the ER
A
B
C
Fig. 3. Immunolocalization of the ER marker ERp72 and erAEQmut in transiently transfected HeLa cells. Double staining with polyclonal antiErp72 (A) and monoclonal anti-HAl (B) antibodies, revealed by FITC-labeled anti-rabbit and TRITC-labeled secondary antibodies. In (C), a higher magnification of the erAEQmut immunostaining is shown. Immunocytochemistry was performed as described in Materials and methods. Transiently transfected cells were employed for this experiment because, when compared with stable clones, a higher level of expression (and thus a stronger signal) was observed in the positive cells. However, the same staining pattern was also obtained with the clones (data not shown). (A and B) Bar 17 jtm; (C) bar 9 gm.
compared with >106 c.p.s. of clones transfected with mitochondrially targeted aequorin and showing a comparable intensity of immunocytochemical staining). A similar, low level of reconstitution was observed under these conditions in other clones expressing erAEQmut or erAEQwt, or in transiently transfected cells with either construct. This result was not entirely surprising, because [Ca2 ler was predicted to be very high, and thus aequorin consumption was expected to effectively compete with reconstitution. In vitro, we have observed (data not shown) that at [Ca>2] >50 tM, little or no net reconstitution takes place. In fact, at these high [Ca2+] values, as soon as coelenterazine binds to the apoprotein, the probability of photon emission, and thus consumption, becomes very high. If this is the case for the ER, little or no functional aequorin should be expected in intact cells. To verify whether the poor reconstitution in vivo was indeed caused by the high [Ca2+] of the ER lumen, we reconstituted apoaequorin after the depletion of [Ca2+]er by ionophores and SERCA inhibitors (Figure 4). Following this treatment, the immunostaining of erAEQmut was not modified (results not shown), while a dramatic increase was observed in the count yield (>106 c.p.s./coverslip, i.e. -20-fold more than the controls). Figure 4B shows the kinetics of aequorin photon emission in intact cells after reconstitution under the latter conditions. The signal, close to background in EGTA-containing medium, showed a dramatic transient increase (which consumed -90% of total aequorin) upon CaCl2 addition; the final addition of digitonin resulted in a marginal emission of photons. The calibration of the luminescent signal into [Ca2+]er values (Figure 4C) shows that the apparent average [Ca2+]er increased from a resting value of -1 gM to a peak of -150 gM. After the peak, [Ca2+]er dropped very rapidly
to a slowly declining plateau of -10 ,uM. The corresponding data for cytosolic Ca2+ concentration ([Ca2+]c), as
measured in parallel with fura-2, are shown in Figure 4A. Unlike the [Ca2+]en, upon the addition of Ca2+ to the perfusing medium, the [Ca2+] in the cytosol increased rapidly from a very low value (-10 nM) to a steadystate level of -100-150 nM, without any obvious gross overshoot above this concentration. The [Ca2+]c of cells maintained and loaded with fura-2 in Ca2+ medium was indistinguishable from that reached after 2-3 min by cells undergoing the depletion protocol (results not shown). Several explanations can be offered for the unexpected transient and very large overshoot of [Ca2+]er described in Figure 4C (see Discussion). Among these, a heterogeneity of the [Ca2+]er or the presence of a small fraction of erAEQmut in a post-ER compartment could easily explain the experimental data. In particular, if the bulk ER was endowed with a [Ca2+] > 100 ,uM, while a subfraction (or a post-ER compartment) had a lumenal [Ca2+] of -10 ,uM, the first would consume all its aequorin in a few seconds and the latter much more slowly. The average signal would thus reflect initially the high [Ca2+] regions; after the consumption of aequorin in those areas, the average signal would reflect the regions of low [Ca2+]. To test this possibility, we took advantage of the much lower affinity of aequorin for Sr2+. As discussed above, Sr2+ is the only known divalent cation which, in addition to triggering aequorin luminescence and permeating through Ca2+ channels, is also effectively transported by Ca2+ ATPases. If, after the Ca2+ depletion protocol, 1 mM Sr2+ was added to the medium, [Sr2+]c increased to -1.1,IM (Figure 4D). The kinetics of [Sr2+]c increase were very similar to those of Ca2+ (compare Figure 4D with A). Figure 4E and F shows the kinetics of aequorin light 5469
M.Montero et aL
Ca2+
Sr2+
E(GTA o
0
-
AL!]. co
EGTA -268 _- 134 -0
e-
0 co 00 CY)
+a 0
D
CX
LL
1
01.
--2.2 1
-
O
+ (3 en.o
0
._
Cr-
O.
U,
cell lysis
of
16 IT 12 -
0-
0
E 1-x co
8-
ca.
0-
C
> 150
2 r
00
El
+,an.
F
2=L
100
z
-R + 11co
o1
0
-J/ 30
s-4
cD
1 min
Fig. 4. Kinetics of [cation2+]c and [cation2+ler increase upon the readdition of Ca2+ and Sr2+ to Ca2+-depleted cells. The experiments shown here and in the following figure were performed utilizing a HeLa cell clone (EM26), stably transfected with erAEQmut. Similar results were obtained utilizing other erAEQmut expressing clones or HeLa cells transiently transfected with the erAEQmut expression plasmid. The upper traces (A and D) show the [cation2+]c measurements with fura-2. The middle (B and E) and lower (C and F) traces show, respectively, erAEQmut light emission and the conversion of erAEQmut luminescence data into [cation2+] values. (C) and (F) include an inset showing, at the same scale, the initial phase of the increase in [cation2+]er In all experiments, [Ca2+ler was first reduced with a typical Ca2+ depletion protocol, as described in Materials and methods. (A)-(C) and (D)-(F) correspond to the kinetics of refilling with 1 mM Ca2+ and Sr2+, respectively. At the end of the aequorin experiments, to estimate the total photoprotein content, unconsumed aequorin was discharged ('cell lysis') by perfusing the cells with a hypotonic Ca2+-rich solution, as described previously (Rizzuto et al., 1994a). These and the following data are typical of at least five independent experiments, which gave the same results.
emission and the calculated [Sr]2+]]e, respectively, in a parallel batch of cells under the same conditions. As expected, the rate of photon emission upon Sr2+ addition was much lower than that with Ca2+ (-30% of total aequorin was consumed in 5 min compared with -90% over the same time period with Ca2+). Comparison of the calibrated [Ca2+]er and [Sr2+]er traces (Figure 4C and F) indicates that the uptake in the ER was, for the two cations, sigmoidal and had virtually identical initial rates (6.7 ± 0.4 and 6.3 ± 0.4 ,uM/s for Ca> and Sr2 , respectively; see insets in Figure 4C and F). However, ER Ca2+ accumulation apparently ceased after 10-20 s, while that of Sr2+ continued to increase for 2-3 min and then reached a steady state. Overall, [Sr2+]e.,e when compared with [Ca2+]eil, showed a much larger increase, up to a plateau value of -2 mM. According to the hypothesis discussed above, the drop in [Ca2+]er would be apparent only in the high [Ca2+] compartment and caused by the rapid consumption of aequorin. The question then arises as to whether the steady-state concentrations reached in the ER by Sr2+ closely reflect those of Ca>. Obviously, this extrapolation rests on a series of assumptions. In particular, as for other organelles, the steady-state [cation2+] is expected to be the result of an equilibrium between the uptake of the cation via the
5470
SERCA and leakage into the cytosol. The former depends on the affinity of the pump(s) and on the
cytosolic
concentration of the cation, and the latter on the passive permeability of the membrane and on the intralumenal [cation>]. In order for the two cations, Ca> and Sr2 , to be accumulated in the ER lumen up to the same final concentration, it is thus necessary that the rates of accumulation and leakage are similar for both cations. As far as accumulation is concerned, the affinity of SERCAs for Sr2+ is known to be about one order of magnitude lower than that for Ca2+ (Holguin, 1986; Horiuti, 1986), while the Vmax for the two cations is the same (Fleschner and Kraus-Friedmann, 1986). Thus under our experimental conditions, at the steady state, the rate of Sr2+ accumulation is expected to be very similar to that of Ca2+ because [Sr2+]c is -10-fold higher than [Ca2+]c. Direct information on the leakage rate was sought in an experiment (results are shown in Figure 5A) which measures in situ the passive diffusion of Ca2+ and Sr2+ into the ER. To this end, after reconstituting erAEQmut with the protocol described above, cells were permeabilized with digitonin, thereby exposing the ER to the perfusion medium under conditions of complete inhibition of active transport (by treatment with inhibitors of cation2+ accumulation and ATP synthesis). The passive leakage was initiated by
Changes in free Ca2+ concentration in the ER cation2+ EGTA 300-
: 200
A No c
1000
1200 T 4.
2 800
X 400 1 min
0
100* cm
C
80 -
@
60-
a) O
40
-
20 0 0
100 200 300 400 500 time (s)
Fig. 5. Rates of Ca2+ and Sr2+ leakage into the ER in permeabilized cells, and the time course of ER refilling with the two cations in intact cells. (A) Initial phase of passive Ca2+ and Sr2+ leakage into the ER lumen in cells permeabilized with digitonin. To avoid any active uptake, the cells were treated with inhibitors of SERCAs (1 tM thapsigargin and 10 ,uM tBuBHQ) and of mitochondrial ATP production (1 ,ug/ml oligomycin and I ,ug/ml antimycin). The experiments were performed at 22°C. The cells were initially permeabilized with 100 tM digitonin in KRB containing 0.1 mM EGTA. After 3 min, digitonin was removed and perfusion continued for another 3 min in KRB + EGTA. Where indicated, the perfusion medium contained I mM CaCl2 or 1 mM SrC12 in place of EGTA. (B) Time course of ER refilling with Sr2+ by passive leakage in permeabilized cells. Conditions were as in (A), but measurement was prolonged until equilibrium was reached. (C) Time course of ER refilling with Ca2+ and Sr2+ in intact cells, as revealed by the amplitudes of agonist-induced [Ca2+]c or [Sr2+ c peaks. After the ER depletion protocol and loading with fura-2, 1 mM Ca2+ or Sr2+ was added to the incubation medium. At different times, 3 mM EGTA were added, followed immediately by 100 tM histamine. Fura-2 measurements were performed as described in Materials and methods. In the graph, the amplitude of the [Ca2+]c and [Sr2+]c peaks was normalized to the maximal response (i.e. that observed 15 min after cation readdition). No difference in the amplitude of the [Ca2+]c peak was observed between control cells which did not undergo the depletion/refilling protocol and cells refilled for 15 min. A very similar graph was obtained when the rates of cation2+ release were plotted instead of the amplitudes of the [cation2+]c peaks.
perfusing the permeabilized cells with saline solutions containing I mM Ca2+ or Sr2+; the leakage rate into the ER, which was derived from the rate of increase of [Ca2+]er and [SrI2+lei, was very similar for the two cations. Again, the rate of Ca2+ accumulation could be followed for only a few seconds, because afterwards, as a result
of rapid aequorin exhaustion, calibration became highly inaccurate. In the case of Sr2 , a steady-state concentration was reached which corresponded closely to the [Sr2+] of the perfusing medium; the good match between the expected value and the calibrated signal (Figure SB) indicates that inside the ER the sensitivity of aequorin to [Sr21] is similar to that measured in vitro. Based on these data, the time course of Ca2+ and Sr2+ refilling of the ER can be expected to be similar. This is confirmed by the experimental results displayed in Figure 5C, which show the amplitudes and rates (results not shown) of histamine-induced [Ca2+]I and [Sr2+] peaks (expressed as a percentage of the maximal response) at different times upon re-exposing the cells to external Ca2+ or Sr2+ after the ER depletion protocol. It is apparent that the increases in the [Ca2+]C and [Sr2+IC responses have an almost identical time course, thus indicating a similar speed of refilling of the ER with the two cations. After refilling the ER with Sr2+, the effects on [Sr2 ]C and [Sr2+]er of 2,5-di(tert-butyl)- 1,4-benzohydroquinone (tBuBHQ; Kass et al., 1989), an inhibitor of the SERCAs, and histamine, an agonist coupled to IP3 generation (Bootman et al., 1992), were analyzed (Figure 6). tBuBHQ caused a slow rise of [Sr2+]c (2.5 ,uM at the peak; Figure 6A), paralleled by a very large decrease in [Sr2+]er (Figure 6B) which reached a value of -200 ,uM in -3 min (corresponding to an aequorin light output close to basal values). Conversely, the receptor agonist, which caused a large increase in [Sr2+]c (Figure 6C), induced a rapid drop in [Sr2+]er (half-time 5 s), which stabilized at 0.7 mM throughout the stimulation (Figure 6D); a further decrease in [Sr2+]er was obtained upon addition of the SERCA inhibitor. These data indicate that agonist stimulation causes either a diffuse, partial emptying of the ER lumen or a complete release, limited, however, to an IP3-sensitive portion of the organelle.
Discussion Measuring [Ca2+ ]er quantitatively and kinetically is a difficult, but important, task which may allow us to address major questions in cell biology. Indeed, not only is the ER, or some of its subcompartments, believed to be the main Ca2+ store of non-muscle cells, functioning as a rapidly mobilizable reservoir of Ca2+ released into the cytosol upon stimulation of the plasma membrane receptors, but the Ca2+ content of the ER is also known to affect protein synthesis, sorting and degradation which occur in this organelle (for a review see Sitia and Meldolesi, 1992). In addition, several lines of evidence indicate that [Ca2+] in the lumen of the ER controls the Ca2+ permeability of the plasma membrane by modulating, probably via the release into the cytosol of a second messenger, the activity of specific Ca2+ channels (Fasolato et al., 1994). However, despite this large amount of interest, the information about ER Ca2+ handling is still fragmentary. The total Ca2+ content has been measured in several direct or indirect ways, and there is a general agreement that it amounts to several mmol/l of ER volume (for a review see Pozzan et al., 1994). In contrast, there is much discrepancy between the reported estimates of lumenal free [Ca2+] (Kendall et al., 1992a; Tse et al., 1994; Hofer et al., 1995). The reason for these discrepan5471
M.Montero et al.
tBuBHQ
hist
Sr2+ co 11 LL~
2.5 =I
0
A
11
-
I-I
LLm
'..
UC11
4.3 - 2.2
1.1 +
,)
0
Sr,+
o 2
2-
tBuBHQ
1.1
0
0O
0
W
3
2 E2 L,9
z,
C/)
4-0 m
m
=-
3
E 2 2-
0 1 S-
0
0
1
1 min iI
Fig. 6. Effects of histamine and the Ca2+ ATPase inhibitor tBuBHQ on [Sr2 ]c and [Sr2+]e, The upper (A and C) and lower traces (B and D) show the monitoring of [Sr2+]c and [Sr2+]er in EM26 cells with fura-2 and erAEQmut, respectively. Prior to recording, ER was refilled with Sr2+ as in Figure 4. Where indicated, the cells were treated with 10 ,tM tBuBHQ and/or 100 ,uM histamine (hist). Reconstitution of the photoprotein, collection and calibration of the luminescence signal, as well as all other experimental conditions, were as described in Materials and methods. The [Sr2+]c increases induced by histamine or SERCA blockers in EM26 cells were not significantly different from those observed in clones expressing low amounts of erAEQ or in control cells, thus suggesting that the expression of erAEQ does not affect the cation2+ buffering capacity of the ER lumen.
cies appears to be most probably methodological. Fluorescent Ca2+ indicators, when applied as hydrolyzable esters, have been reported to load, at least in some cell types, into the ER. However, a closer examination of the data reveals that such trapping of the indicator is not specific to the ER, because other organelles, such as mitochondria, lysosomes and secretory granules, also sequester the dyes. Thus, to a best approximation, the values obtained with the indicators are the means of several intracellular organelles. Unsurprisingly, Tse et al. (1994) reported that the apparent [Ca2+]er in gonadotropes is in part affected by mitochondrial poisons. A further complication in this approach is the need to somehow eliminate the strong cytosolic signal, by permeabilization, dialysis or selective quenching (Glennon et al., 1992; Tse et al., 1994; Hofer et al., 1995). On the other hand, targeting a Ca2+-sensitive photoprotein to the ER lumen, although largely overcoming the problem of selective localization of the indicator, has been affected by other problems. In particular, the obvious strategy, i.e. adding a KDEL C-terminal sequence to ensure ER retention, drastically altered the aequorin luminescence properties (Nomura et al., 1991; Watkins and Campbell, 1993). Indeed, the apparent [Ca2+Ier calculated by this method is surprisingly at least one order of magnitude lower than that measured recently with the Ca2+ dyes. The ER-targeted aequorin chimera developed here includes several features which proved useful for the specific analysis of [Ca2+ler, such as (i) the targeting strategy does not affect the luminescence properties of aequorin, (ii) the HA l epitope allows a straightforward subcellular localization, and (iii) the single amino acid substitution in the aequorin sequence, which decreases its Ca2+ affinity, allows the chimera to reliably report higher Ca2+ concentrations, thus expanding the pCa range that can be explored with the recombinant photoprotein. As to the effectiveness of the ER retention strategy, the
5472
minute release of the photoprotein into the medium despite the strong expression, and the immunostaining pattern clearly indicate that the vast majority of the aequorin chimera is retained in the ER lumen. Of course, it is very difficult to exclude the possibility that a minor subfraction of the aequorin pool is localized in other vesicular structures, such as the Golgi apparatus or secretory vesicles
(see below). However, despite the low Ca2+ affinity of our construct when reconstitution was carried out under standard con-
ditions, a very low total luminescence signal was obtained, suggesting that, at the physiological Ca2+ content of the ER, reconstitution is counteracted by a high rate of aequorin discharge. The alternative possibility, i.e. the existence in the ER lumen of factors other than Ca2+ preventing the optimal reconstitution of the luminescent protein, is ruled out by the demonstration that Ca21 depletion with ionophores and/or inhibitors of the SERCAs is sufficient to increase drastically the reconstitution efficiency. In the latter conditions, the apparent behavior of [Ca2+]e, upon the readdition of Ca2+ to the medium was quite unexpected. In particular, in a few seconds it reached -100 gM, followed by a precipitous decrease to < 10 gM. We considered various possibilities: (i) slow buffering in the ER lumen; (ii) rapid inactivation of the uptake; (iii) activation of a leakage pathway; and (iv) artefacts caused by the intrinsic characteristics of the aequorin signal. The last possibility appears the most likely. In fact, slow buffering is incompatible with the known kinetic constants of the ER Ca2+ binding proteins (Kon very fast), while the rapid inhibition of uptake or the activation of leakage is inconsistent with the kinetics of net Ca2+ uptake observed in both isolated ER vesicles and permeabilized cells. More importantly, the first three hypotheses appear to be incompatible with the kinetics of Ca2+ refilling
Changes in free Ca2+ concentration in the ER
presented in Figure 5. If indeed the free lumenal [Ca2+] reached a peak after 15-20 s and then dropped to about one-tenth of its maximal value in the steady state, one would predict that the rate (and extent) of agonist-induced Ca2+ release should be maximal at the peak of [Ca2+]er and then slow down when [Ca2+Ier apparently decreased to the lower steady-state value. This is clearly not the case. On the contrary, data indicate that the [Ca2+]er gradually increases and reaches a steady state in -2-3 min. Accordingly, the decrease in [Ca2+]er is thus only apparent. Two not mutually exclusive possibilities were considered as an explanation for this artefactual calibration of the aequorin signal. Firstly, as mentioned in Results, if only a minor fraction of aequorin (e.g. 10%) was contained in a compartment (of the ER or of another organelle) with a low [Ca2+], while the rest of the aequorin (90%) was exposed to a high [Ca2+], the overall kinetics of aequorin photon emission would indeed mimic those observed experimentally. In particular, a fast rate of light emission would be observed immediately after the addition of Ca2+ to the medium; in a few seconds, however, the aequorin content in the high Ca2+ compartment would drop drastically and, although the fractional rate of aequorin consumption would continue to increase, the absolute rate of photon emission would diminish drastically and eventually become negligible. However, at the same time, the relatively small signal coming from the compartment with low [Ca2+], negligible at the beginning, would remain relatively constant with time; thus, upon exhaustion of the large aequorin pool of the compartment with high [Ca2+], it would represent the only source of photon emission. Were this the case, the calibration procedure would give the false impression of a mean [Ca2+]er increasing rapidly and then eventually stabilizing at a low level. We have mimicked this model mathematically and demonstrated that it is possible to fit the experimental data almost perfectly, assuming that 90% of aequorin is contained in a compartment which in steady state reaches 3 mM Ca,2+ and 10% in a compartment which reaches 10 ,uM Ca2+ (results not shown). However, an alternative explanation is also possible: the luminescence kinetics could also be nicely fitted by another model in which the aequorin is all contained in a high Ca2+ environment, provided that a small continuous reconstitution of aequorin takes place as a result of the presence of some coelenterazine (after the washout from the medium) inside the cells. However, whichever model is correct, it is obvious that not even the mutated aequorin is suited to monitoring the high [Ca2+] in the ER lumen. On the other hand, the use of Sr2+ as a Ca2+ surrogate allows a reliable measurement of the steady-state [Sr2+]e^ but is itself subject to criticisms. Our data, however, strongly support the notion that the values of [Sr2+]er closely mimic those of [Ca2+]er In particular, given that the SERCAs have a lower affinity for Sr2+ than for Ca> (about one order of magnitude), it is predicted that the same net rate of cation uptake into the ER would be reached only if the cytosolic concentrations of the two cations were different, and in particular if [Sr2+]er was 10-fold higher than [Ca2+]er This is indeed the case in our experiments. For the same rate of cation uptake, the steady-state free cation concentration in the ER lumen would be the same only if the rates of leakage were the same. This latter condition
was verified experimentally, although admittedly it could be measured directly only in permeabilized cells. A final simple consideration argues strongly in favor of the conclusion that indeed the Ca2+ concentration in the ER lumen should not be very different from that of Sr2+. It has been shown that the rate of Ca2+ efflux through IP3 receptors is, within the range 10 ,uM-3 mM, linearly dependent on [cation2+] on the lumenal side (Bezprozvanny and Ehrlich, 1994). The rate of Ca2+ release induced by histamine added 20 s after initiation of the Ca2+ refilling protocol is -20 times slower than that measured at steady state (Figure 5). Given that after 20 s the [Ca2+]er is -100 ,uM, it immediately derives that at steady state the [Ca2+]er should be -20-fold higher, i.e. -2 mM, similar to the measured [Sr2+Ier In conclusion, altogether the data presented here demonstrate that under resting conditions, Sr2+ (and thus presumably Ca2+) is accumulated in the lumen of the bulk ER up to the millimolar range, and is rapidly released by IP3generating agonists and SERCA blockers. The mean [cation2+]er values measured (in the mM range) here are much higher than those suggested previously, not only using chimeric ER aequorin (i.e. in the low ,uM range; Kendall et al., 1992a), but also using fluorescent Ca2+ indicators (60-200 ,uM; Tse et al., 1994; Hofer et al., 1995), and are in full agreement with the known affinities and kinetic properties of SERCAs, Ca2+ binding proteins and Ca2+ release channels. This information, together with a tool for specifically monitoring the lumenal [cation2+], will now allow us to address directly, in intact cells, a number of key biological questions, such as the role of the ER Ca2+ in modulating the activity of Ca2+ channels and pumps and in controlling specific organelle functions, e.g. protein sorting.
Materials and methods Site-specific mutagenesis of the aequorin cDNA The HAI -tagged aequorin cDNA (Brini et al., 1995) was mutagenized to introduce the Asp 1 9-Ala mutation using the Pharmacia kit based on the unique site elimination procedure (Deng and Nickoloff, 1992), according to the supplier's protocols. The following primer was used to mutate the aequorin cDNA: 5'-GCTCCATTTTGGGCTTTGTCGACGATA-3' (antisense), corresponding to the sequence 5'-TATC(Ile)GTC-
(Val)GAC(Asp)AAA(Lys)GCC(Ala)CAA(Gln)AAT(Asn)GGA(Gly)GC-3' (sense). Specifically, codon 119 was changed from GAT to GCC, thus mutating Aspl19 of the encoded polypeptide to Ala, and a silent mutation was introduced in codon 116 (GTT-*GTC), thus creating a new Sall site, useful for the rapid screening of mutated cDNAs.
Construction of the ER-targeted aequorin chimeras The start point for the construction was plasmid pSV-Vy2b/g.tp (Sitia et al., 1990), which includes a complete Igy2b heavy gene and thus allows the recombinant expression of the Ig HC in plasma cells. In a first step, the wild-type aequorin cDNA was inserted at a unique XhoI site located at the beginning of the sequence encoding the CH2 domain. For this purpose, suitable XhoI sites were inserted upstream and downstream of the aequorin HindIII-EcoRI fragment through cloning steps in the appropriate vectors. Using this approach, five spurious amino acids were inserted between the Ig and aequorin coding sequences. The chimeric cDNA was transfected in NSO cells (a plasma cell line not expressing the LC; Sitia et al., 1990) and evidence was obtained of the ER localization of the recombinant protein (results not shown). The final construct was then prepared. A Sall site was generated by PCR at the 5' end of the Ig coding region, which was utilized for subcloning the whole construct (erAEQ, shown schematically in Figure I) into the cloning vector pBSK+ (Stratagene). At this stage, the HindIII-EcoRI fragment of the wild-type aequorin cDNA (Inouye et al., 1985) was
5473
M.Montero et al substituted with the corresponding fragment of HA 1-tagged 'normal' (Brini et al., 1995) or 'low-affinity' (see above) aequorin, thus generating the chimeras denoted erAEQwt and erAEQmut, respectively. The chimeric cDNAs were subcloned in the mammalian expression vector
pcDNAI (Invitrogen) and utilized in the transfection experiments.
Cell culture and transfection HeLa cells were grown in Dulbecco's modified Eagle's medium (DMEM), supplemented with 10% fetal calf serum (FCS), in 75 cm2 Falcon flasks. In transient expression experiments, the cells were seeded onto 13 mm glass coverslips and allowed to grow to 50% confluence. At this stage, transfection with erAEQwt or erAEQmut (2-4 ,ug DNA/ coverslip) was carried out as described previously (Rizzuto et al., 1 994b), and aequorin measurements or immunocytochemistry were performed 36 h after transfection. For generating cell clones stably expressing erAEQmut, a 10 cm dish of HeLa cells was transfected with 36 ,ug of erAEQmut/pcDNAI and 4 ,ug of pSV2neo (Southern and Berg, 1982). Selection was carried out with 0.8 mg/ml G418, as described elsewhere (Rizzuto et al., 1994b, 1995). In all, 50 clones were isolated and tested for aequorin expression by measuring the Ca2+-dependent light emission of coelenterazine-reconstituted cell lysates. Among the selected clones, erAEQmut expression (as estimated by a comparison with known amounts of purified protein) ranged between 5 and 70 ng/mg protein. Clone EM26 was the highest producer, and was employed in the experiments presented here, although similar data were obtained using other clones.
In vitro calibration of erAEQwt and erAEQmut The calibration curve of erAEQwt and erAEQmut, presented in Figure 2, was determined in vitro by exposing lysates of cell clones stably expressing the recombinant photoprotein to solutions containing 110 mM KC1, 10 mM NaCl, 1 mM free Mg2+, 40 mM HEPES, pH 7.0 at 220C, 5 mM EGTA (or HEDTA) and known concentrations of Ca2+ or Sr2 . The procedure for fitting the curve to the experimental data, and other details, are described in Brini et al. (1995).
Ca2+ measurements with aequorin and fura-2 EM26 cells were plated onto 13 mm round coverslips (for the aequorin experiments) or 20X8 mm rectangular coverslips (for the fura-2 experiments). As discussed in the text, before reconstituting aequorin, [Ca +]er was reduced using the following protocol. Cells were incubated for 5 min with the Ca2+ ionophore A23187 (10 ,uM) and the SERCA inhibitor tBuBHQ (10 ,uM) in KRB (Krebs-Ringer modified buffer: 125 mM NaCl, 5 mM KCI, 1 mM Na3PO4, 1 mM MgSO4, 5.5 mM glucose, 20 mM HEPES, pH 7.4, 37°C), supplemented with 3 mM EGTA, followed by washing in KRB containing 0.1 mM EGTA, 5% bovine serum albumin and 1O ,uM tBuBHQ. Similar results were obtained when [Ca2+]er was reduced with different protocols (e.g. omitting tBuBHQ from the protocol described above, or repetitively stimulating the cells with histamine in EGTA-containing medium in the presence of tBuBHQ). Aequorin reconstitution was then carried out by incubating the cells with 5 ,uM coelenterazine for I h in KRB containing 100 tM EGTA and 10 ,uM tBuBHQ. In the fura-2 measurements, prior to recording, the cells were incubated for 30 min with 5 jM fura-2/AM. In the erAEQmut measurements, fura-2 loading was omitted because we observed no effect of fura-2 on [cation2+ er dynamics (results not shown). All experiments were performed in KRB medium, supplemented, where indicated, with 0.1 mM EGTA, I mM CaCI2 or SrCl2. In the fura-2 measurements, the coverslip was transferred to the cuvette of a multi-wavelength fluorimeter (Cairn Research Ltd, Sittingbourne, UK; excitation 350 and 380 nm, emission 500 nm); the fura-2 signal was calibrated as described elsewhere (Rizzuto et al., 1993). In the erAEQmut measurements, the coverslip with the cells was introduced into the perfusion chamber of a purpose-built luminometer (Cobbold and Lee, 1991; Rizzuto et al., 1995). Aequorin light emission was measured as described previously (Rizzuto et al., 1994a), and calibrated using a computer algorithm (Brini et al., 1995) and the Ca2+ and Sr2+ affinity constants measured in vitro.
Immunolocalization of the HA 1-tagged recombinant
photoprotein
At 48 h after transfection, HeLa cells were processed for immunofluoresfollows. The cells were fixed with 3.7% formaldehyde in PBS for 20 min, washed two or three times with PBS and then incubated for 10 min in PBS supplemented with 50 mM NH4C1. Permeabilization of cell membranes was obtained with a 5 min incubation with 0.1% Triton X-100 in PBS, followed by a 30 min wash with 0.2% gelatin (type IV, cence as
5474
from calf skin) in PBS. The cells were then incubated for I h at 370C in a wet chamber with a 1:200 dilution (in PBS) of the monoclonal antibody 12CA5 (initially a kind gift from J.Pouyssegur, Nice, France; then obtained from BAbCo, Berkeley, CA), which recognizes the HAI tag (Field et al., 1988), and then with a 1:100 dilution of the rabbit polyclonal antibody ERp72(C) (Haugejorden et al., 1991) raised against the 16 C-terminal residues of the ER resident protein Erp72. Staining was then carried out with fluorescein isothiocyanate (FITC)-labeled antirabbit and tetramethylrhodamine (TRITC)-labeled anti-mouse secondary antibodies. After each antibody incubation, the cells were washed four times with PBS. Fluorescence was then analyzed with a Zeiss Axioplan microscope and photographed using Kodak Ektachrome 200 ASA film.
Acknowledgements We thank C.Bastianutto for carrying out some of the experiments, G.Ronconi and M.Santato for technical assistance, Y.Sakaki for the wildtype aequorin cDNA, J.Pouyssegur for the anti-HA I antibody, M.Green and J.Bergeron for the anti-ERp72 antibody, Y.Kishi for coelenterazine, and P.Cobbold for help in constructing the aequorin detection system. This work was supported by grants from the Italian Research Council (CNR) 'ACRO' project, from 'Telethon', from the Italian Association for Cancer Research (AIRC), from the 'AIDS project' of the Italian Health Ministry, from Human Frontiers (RG-520/95M), from the Italian Ministry of University and Scientific Research and from the British Research Council to T.P. and R.R. M.M., R.M. and J.A. are recipients of EEC 'Human Capital and Mobility' fellowships.
References Ashley,C.C. and Ridgway,E.B. (1968) Nature, 219, 1168-1169. Bezprozvanny,I. and Ehrlich,B.E. (1994) J. Gen. Physiol., 104, 821-856. Blinks,J.R., Allen,D.G., Prendergast,F.G. and Harrer,G.C. (1978a) Life Sci., 22, 1237-1244. Blinks,J.R., Mattingly,P.H., Jewell,B.R., vanLeewen,M., Marrer,G.C. and Allen,D. (1978b) Methods Enzymol., 57, 292-328. Bootman,M.D., Berridge,M.J. and Taylor,C.W. (1992) Am. J. Physiol., 450, 163-178. Brini,M., Murgia,M., Pasti,L., Picard,D., Pozzan,T. and Rizzuto,R. (1993) EMBO J., 12, 4813-4819. Brini,M., Marsault,R., Bastianutto,C., Alvarez,J., Pozzan,T. and Rizzuto,R. (1995) J. Biol. Chem., 270, 9896-9903. Cobbold,P.H. and Lee,J.A.C. (1991) In McCormack,J.G. and Cobbold,P.H. (eds), Cellular Calcium. A Practical Approach. Oxford University Press, Oxford, UK, pp. 55-81. Deng,W.P. and Nickoloff,J.A. (1992) Anal. Biochem., 200, 81-88. Fasolato,C., Innocenti,B. and Pozzan,T. (1994) Trends Pharmacol. Sci., 15, 77-83. Field,J., Nikawa,J., Broeck,D., MacDonald,B., Rodgers,L., Wilson,I.A., Lerner,R.A. and Wigler,M. (1988) Mol. Cell. Biol., 8, 2159-2165. Fleschner,C.R. and Kraus-Friedmann,N. (1986) Eur J. Biochem., 154, 313-320.
Glennon,M.C., Bird,G.S., Takemura,O., Thastrup,O. and Putney,J.W. (1992) J. Biol. Chem., 267, 25568-25575. Haugejorden,S.M., Srinivasan,M. and Green,M. (1991) J. Biol. Chem., 266, 6015-6018. Hirose,K. and Iino,M. (1994) Nature, 372, 791-794. Hofer,A.M. and Machen,T.E. (1993) Proc. Natl Acad. Sci. USA, 90, 2598-2602.
Hofer,A.M., Schlue,W.-R., Curci,S. and Machen,T.E. (1995) FASEB J., 9, 788-798. Holguin,J.A. (1986) Arch. Biochem. Biophys., 251, 9-16. Horiuti,K. (1986) Am. J. Physiol., 373, 1-23. Inouye,S., Noguchi,M., Sakaki,Y., Takagi,Y., Miyata,T., Iwanaga,S., Miyata,T. and Tsuji,F.I. (1985) Proc. Natl Acad. Sci. USA, 82, 3154-3158.
Kass,G.E.N., Duddy,S.K., Moore,G.A. and Orrenius,S.A. (1989) J. Biol. Chem., 264, 15192-15198. Kendall,J.M., Dormer,R.L. and Campbell,A.K. (1992a) Biochem. Biophys. Res. Commun., 189, 1008-1016. Kendall,J.M., Sala-Newby,G., Ghalaut,V., Dormer,R.L. and Campbell, A.K. (1992b) Biochem. Biophys. Res. Commun., 187, 1091-1097. Kendall,J.M., Badminton,M.N., Dormer,R.L. and Campbell,A.K. (1994) Anal. Biochem., 221, 17181.
Nomura,M., Inouye,S., Ohmiya,Y. and Tsuji,F.I. (I199 1) FEBS Lett., 295, 63-66.
Changes in free Ca2+ concentration in the ER Pelham,H.R.B. (1989) Annu. Rev. Cell Biol;, 5. 1-23. Pozzan,T., Rizzuto,R., Volpe,P. and Meldolesi,J. (1994) Phvsiol. Rev., 74, 595-636. Rizzuto,R., Simpson,A.W.M., Brini,M. and Pozzan,T. (1992) Nature, 358, 325-328. Rizzuto,R., Brini,M., Murgia,M. and Pozzan,T. (1993) Science, 262, 744-747. Rizzuto,R., Bastianutto,C., Brini,M., Murgia,M. and Pozzan,T. (1994a) J. Cell Biol., 126, 1183-1194. Rizzuto,R., Brini,M. and Pozzan,T. (1994b) Methods Cell Biol., 40, 339-358. Rizzuto,R., Brini,M., Bastianutto,C., Marsault,R. and Pozzan,T. (1995) Methods Enz:vinol., 260, 417-428. Sitia,R. and Meldolesi,J. (1992) Mol. Biol. Cell, 3, 1067-1072. Sitia,R., Neuberger,M., Alberini,C., Bet,P., Fra,A., Valetti,C., Williams,G. and Milstein,C. (1990) Cell, 60, 781-790. Somlyo,A.V. and Somlyo,A.P. (1971) Science, 174, 955-958. Southern,P.J. and Berg,P. (1982) J. Mol. Appl. Geniet., 1, 327-341. Tse,F.W., Tse,A. and Hille,B. (1994) Proc. Natl Acad. Sci. USA, 91, 9750-9754. Tsien,R.Y., Pozzan,T. and Rink,T.J. (1982) J. Cell Biol., 94, 325-334. Watkins,N.J. and Campbell,A.K. (1993) Biochem. J., 293. 181-185.
Received ofn June 20, 1995; revised oni August 4, 1995
5475