Morphological rational multi-scale algorithm for color contrast enhancement Hayde Peregrina-Barreto*a, Iván R. Terol-Villalobosb Universidad Autónoma de Querétaro, 249 Rio Moctezuma, San Juan del Rio, QRO, MEX; b CIDETEQ, Parque Tecnológico Querétaro, San Fandila-Pedro Escobedo, QRO, MEX
a
ABSTRACT Contrast enhancement main goal consists on improving the image visual appearance but also it is used for providing a transformed image in order to segment it. In mathematical morphology several works have been derived from the framework theory for contrast enhancement proposed by Meyer and Serra. However, when working with images with a wide range of scene brightness, as for example when strong highlights and deep shadows appear in the same image, the proposed morphological methods do not allow the enhancement. In this work, a rational multi-scale method, which uses a class of morphological connected filters called filters by reconstruction, is proposed. Granulometry is used by finding the more accurate scales for filters and with the aim of avoiding the use of other little significant scales. The CIE-u’v’Y’ space was used to introduce our results since it takes into account the Weber’s Law and by avoiding the creation of new colors it permits to modify the luminance values without affecting the hue. The luminance component (‘Y) is enhanced separately using the proposed method, next it is used for enhancing the chromatic components (u', v’) by means of the center of gravity law of color mixing. Keywords: Color contrast enhancement, rational operations, morphological filters, mathematical morphology.
1. INTRODUCTION Contrast enhancement plays a fundamental role in many image processing tasks. Its main goal consists in improving the visual appearance of an image. However, it also plays a main role in other problems; for example, providing a transformed image in order to segment it. Actually, there are many methods for image enhancement that can be classified into two categories: spatial domain methods and frequency domain methods. In the present work, the study is focused on spatial domain methods, and particularly on the use of the morphological image processing technique. In mathematical morphology few works have been made on this subject, even though a well-defined framework theory for contrast enhancement proposed by Meyer and Serra1 exists. In their work, an activity ordering to work on a complete lattice is proposed. In order to build the contrast mappings, Meyer and Serra use the morphological opening and closing as primitives and a proximity criterion for selecting them. Several works have been derived from this theory enabling us to have different tools for enhancing images. However, when working with images with a wide range of scene brightness, as for example when strong highlights and deep shadows appear in the same image, the morphological methods previously proposed in the literature do not allow the enhancement of this type of images. Some interesting multi-scale methods adapted for the contrasting of images containing a wide range of brightness levels are derived from the well-known Retinex approach. The main idea in the Retinex theory2 addresses the problem of separating illumination from reflectance. In this manner, the Retinex theory deals with compensation of illumination effects in images. In the present work is proposed a rational multi-scale method, derived of the process made by Espino et. al3, which follows the Retinex approach. However, instead of using the convolution of the Gaussian to enhance regions in a given scale, as in the Retinex case, a class of morphological connected filters called filters by reconstruction is applied. On the other hand, a model for human visual contrast perception called Weber's law is used to build morphological rational operators for detecting the principal regions and to enhance them. Thus, one proposes a ratio between the original image and the opened image to enhance bright structures. Then, the Weber's law is taken into account, and to enhance the regions the opened image serves as background to identify the principal regions of the original image. *
[email protected]; phone +52 (427)-27-412-44; fax +52 (427)-27-412-00
Image Processing: Algorithms and Systems VIII, edited by Jaakko T. Astola, Karen O. Egiazarian, Proc. of SPIE-IS&T Electronic Imaging, SPIE Vol. 7532, 75320Q · © 2010 SPIE-IS&T CCC code: 0277-786X/10/$18 · doi: 10.1117/12.838654 SPIE-IS&T/ Vol. 7532 75320Q-1
Similarly, a ratio between the original image and the closed image is used to contrast dark structures. In a multi-scale situation, the opened (closed) image at a coarser scale serves as the background for detecting and enhancing structures at a finer scale. Many scales could be applied in a transformation but depending on the image, just some of them imply important results. The importance of knowing those scales is with the aim of avoiding the use of little significant scales. Granulometry4, 5 is used as a tool with the aim of finding the more accurate scales. Once both structures, bright and dark, are enhanced at different scales, they are combined in a single final image. Among the different alternatives for the combination, a barycentric linear combination of both images is carried out. The u’v’Y space, proposed by Lucchese and Mitra6, was used to introduce our results. Since this space was built using the notion of just noticeable difference and our proposal for contrasting images takes into account the Weber's Law, which is based on the notion of just noticeable difference (JND), it seems natural to use this space to develop our approach. Furthermore, this space permits modify the luminance values without affecting the hue; this avoid the creation of new colors. Thus, colors change only on intensity which permits an improvement but keeping a natural appearance. The luminance component is enhanced separately using the proposed method, next it is used for enhancing the chromatic components (u', v’) by means of the center of gravity law of color mixing. Our results are compared with Retinex showing a better contrast enhancement. Particularly, the proposed method does not modify the original structures when the improvement is made; in addition, if improvement is not necessary the changes are little significant in contrast with Retinex where changes are more noticeable.
2. METHODOLOGY 2.1 Mathematical morphology Morphological filters have two important properties: they are increasing and idempotent7, 8. Former property means that the order must be preserved; latter property establish that a transformation ψ is idempotent if and only if ψ[ψ(f)]= ψ for all image f. Opening (γμB) and closing (ϕμB) are basic morphological filters; where B is the 3x3 basic structuring element and μ is an homothetic parameter. Thus, the final size (μB) of the structuring element, which is applied to f, is given by (2μ+1)(2μ+1). These filters are based on the morphological basic transformations: dilation (δμB) and erosion (εμB). Erosion is expressed as εμB=∧{f(y): y ∈ μB} where ∧ is the lowest value, and dilation is expressed as δμB=∨{f(y): y ∈ μB} where ∨ is the higher value. Then, γμB =
δ μB [ε μB ]
ϕμB =
ε μB [δ μB ]
(1)
Erosion and dilation are used for delete or remark the image structures; nevertheless, the modification of original structures is an undesirable effect on image improvement. Mathematical morphology has other kind of filters called filters by reconstruction9, 10 which main feature is to conserve the original structures. These filters are built by iterating until idempotence the dilation and erosion by reconstruction, which are defined as δ 1f ( g ) = f ∧ δ B ( g ) with f ≥g and
ε 1f ( g ) = f ∨ ε B ( g ) with f ≤g, respectively. Where g is the resulting image by applying an erosion or dilation to f and it is called marker. Based on this, it is possible to define the opening and closing by reconstruction as, ~
ϕ μB ( f ) = lim ε nf [δ μB ( f )] = ε 1f ε 1f ...ε 1f [δ μB ( f )] n→∞
~
(2)
γ μB ( f ) = lim δ [ε μB ( f )] = δ δ ...δ [ε μB ( f )] n→∞
n f
1 f
1 f
1 f
Remark: Frequently, B is omitted due to its size is known and constant. Thus, the expression ϕμB is equivalent to ϕμ; in the same way if μ=1 then ϕμB=ϕμ=ϕ. 2.2 Color properties and the u’v’Y color space Colors have some properties which allow distinguish one from another. On color image improvement, these properties must be manipulated, so, it is necessary to know and to difference them. There are three important properties: hue,
SPIE-IS&T/ Vol. 7532 75320Q-2
saturation and luminance11, 12. Hue is associated with the dominant wavelength in a mixture of primary colors; for example, the green yellowish and the green bluish are two different hues of the green. Saturation refers to the intensity of a color and it is judged in proportion to its gray content; the less gray content the more saturated color. Luminance is the notion of intensity and it describes how much dark or bright is a color. Distinguish luminance of brightness is important. According to the International Commission of Illumination (CIE), brightness is the quantity of light produced by a source and luminance is the radiated intensity which impacts to human eye. It means that, the perceived luminance permits to distinguish if a color is brighter or darker than other. Chromaticity or chroma is produced by the combination of hue and saturation; so, a color could be characterized by its chroma and luminance. For visual acquisition, color is an important characteristic since this allows distinguish one object to another with same shape, texture or size. However, color manipulation is not a simple task; for example, if a RGB color needs to be saturate and its values are modified in a not accurate way, instead of obtaining a saturated color, a different color could be obtained. Then, it is necessary to work in the adequate color space in order to manipulate the chromatic image values. There are many color spaces used on image processing but some of them work more according to the human visual system. u’v’Y is a space which permits to separate the chromatic and achromatic information6. This is important because on the one hand contrast can be improved by changing the luminance values (channel Y) but this improvement must not change the original hue; hence, when luminance is manipulated individually, the color becomes lighter but its hue is the same. On the other hand, color enhancement needs to saturate the hue by manipulating the chromatic channels u’v’; it means that a pixel x must decrease its gray content or moves away from the achromatic values. Often, images are represented on RGB color space, therefore it is necessary to translate the RGB values to u’v’Y values by using its respective transformation matrix (3).
0.587 0.114 ⎤ ⎡ R ⎤ ⎡Y ⎤ ⎡ 0.299 ⎢u '⎥ = ⎢− 0.147 − 0.289 0.436 ⎥ ⎢G ⎥ ⎢ ⎥ ⎢ ⎥⎢ ⎥ ⎢⎣ v'⎥⎦ ⎢⎣ 0.615 − 0.515 − 0.100⎥⎦ ⎢⎣ B ⎥⎦
(3)
2.3 Morphological Rational Filters Morphological rational filters (MRF) are a combination of the basic morphological filters and, according with Kogan et al.13, these filters provide more robust results. At the beginning, the MRF were applied for edge detection and later Espino-Gudiño et al3. proposed their use with openings by reconstruction in a multi-scale process (4). Latter application allows to improve the contrast of dark regions, where the opening by reconstruction operates as background with the aim of identifies the main regions and improves the contrast at the scale μn. This multi-scale process considers the Weber’s law which establishes that, in order to produce a change in the visual perception, it is necessary an increment proportional to the intensity of the original stimulus. ~
N
RM ( x, μ ) = ∑ n =1
γ μ n−1 ( f ) ~
γ μn( f )
~
~
, with γ μ 0 ( f ) = γ 0 ( f ) = f
(4)
2.4 Granulometry An image contains many structures which give form to its regions and objects; the structures on an image could have many sizes or scales, some of them more common than others. When a morphological transformation or filter is applied it affects only those regions content on a size μ. For this reason, it is essential to identify the most important scales in order to reach them when a transformation is applied. Granulometry is a concept formalized by Matheron4 in the binary case and extended to the gray-scale case by Serra5; it is also the usual tool for finding the scales in mathematical morphology. Granulometric analysis consists on consecutive morphological transformations with an incremental size of μ and it provides information about how much μ affects the image. A formal granulometry definition is expressed next. Definition 1: A family of openings {γλ}, where λ∈{1,…, n}, is a granulometry if for all λ μ∈{1,…,n}, and all function f, λ_≤_μ_⇒_γλ(f)_≥_ γμ (f).
SPIE-IS&T/ Vol. 7532 75320Q-3
G (λ ) =
mes(γ λ ( f )) − mes(γ λ +Δ ( f )) mes( f )
(5)
On contrast enhancement the objective is to reach the majority of the regions with the aim of improving the luminance; the granulometric analysis is used for knowing what structure sizes are contained on the image and could be reached by applying MRF. There are many scales on one image but only some of them generate a significant change. Equation (5) is used for granulometric analysis by using openings; where mes is the volume measure, defined as the sum of all the pixel values, λ is the size of the opening, Δ is a increment value and G(λ) is the granulometric function. Anti-granulometric analysis uses the same expression but applying closings instead of openings. In both cases the higher G(λ) values, the more adequate λ sizes for the transformation.
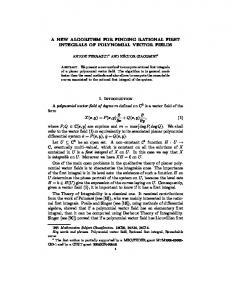
3. PROPOSED METHODS 3.1 Contrast enhancement The objective of the proposed method is focused on improve the contrast of dark regions but without affecting good contrast region. MRF by openings demonstrates that it can improve the contrast3 and it result is analyzed and also MRF by closings is explored. Figure 1(a) shows an image with two different illuminations dynamic which is our study case. Outside region has a good luminance and it is possible to distinguish among all its elements effortless; yet, inside region is dark and the discrimination among elements is hardest. Luminance histogram (Fig. 1(b)) shows that, although luminance values are distributed all range long, an important quantity of pixels are in the darker region, others are in the middle range having good luminance and just a few are on the lightest region.
(a)
(b)
Figure 1. (a) Original image with two illumination dynamics and (b) its luminance histogram.
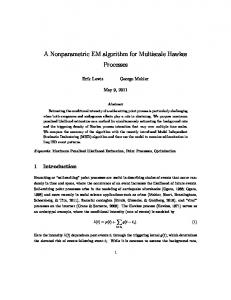
Figure 1(a) was analyzed with a granulometric analysis in order to find those scales that affect it most. The results obtained by using openings and closings (Fig. 2) show many important scales but it is necessary probe them and choose which of these present an adequate improvement. It is important to say that some images require more scales than others and might even require only one. In this case, two scales were used for MRF by openings, λ1=72 and λ2=136, according to the granulometric information and the tests with different scale values (Fig. 2(a)). MRF by closings used one scale λ1=148, which provides the more accurate improvement (Fig. 2(b)). Notice that, among the more important scales to choose, not always the highest G(λ) is used, usually the more accurate scales are among the first fifteen higher G(λ) values; the election depends more on obtaining an appropriate improvement and not to exceed with the new luminance.
SPIE-IS&T/ Vol. 7532 75320Q-4
(a)
(b)
Figure 2. Granulometric analysis of Fig. 1 using (a) openings and (b) closings.
It was observed that MRF by openings achieve a best improvement on dark regions, respect to MRF by closings. On the one hand, MRF by closings (6) was used for improving low luminance regions, but some elements on light region could be vanished; resulting image shows a significant luminance change on dark regions while in light regions it was too much (Fig. 3(a)). On the other hand, MFR by openings (4) was used for emphasizing and conserving the elements with good luminance; figure 3(b) shows how, although with small improvement, structures in light regions conserve a good luminance on the image. By now, each filter has been used individually but in this way no one can provide an accurate result for contrast enhancement. Nevertheless, by combining both MRF results is possible to obtain a satisfactory improvement; this combination is called combined MRF. ~
N
RM ( x, μ ) = ∑ n =1
ϕ μ n−1 ( f ) ~
ϕμn( f )
~
~
, with ϕ μ 0 ( f ) = ϕ 0 ( f ) = f
(a)
(6)
(b)
Figure 3. (a) MRF with openings using λ1=72 and λ2=136 and (b) MRF with closings using λ1=148.
In this case, both MRF images were combined in order to obtain the final improved image. It was taken 8% of Fig. 3(a) and 2% of Fig. 3(b) for combined MRF. Final image shows the new luminance where it is easier to make a distinction among the elements inside the room but also outside elements are visible (Fig. 4(a)). Luminance histogram demonstrates that luminance still covers all the range but it has been better distributed resulting in a more uniform contrast.
SPIE-IS&T/ Vol. 7532 75320Q-5
(a)
(b)
Figure 4. (a) Combined MRF result and (b) its luminance histogram.
Color images permits a better inspection of the results, so a comparison with two methods commonly used in contrast enhancement was also made. First method was multi-scale retinex which improve dark regions but it vanish the light. Second method was histogram equalization, which distributes all the luminance values along the range they need it or not; hue might be changed so its result might more adequate on gray-level processing. In both cases structures are no conserved.
(a)
(b)
(c)
(d)
Figure 5. (a) Original color image and its contrast improvement (b) by combined MRF, (c) Retinex and (d) histogram equalization.
SPIE-IS&T/ Vol. 7532 75320Q-6
3.2 Color enhancement As well illumination affects the contrast also affects its saturation. In processes as color segmentation, saturation is an important feature and its enhancement could make easier the object recognition. However, illumination conditions are not the unique reason of faded colors; some processes, as contrast enhancement, also originate them. The solution to this condition consists of increase saturation but in this process hue might be changed. Moreover, it is important to consider that not all regions are faded reason why a same saturation increase cannot be applied over all pixels. Although the main subject on this work is contrast, color enhancement is also a topic of interest in order to provide a more complete enhancement process. Color analysis As mentioned previously, color space u’v’Y separates chroma and luminance so in this case it is also used for color enhancement. Image color is distributed inside the chromatic triangle u’v’ (CT) with the aim of observe its colors and saturation (Fig. 6) [Lucchese and Mitra, 2004; Espino and Terol, 2007]. In the CT center are located the colors nearest to white, it means the achromatic region; the greater distance of the white, the greater color saturation. On saturation process, colors must not change suddenly from achromatic region to the limits of CT since this would cause an oversaturation. The proposed methodology consists on a multi-scale saturation which permits gradual changes according with the pixels location within the TC. This means that, with the aim of saturate faded colors it must establish a scale as a saturation limit in order to avoid oversaturation. The number of scales depends on image information.
(a)
(b)
Figure 6. (a) R, G, B chromatic coordinates on the u’v’Y color space and (b) the u’v’ chromatic triangle.
For example, color distribution in Fig. 7(a) shows that most of the pixels are near to the achromatic region and it produces a low saturated image as Fig. 7(b). Although it is necessary saturate the colors also it must be careful not to change its hue. Figure 7(d) is the result of a saturation which moves away the pixels from the achromatic region generating a new color distribution (Fig. 7(c)). Colors were enhanced and have a high intensity; yet, the main building color, originally white, was changed and now it has a reddish color. This is an undesired effect because a color enhancement must not change the chromatic information of the image. Multi-scale color saturation Enhance color without change the hue is the main objective of our proposed method. It is important remember that images contains chromatic and achromatic information and both are equally important for the image realism. In this case, the saturation of chromatic information must be increased and achromatic information must be keep. For this, firstly the access to the lightest pixels was limited by drawing an achromatic triangle (AT) around them; in this way, it is avoided that lightest pixels acquire color. Secondly, pixels that do not belong to the AT should move away of it but at their same hue direction. Then, it is important to know the location of pixel x and its distance to each side of CT
SPIE-IS&T/ Vol. 7532 75320Q-7
_____ _____ _____
( RG, GB , BR ) in order to know its direction of saturation; x must be moved toward the nearest side. Once known which pixels are going to move and to where, it is necessary to establish also in what extend will be saturated. For example, if the pixels are moved in the right direction until the TC limits saturation result is not accurate because image goes from faded to oversaturated. In order to avoid this, a gradual color enhancement which uses scales is proposed and based on each scale size its respective enhance triangle is drawn. The result is a set of triangles contained one within another.
(a)
(b)
(c)
(d)
(e)
(f)
Figure 7. (a, c, e) Color distribution triangles of (b) original faded image, (d) color enhancement without limits on achromatic region and (f) multi-scale color enhancement with scales α1=20, α2=50, respectively.
Once direction of saturation is known, the intersection points between pixel x and the AT, enhance triangles and the TC must be found. After, it is determined which triangles are adjacent to x and move it toward the farthest (ps) in the proportion calculated by (7) (Espino-Gudiño et al., 2007); where u’ and v’ are the current chromatic values of x, u’s and v’s are the chromatic values of ps, Y is the x luminance and u’new and v’new are the new saturated values of x.
SPIE-IS&T/ Vol. 7532 75320Q-8
u' u ' new =
Y Y + u's v' v' s Y Y + v' v' s
and v' new =
2Y Y Y + v' v' s
(7)
Multi-scale color enhancement of Fig. 7(b) moves central pixels in the direction of its hue, which will be manifested on new color intensity. However, since original pixels are close to the achromatic region, their AT must be small in order to conserve only the lightest. For this image, the AT have a size of 0.03 of the CT total size and two scales were used α1=20 y α1=50 (Fig. 7(e)); it means that, the size for each enhance triangle (Tα1 y Tα2) is 0.2 and 0.5 of the distance from the CT to the AT, respectively. First scale objective is to saturate the more faded pixels but avoiding oversaturation; second scale improvement the notable but still faded colors. In order to differentiate each triangle, it was establishing that: AT is in the center, enhance triangles (Tαn) are marked with solid line and CT is marked with dotted line; enhance triangles are numerated in ascendant order from the inside out, where Tα1 is the closest one to AT and Tαn is the closest one to TC. Finally, Fig. 7(f) is the result of the new saturation in which one can appreciate details not visible on original image. Other results of multi-scale color enhancement are shown on Fig. 8.
(a)
(b)
(c)
(d)
Figure 8. (a, c) Faded images and its multi-scale color enhancement with scales (b) Tα1=5, Tα2=25, Tα3=35 and (d) Tα1,2=10, Tα1=23, respectively.
SPIE-IS&T/ Vol. 7532 75320Q-9
4. CONCLUSION Morphological rational filters are helpful on contrast enhancement and, due to they use transformations by reconstruction, original structures are conserved. MRF with closings could enhance low luminance values but it vanish light elements. MRF with openings could be used for remarking dark structures and restoring the lost information on light regions. Moreover, the combination of both filters provides a more uniform result when different luminance affects the image. In addition, by using a multi-scale color enhancement, a satisfactory color improvement can be achieved and oversaturation can be controlled. This is a simple process which also allows to choose only those faded colors for its saturation. Finally, contrast and color improvement could be applied as a pre-processing step to facilitate a further task.
REFERENCES [1] Meyer, F. and Serra, J., “Activity Mappings”, Signal Processing. Papers 16, 303-317 (1989). [2] Land, E. and McCann, J. J., “Lightness and retinex theory”, Journal of the Optical Society of America. Papers 61(1), 1-11 (1971). [3] Espino-Gudiño, M., Santillan, I. and Terol-Villalobos, I. R., “Morphological Multiscale contrast approach for gray and color images consistent with visual perception”, Optical Engineering. Papers 46(6), 1-14 (2007). [4] Matheron G., [Eléments pour une théorie des Milieux poreux], Masson Ed., Paris, (1967). [5] Serra J., “Toggle Mappings”, Technical report N-18/88/MM, Centre de Morphologie Matematique, ENSMP, Fontainebleau, France, (1988). [6] Lucchese, L. and Mitra, S. K., “A new class of chromatic filters for color image processing. Theory and applications”, IEEE Transactions on Image Processing. Papers 13(4), 534-548 (2004). [7] Serra J., [Image Analysis and Mathematical Morphology], Ed. Academic Press, Ney York, USA, Vol.2, (1988). [8] Soille P., [Morphological Image Analysis], 2nd. ed., Heidelberg: Springer-Verlag, (2003). [9] Vincent L., [Current Trends in Stochastics Geometry and its Applications], Chapman&Hall editors, (1997). [10] Lantuéjoul C. and Maisonneuve, F., “Geodesic methods in quantitative image analysis”, Pattern Recognition. Papers 17(2), 177-187 (1984). [11] Pajares, G. and de la Cruz, J. M., [Visión por computador: imágenes digitales y aplicaciones], Alfaomega, (2002). [12] Fairchild, M. D., [Color Appearance Models], Wiley Ed., N.Y., (2005). [13] Kogan, R. G., Agaian, S. and Panetta, K., “Visualization using rational morphology and magnitude reduction”, Proc. SPIE 3387, 153-163 (1998).
SPIE-IS&T/ Vol. 7532 75320Q-10