Analyses of the secular trends in death rates in. England and Wales and the United States between. 1901 and the ... medical care.56 Subsequently, this list of diseases for which ..... Cervical cancer, secondarily preventable through screening ...
PAPERS
Mortality from causes amenable and non-amenable to medical care: the experience of eastern Europe Richard James Boys, Donald Peter Forster, Peter Jozan The all cause mortality experienced by eastern Objective-To investigate comparative national European countries in the late 1980s were achieved in trends in mortality from conditions amenable to western Europe in the late 1950s.8 The question is timely, appropriate medical care and from those whether this 30 year time delay was due mainly to ,differences in medical care or to those in the environconsidered not to be amenable to such care. Design-Analysis of trends in direct age standard- ment and personal health behaviour. The objective of this paper, therefore, was to examine and compare ised mortality from the 1950s to 1987. Setting-Four eastern European nations time trends in mortality from 1950 onwards for (Hungary, Czechoslovakia, Poland, the German conditions amenable and non-amenable to timely Democratic Republic) and two western European medical care in four former eastern bloc states and (the Federal Republic of Germany and England and two western European and two North American Wales) and two North American nations (United democracies. States and Canada). Subjects-The total populations of the relevant countries during the period examined. Methods Main outcome measures-Proportional changes We used mortality data from computer tape tranover time in age standardised mortality. Mortality scripts held by the World Health Organisation's data from amenable and non-amenable causes was bank in the analysis.9 Trends in mortality from 1950 to restricted to the age group 0-64. 1987 were examined for nine countries: Hungary, Results-A divergence in the trends for all cause Czechoslovakia, Poland, the German Democratic mortality between eastern Europe and the western Republic, the Federal Republic of Germany, England nations occurred in about 1970, when the rates in and Wales, the US, and Canada. The transcripts western countries steadily declined but those in contain mortality data classified by age and sex eastern Europe remained fairly static. In the age according to the International Classification of group 0-64 mortality from causes considered amen- Diseases in summarised categories. Data were drawn able to medical care fell less quickly in eastern from the 6th, 7th (Intermediate A list of 150 causes), Europe than in the West, particularly after 1970. In 8th (A list), and 9th revisions (Basic B list) of the the same age group, mortality from non-amenable classification (ICD-6 to ICD-9). Throughout the causes rose in eastern European countries from the period examined, equivalent diagnostic categories of late 1960s compared with substantial declines in the ICD were used and the alignment of the various such mortality in the West. revisions was checked. 0 Graphs of trends in death rates Conclusions-Non-amenable causes of death for individual diagnostic grou's for each country were seem to be the principal, but not exclusive, reason examined to detect any substantial alterations in rates for lack of improvement in trends in all cause from year to year, particularly for years in which mortality in eastern Europe from 1970. The agenda the ICD changed from one edition to another. For for action in eastern Europe should give priority to a example, in Czechoslovakia in 1960, deaths previously healthier lifestyle and improvement of the environ- classified as cerebrovascular disease were subsequently ment though not neglect enhancements in the quality placed in the hypertensive disease category. This and efficiency of direct health services. procedure was reversed towards 1968. Thus the categories hypertensive disease and cerebrovascular disease were amalgamated to ensure consistent interIntroduction pretation. Data were missing for some countries and Analyses of the secular trends in death rates in diagnoses, especially in the early part of the periodEngland and Wales and the United States between for example, for deaths from all causes in Hungary 1901 and the early 1970s suggested that medical 1950-4, Czechoslovakia 1950-2, Poland 1950-8, the measures seem to have contributed little to the overall German Democratic Republic 1950-72, and the decline in mortality.'2 Regression analysis in cross Federal Republic of Germany 1950-1. All mortality data were age standardised by the sectional studies in the same countries showed that the variation in mortality is more sensitive to socioeconomic direct method using the European standard populacharacteristics, environmental conditions, and the tion," which was selected in preference to the world effects of education than to the provision of medical standard population as that is weighted towards the care.34 Rutstein et al, however, developed a list of younger age groups typical of developing countries. measurable negative indices relevant to the quality of The standardisation process used one year age bands medical care.56 Subsequently, this list of diseases for up to age 5 years and thereafter in five year age groups. which, with appropriate, timely medical care, it was Predominantly, the standardisation was carried out considered that death should not occur or occur within two separate broad age groups: 0-64 and 65 and rarely, was used to study "avoidable" or "amenable" over. The selection of diagnostic categories amenable to mortality.' Abstract
Department of Mathematics and Statistics, University of Newcastle upon Tyne, NEI 7RU Richard James Boys, PHD, lecturer in statistics Division of Epidemiology & Public Health, School of Health Care Sciences, Medical School, University of Newcastle upon Tyne, NE2 4HH Donald Peter Forster, FFPHM, senior lecturer in epidemiology
Population and Health Statistics Department, Hungarian Central Statistical Office, 1525 Budapest II, Hungary
Peter J6zan, MD, head Correspondence to: Dr Forster. BMJ 1991;303:879-83
BMJ
VOLUME
303
12
OCTOBER
1991
879
medical care was derived from the list of unnecessarv untimely deaths by Rutstein et al.6 Thus conditions in particular age groups amenable to primary prevention by medical means (for example, acute poliomyelitis) or secondary prevention through effective treatment (for example, appendicitis) were included. Conditions responsive mainly to changes in health related behaviour (for example, carcinoma of the bronchus) or to changes in behaviour and the condition of population in which they occurred (for example, violent deaths) or environmental changes were designated as non-amenable. The differentiation of conditions into those amenable and non-amenable to medical care was restricted to the broad age group 0-64, though for some amenable conditions the concept of avoidability was sometimes confined to more specific age groups. The mortalities for the aggregate amenable and nonamenable categories presented were always recalculated with reference to the broad age group 0-64. Table I sets out the categories of amenable conditions. Comparable data for each country in the transcripts for Hodgkin's disease were available only from 1979 and for ischaemic heart disease from 1968 onwards. Hodgkin's disease, which contributed only a small proportion of all amenable causes, was omitted from this aggregate group for the analysis of time trends. The ischaemic heart disease category was analysed separately for three reasons: firstly, because of the lack of comparable international data before 1968; secondly, because of the large contribution of this disease to total death rates; and, thirdly, because the disease probably represents an interplay of health behaviour and medical care factors. Coronary heart
disease is widely thought to be responsive to primary prevention by changed behaviour related to health, although the evidence from controlled trials is modest.'2 Effective secondary prevention in the acute myocardial infarct component of ischaemic heart disease alone has been revolutionised during the 1980s by the use of aspirin and fibrinolytic treatment." The aggregate group of non-amenable causes was therefore calculated in two ways: by including and excluding ischaemic heart disease. For graphical presentation the death rates in certain countries were combined. The combinations used reflected logical groupings and the fact that the rates for the individual countries in a group tended to be broadly similar and show similar secular changes. For each combination of countries used in the figure the appropriate weighting of death rates by population size was applied. Results Table II shows the changes in the all cause standardised death rates per 100 000 European standard population in the age groups 0-64 and 65 and over between three time periods. The three eastern European nations, Hungary, Czechoslovakia, and Poland, for which data were available in the 1950s and '60s, showed reductions in the standardised rates in the age band 0-64 until the mid-1960s. This initial decrease in mortality was followed by a failure to improve further and an actual rise in the 1970s and 1980s in Hungary and Poland. In contrast, the western countries showed continuous improvement in mortality, albeit with
TABLE I -Conditions amenable to medical care, age group 0-64 ICD code
Age group (years)
Diagnostic category Cholera
Typhoid fever Tuberculosis Diphtheria, tetanus, and acute poliomyelitis Whooping cough; streptococcal sore throat; scarlet fever, and erysipelas; and measles Syphilis Cervical cancer Hodgkin's disease Diabetes mellitus Non-toxic goitre and thyrotoxicosis, with or without goitre Avitaminoses and nutritional deficiencies Epilepsy Acute rheumatic fever and chronic rheumatic heart disease Hypertensive disease and cerebrovascular disease Pneumonia, bronchitis, emphysema, and asthma Peptic ulcer Appendicitis Intestinal obstruction and hemia Cholelithiasis and cholecystitis Infections of skin and subcutaneous tissue, otitis media or mastoiditis, osteomyelitis and penostitis, and meningococcal infections Maternal mortality Certain conditions originating in perinatal period
ICD-6 and ICD-7
ICD-8
ICD-9 001 002-0 010-018, 137 032, 037, 045 033, 034, 035, 055
0-64
043, 040
000, 001
0-64 0-64 0-14
001-008,010-019 055, 061, 080 056, 050, 051, 085
010-019
0-64 15-64 0-34 0-49
020-029 171
090-097 180
090-097 180 201
260
250
250
0-64 0-64 0-64
250-252 280-286 353
240-242 260-269 345
240-246 260-269 345
0-49
400-402,410-416 330-334, 440-443, 444-447 490-493, 500-502 540, 541 550-553 560, 561, 570 584, 585
390-392, 393-398 400-404, 430-438 480-486, 490-493 531-533 540-543 550-553, 560 574, 575
390-392, 393-398 401-405, 430-438 480-486, 490-493 531-533 540-543 550-553, 560 574-575-1
35-64 0-49 5-64 0-64 0-64 5-64
032, 037, 040-043 033, 034, 035, 055
0-64 690-698, 391-393, 730, 057 680-686, 381-383, 720, 036 680-686, 381-383, 730, 036 All maternal 640-652, 660, 670-689 630-645, 650-662, 670-678 630-646, 651-676, 670-678 ages 760-779 760-779 760-776 0-1
TABLE II -Secular changes in all causes mortality (directly standardised per 100 000 European standard population) Age group (years)
Rate per 100000 1985-7 0% Change 1955-9 to 1970-4 l % Change 1970-4 to 1985-7 [Rate per 100000 1985-7 1 % Change 1955-9 to 1970-4 >65 [ %Change 1970-4 to 1985-7 [Rate per 100000 1985-7 All ages %o Change 1955-9 to 1970-4 %o Change 1970-4 to 1985-7
0-64
Federal Republic of
England
Democratic
Republic;
Germany
Wales
Canada
446-7 -25-2
338-1
287-0 -10-2 -22-0
330-0 8-7
-3-8
6920-2
7034-8
282-2 -14-2 -27-3 5433 -8
268-8 -14-5
7.3
--28-4 4730-3
-26-2 4863-7 - 10-4 -17-4 828-7 --9-8 --20-7
German Period
Hungary Czechoslovakia* Polandt 520-0 -14-2 17-0
7268-5 -3-9 -4-2 1262-3
-7.5 2-6
422-9 -4-0 -3-2 7528 -6 0-8 -2-1
1204-5 -0-7 -2-5
-4.7 1-7 1158-8 -12-6 3-6
-5.9 1074-7
-5.3
and
_9-9
5643.7 -9.3
-23-7 848-9 -11-3 -24-8
-15 4 876-3 -9-6 -17-5
-
15-6
-16-6 759-6 -15 -6 -20-7
US
*Data recorded for 1985-7 are based on 1985 and 1986 data alone.
tData recorded for 1955-9 are based on 1959 alone.
tData missing for 1955 -9; data recorded for 1970-4 are based on 1973 and 1974 data alone.
880
BMJ VOLUME 303
12 OCTOBER 1991
X* Xw n
TABLE III Sec ular changes in mortality from amenable and non-amenable causes andfrom ischaemic heart disease (directly standardised per 100 000 Eulropean standard population) German Democratic
Age group Period
(years)
[Rate per 100000 1985-7 'o (Change 1955-9 to 1970-4 [°h Change 1970-4 to 1985-7
103-8X -33-5
[ Rate per 100000 1985-7 o%Change 1955-9 to 1970-4 % Change 1970-4 to 1985-7
416-22 -3 I6 29-C0
0-64
j Rate per 100000 1985-7 'o(Changc 1970-4 to 1985-7
294-I8
25-64
[ Ratc per 100 000 1985-7 % C(hange 1970-4 to 1985-7
142-4 41 - 8
0-64
0-64
Republict
Hungary Czechoslovakia* Polandt
Amenable deaths5 (excluding Hodgkin's disease) 57-1 76-0 72-5 -28-3 -42-2 -22-6 -26-5 -28-2
-14,
England and Wales
Federal Republic of Germany
Canada
US
-42-5
35-0 -40-4
-61-6
-49.7
22-3 -50-7 -60-1
33-1 -46-4 -51-2
252-0 15-8 15 5
246-5 -1-9 -22-9
296-9 4-4 -21-7
159-0 15-7
174-1 -15-2
215-0 -10-5
71-1
123-1
-12-9
-14-9
85-5 -42-7
92-8 -49-3
29-0
Non-amenable deaths|[ (including ischaemic heart disease) 253-2 370-7 281-9 351-6 -2-5 -17-7 6-9 2-9 16-5 -190 4-6
-
Non-amenable deaths (excluding ischaemic heart disease) 187-7 275-4 216-6 239-8 0-5 -20-1 9-5 2-2 26 1l
-
Ischaemic heart disease
65-0 22-0
102-7 71-4
137-8 13-4
*Data recorded for 1985-7 are based on 1985 and 1986 data alone. tData recorded for 1955-9 are based on 1959 data alone. tData missing for 1955-9; data recorded for 1970-4 are based on 1973 and 1974 data alone. SSum of the dcaths in the categories and age groups in table II but excluding Hodgkin's disease. ||Sum of deaths occurring outside the categories and age groups in table II. 1Ischaemic heart disease during 1970-4 consists of ICD-8 codes 410-414 and during 1985-7 of ICD-9 codes 410-414.
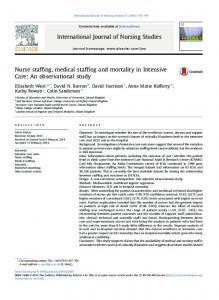
400300-
200CL)
a)a a) O X .
(0
n u)
0
O E
a)
o
-C
O'Cu OL X
a,-0
m CD Cu
.0 :3 (A
100-
O
Z-_; -? QCuD ._, a a, a)
75-
-C 0CQ +
cD
.
Non-amenable causes
{
0
25
0t
Federal Republic of Germany England and Wales
{
Hungary Czechoslovakia Poland
Amenable causes
{
I
I
I
1950
1955
1960
1
1965
1
1970
I
1975
I
1980
us
{
-*
50-
Hurgary Czechoslovakia Poland German Democratic Republic Canada
German Democratic Republic
Federal Republic of Germany England and Wales
Canada
us
l
I
1985
1990
Year Trends in age standardised mortality from amenable and non-amenable causes among subjects aged 0-64
small fluctuations, and with an acceleration in the rate of decrease in the 0-64 age group occurring in the early 1970s. When the standardised death rates in those aged 65 and over were considered the long term trend was for the eastern European countries to show small improvements over the period, having started from a position in the 1950s similar to that of the western European nations. Canada and the US showed the lowest standardised death rates among elderly people in the late 1980s, having exhibited a consistent reduction in the rates with time. The standardised death rates in England and Wales and the Federal Republic of Germany in the 1980s were intermediate between those BMJ
VOLUME 303
12 OCTOBER 1991
of eastern Europe and North America, though the rate of reduction was accelerating (table II). The figure illustrates the trends in the standardised death rates for aggregated amenable and non-amenable (including ischaemic heart disease) conditions for the age group 0-64 for groups of countries. Table III shows the equivalent data together with those for ischaemic heart disease in three time periods for each country separately. With respect to amenable conditions, all countries showed a continuous rate of decrease, though that for the western democracies was considerably more rapid than for Hungary, Czechoslovakia, Poland, and the German Democratic Republic. Indeed, when the change from 1955-9 to 1970-4 is compared with 881
that from 1970-4 to 1985-7 there is some evidence that the rate of progress is accelerating in Western nations but not in the former eastern bloc states (table III). The trends for non-amenable conditions in the age group 0-64 in both the European and North American democracies started to show improvements only in the early 1970s after a period of static rates from the 1950s. Eastern Europe also showed stagnation though with some fluctuation of trends in mortality from nonamenable causes during this early period. From about 1970, however, each eastern European country exhibited a worsening of these rates. Changes in mortality from ischaemic heart disease from 1970-4 to 1985-7 followed a pattern more typical of death rates from non-amenable causes (excluding ischaemic heart disease) in both eastern and western Europe but closer to the degree of improvement in death rates associated with amenable conditions in North America, particularly in the US. Table IV shows five examples of categories within the amenable mortality group. Death rates from diphtheria, tetanus, and acute poliomyelitis, illustrating conditions amenable to primary prevention through the medical means of immunisation, showed appreciable falls in all countries, though from higher base values in the 1950s in central and eastern Europe. Cervical cancer, secondarily preventable through screening and early effective intervention, showed a variable pattern. Mortality from cervical cancer fell in North America, less so in western Europe and the German Democratic Republic, with little improvement in the other eastern European countries during the past 15 years. The picture is complicated by the increased recognition of the diagnosis of cervical cancer through the introduction of screening programmes, particularly if subsequent treatment has variable effectiveness in different countries. Mortality from appendicitis declined more rapidly than that for peptic ulcer but more so in both conditions in the West. The numerically important hypertensive and cerebrovascular disease category showed reductions of at least 30% in the West in each of the 15 year periods compared with relatively little change or an increase in eastern Europe.
Discussion The data presented extend over 30 years. Difficulties in allocating conditions to amenable and non-amenable categories can occur as some conditions were less treatable by secondary prevention, say, in the 1950s than in later periods. An arbitrary decision was also taken that amenable causes would be restricted to the age group 0-64 as a maximum, though there are arguments for extending this age range. The distinction between amenable and non-amenable causes is necessarily approximate, and there will be some overlap as not all diseases designated as amenable are completely avoidable by ideal health care and the nonamenable causes are not inevitably uninfluenced by medical care. Equally, it is conceivable that individual subjects with ostensibly non-avoidable conditions are helped and have their deaths delayed by the successful treatment of some concomitant avoidable disease complicating the main condition.'4 The dichotomy between deaths from amenable and non-amenable causes used here, which is fixed for each country and the whole time period, is helpful in identifying and comparing trends but should not be carried too far. Thus at each time point, although the precise proportion of total mortality accounted for by avoidable causes may be debatable, there is little doubt that in the present state of medicine the non-amenable mortality is an important contributor to total mortality. The use ofmortality as the index of health implies a negative yet a measurable and useful approach.5 Ideally, it would have been preferable to compare countries with a positive definition of health, except that the routine measurement of such aspects of vitality and wellbeing remains elusive. When the change in the all cause mortality in those aged 0-64 for the 15 years from 1955 to 1969 was compared with that from 1970 to 1974 a worsening or virtually static situation was evident during the second period in eastern Europe. In western countries, the improvement in the death rate in the under 65 age group did not seem merely to have delayed higher mortality until a later age as the death rates for those aged 65 and over also improved over the same three decades. Inspection of the mortality for those aged 0-64 in
TABLE IV -Secular changes in mortality from selected amenable causes (directly standardised per 100000 European standard population) Age group (years)
Period
Hungary Czechoslovakia* Polandt
German Democratic Republict
Federal
Republic of Germany
England and Wales
Canada
US
Diphtheria, tetanus, and acute poliomyelitis 0-64
[Rate per 100000 1985-7
0-07 -89-6 -70 8
0-02 -88-7 -86-7
0-06 -95-2 -50-0
-50-0
9.73
% Change 1970-4 to 1985-7
109-9 12-0
7-45 -21-4 0-8
Cervical cancer 11-34 162-2 -12-8
-42-0
Rate per 100 000 1985-7 g % Change 1955-9 to 1970-4 [ % Change 1970-4 to 1985-7
0-34 -36-4 -61-8
0-28 -36-1 -59-4
1 % Change 1955-9 to 1970-4
[ % Change 1970-4 to 1985-7 15-64
(Rate per 100000 1985-7
(f5emales)
%
Change
1955-9 to 1970-4
0-02
8-01
0-00
0-00
0-00
-94 0 NA
-97-8 NA
-93-3 NA
4-16 50-9 -50 2
6-76 -13-9 -18-3
-39 5 -53-2
0-09 -64-8 -91 0
0-08 -70-8 -74-2
-74.7 -73-9
1-02 -27-4
1-57 -50-3 -32-6
-40-5 -63-3
3 14
0-00
-96-0 NA
3 70 -45-6 -44 0
Appendicitis [
0-64
5-64
[Rate per 100 000 1985-7
1 % Change 1955-9 to 1970-4 [ % Change 1970-4 to 1985-7
3.57 2-2 -13-6
2-68 -9.7 -9-8
0-32 2-4
-61-9
Peptic ulcer 2-75 -11-3 -28-6
0-72 -36-8 2-71
-27-7
-68-2
0-06
0-76
0-09
-59.3 -72-7 0-74
-50-4 -63-5
Hypertensive and cerebrovascular disease 35-64
[Rate per 100 000 1985-7
% Change 1955-9 to 1970-4 l % Change 1970-4 to 1985-7
124-42 -8-7 36-8
82-18 19-4 -11-9
74-47 10-9 40-7
31-59 -30-9
63-21
-39-9
1-0
37-76
-32-2 -41-3
21-73
-46-6 -49-7
33-75
-48-9 -40-8
*Data recorded for 1985-7 are based on 1985 and 1986 data alone.
tData recorded for 1955-9 are based on 1959 data alone. :tData missing for 1955-9; data recorded for 1970-4 are based on 1973 and 1974 data alone. ISum of the deaths in the categories and age groups in table II but excluding Hodgkin's disease. I|Sum of deaths occurring outside the categories and age groups in table II. ¶Ischaemic heart disease during 1970-4 consists of ICD-8 codes 410-414 and during 1985-7 of ICD-9 codes 410-414. NA= not applicable.
882
BMJ
VOLUME
303
12 OCTOBER 1991
terms of amenable and non-amenable causes disclosed that the source of the problem for the eastern European countries lies principally, though not wholly, in nonamenable deaths. The change from 1970-4 to 1985-7 showed an increase for each eastern European country, particularly for Poland and Hungary. Over the same 15 years mortality in non-amenable conditions (including ischaemic heart disease) in the Western countries was reduced by at least 15%. This is not to say that there is cause for complacency concerning management of amenable conditions in eastern Europe. Although there were improvements in the mortality from amenable causes in the 15 years before and after 19704, they were substantially less than in the West. These improvements in the western democracies were achieved in appreciably different systems of health care. The modest improvements in mortality from amenable causes achieved by the eastern European health systems, based mainly on the Soviet model, are not likely to be explained by lack of availability of doctors or hospital beds as these supply indicators have not been inferior to those in the West. 16 There has been an element of a lack of efficiency in eastern European health services compared with their western counterparts7 and a lack of open critical debate about the quality and organisation of health services. Moreover, not only has each eastern European country had a low gross domestic product per head but recent data from the World Bank indicate that the percentage of gross domestic product spent on health care has been consistently less than in countries of the Organisation of Economic Cooperation and Development (OECD). 18 Notwithstanding, eastern European health systems have comprehensive coverage already in place and have achieved some success for example, in always achieving high immunisation rates in children.'9 Health policy, however, seems to be changing; for example, a health insurance system with national coverage has been proposed in both Hungary and Czechoslovakia.20 In part, one of the incentives for this type of reform, towards payment of doctors and hospitals on a fee per item of service basis, is to motivate greater health care activity. This change in the system needs to be accompanied by attention to quality control. The non-amenable causes of death, however, seem to dominate the agenda for action in both East and West. With respect to the environment in eastern Europe, there has been neglect in implementing the effective monitoring of industrial and household emissions and effluents. Unlike in the western nations, there was little shift of emphasis, through technological change, from heavy to lighter industries. Thus, there is sulphur dioxide air pollution from the burning of lignite (brown coal) and atmospheric and water pollution with heavy metals.2' The agenda for action on environmental safety is urgent and is being helped by a programme being administered by the European Commission, financed by western countries.22 With respect to personal health related behaviour, smoking is particularly high in Hungary and Poland23 and alcohol consumption is high (> 10 litres of absolute alcohol per head per year) in Hungary and the two Germanys.24 The population in eastern Europe also has had limited access to fresh fruit and vegetables owing to the type of economic system and lack of wealth. Moreover, within former eastern bloc states the variation in mortality particularly from non-amenable causes, correlates highly with socioeconomic circum-
BMJ
VOLUME
303
12
OCTOBER
1991
stances.25 Risk factors in lifestyle may also act multiplicatively with environmental pollution in producing ill-health.26 In the most economically developed of nations it has been emphasised that medical care is less important in a national health programme than standard of living and disease prevention.27 This prescription for the US also applies with increased emphasis to eastern Europenamely, that the standard of living through increased economic wealth and preventive activities and a healthier lifestyle and environmental improvement are probably more important than but do not negate the need for improved medical care. We thank Dr Alan Lopez, World Health Organisation, Geneva, for providing the computer transcripts; Karen Cowley for secretarial help; and the British Council and Newcastle University Research Fund for support. A complete table of standardised "amenable" mortality by country, time period, and diagnostic group may be obtained from DPF on request. 1 McKeown T, Record RG, Turner RD. An interpretation of the decline in mortality in England during the twentieth century. Population Studies 1975;29:391-422. 2 McKinlay JB, McKinlay SM. The questionable contribution of medical measures to the decline of mortality in the United States in the twentieth century. Milbank Memorial Fund Quarterly 1977;55:405-28. 3 Martini CJM, Allan GJB, Davison J, Backett EM. Health indexes sensitive to medical care variation. Intj Health Serv 1977;7:293-309. 4 Auster R, Leveson I, Sarachek D. The production of health: an exploratory study. In: Fuchs, V, ed. Essays in the economics of health and medical care. New York: National Bureau of Economic Research, Columbia University Press, 1972:135-58. 5 Rutstein DD, Berenberg W, Chalmers TC, Child CG, Fishman AP, Perrin EB. Measuring the quality of medical care. NEnglJMed 1976;11:582-8. 6 Rutstein DD, Berenberg W, Chalmers TC, Child CG, Fishman AP, Perrin EB. Measuring the quality of medical care: second revision of table of indexes. NEnglj Med 1980;302:1146. 7 Mackenbach JP, Bouvier-Colle MH, Jougla E. "Avoidable" mortality and health services: a review of aggregate data studies. J Epidemiol Community Health 1990;44:106-l1. 8 Forster DP, J6zan P. Health in eastern Europe. Lancet 1990;335:458-60. 9 World Health Organisation. World health statistics annual, 1989. Geneva: WHO, 1989:431-9. 10 Alderson MR. Mortality, morbidity and health statistics. New York: Stockton, 1988:15-6. 11 Waterhouse J, Correa P, Muir C, Powell J, eds. Cancer incidence in five continents. Vol III. Lyons: Intemational Agency for Research on Cancer, 1976:456. 12 McCormick J, Shrabanek P. Coronary heart disease is not preventable by population interventions. Lancet 1988;ii:839-41. 13 ISIS-2 Collaborative Group. Randomised trial of intravenous streptokinase, oral aspirin, both or neither among 17 187 cases of suspected acute myocardial infarction: ISIS-2. Lancet 1988;ii:349-60. 14 Poikoilainen K, Eskola J. The effect of health services in mortality: decline in death rates from amenable and non-amenable causes in Finland, 1969-81. Lancet 1986;i: 199-202. 15 Kleinman JC. The continued vitality of vital statistics. Am J Public Health 1982;72: 125-7. 16 World Health Organisation. World health statistics annual, 1983. Geneva: WHO, 1983. 17 Forster DP, Frost CEB. Hospital performance and regional equity. Social Policy and Administration 1984;18:247-59. 18 Schweitzer J. Transition in Eastem Europe-the social dimension. Finance and Development; Dec 1990:6-8. 19 World Health Organisation. Global strategy for health for all: monitoring 1988-89. Detailed analysis ofglobal indicators. Geneva: WHO, 1989. 20 Working Group for the Reform. Reform of health care in the Czech Republic. Prague: Ministry of Health and Social Affairs, Czech Republic, 1990. 21 Norska-Bor6wka I. Poland: environmental pollution and health in Katowice. Lancet 1990;335:1392-3. 22 Whitehead C. Czechoslovakia launches a great cleanup. New Scientist 1990;127:20. 23 World Health Organisation Regional Office for Europe. The work of WHO in the European region, 1987: annual report of the regional director. Copenhagen: WHO Regional Office for Europe, 1988. 24 Smart RG. Is the post-war drinking binge ending? Cross-national trends in per capita alcohol consumption. Brj Addict 1989;84:743-8. 25 J6zan P. Studies in mortality differentials: an ecological study of mortality differentials in Budapest. Part 1. Budapest: Central Statistical Office, 1987. 26 Jedrychowski W, Becher H, Wahrendorf J, Bosa-Cierpialek A. A case-control study of lung cancer with special reference to the effect of air pollution in
Poland. J Epidemiol Community Health 1990;44:114-20. 27 Terris M. Ethical essentials of a national health program. 7 Public Health
Policy 1990;11:5-10. (Accepted 23 July 1991)
883