Hindawi Journal of Analytical Methods in Chemistry Volume 2018, Article ID 3184759, 7 pages https://doi.org/10.1155/2018/3184759
Research Article LC-MS/MS Method for Simultaneous Quantification of Dexmedetomidine, Dezocine, and Midazolam in Rat Plasma and Its Application to Their Pharmacokinetic Study Wenjuan Cui ,1 Qin Liu ,1 Shan Xiong ,2,3,4 and Lujun Qiao
1
1
Intensive Care Unit, Shengli Oilfield Central Hospital, Dongying, Shandong 257034, China Institute of Materia Medica, Shandong Academy of Medical Sciences, Jinan, Shandong 250062, China 3 Key Laboratory for Biotech-Drugs Ministry of Health, Jinan, Shandong 250062, China 4 Key Laboratory for Rare and Uncommon Diseases of Shandong Province, Jinan, Shandong 250062, China 2
Correspondence should be addressed to Shan Xiong;
[email protected] and Lujun Qiao;
[email protected] Received 7 December 2017; Revised 27 February 2018; Accepted 16 April 2018; Published 20 May 2018 Academic Editor: Erwin Rosenberg Copyright © 2018 Wenjuan Cui et al. This is an open access article distributed under the Creative Commons Attribution License, which permits unrestricted use, distribution, and reproduction in any medium, provided the original work is properly cited. A simple, sensitive, and accurate LC-MS/MS method was established and validated for the simultaneous quantification of dexmedetomidine, dezocine, and midazolam in rat plasma. Chromatographic separation was achieved on a C18 column (50 mm × 2.1 mm, 3 µm) using a mobile phase composed of water (containing 0.1% formic acid) and acetonitrile. The lower limits of quantification were 0.1, 0.1, and 0.2 ng/mL for dexmedetomidine, dezocine, and midazolam in rat plasma, respectively. The analytes were determined with selected reaction monitoring under positive ionization mode. The intra- and interday precision and accuracy were all within acceptable limits during the entire validation, and the stability of analytes was acceptable under various storage conditions. The validated method was successfully applied in pharmacokinetic studies of dexmedetomidine, dezocine, and midazolam following intravenous injection.
1. Introduction In intensive care unit (ICU), it is becoming increasingly important to measure and manage delirium, pain, and agitation in adult patients. Actually, guidelines for the treatment of delirium, pain, and agitation in critically ill patients do not provide recommendations on pharmacologic treatment [1, 2]. For most patients in ICU, a safer and more effective strategy that ensures patients ease while maintaining a light level of sedation is related to the improvement of clinical outcomes [3]. In many Chinese hospitals, the combined application of dexmedetomidine, dezocine, and midazolam is used for the treatment of delirium, pain, and agitation in adult patients in ICU, and the treatment effect shows these agents have made significant advances in critically ill patients [4–6]. But up to now, being lack of enough attention and over emphasis on efficacy, the pharmacokinetic characteristics of
dexmedetomidine, dezocine, and midazolam combination in ICU patients were still unclear. In the previous studies, they had been reported for the pharmacokinetic study of dexmedetomidine [7], dezocine [8], and midazolam [9] in the patients and healthy volunteers, respectively. There had been only one study done to research the plasma concentrations and sedative effects of a dexmedetomidine, midazolam, and butorphanol combination after transnasal administration in healthy rabbits [10]. The objective of the present study was to establish a simple, sensitive, and accurate LC-MS/MS method for simultaneous determination of dexmedetomidine, dezocine, and midazolam in rat plasma and investigate the pharmacokinetic characteristics of dexmedetomidine, dezocine, and midazolam in rats. Then, the method would lay the foundations for monitoring of dexmedetomidine, dezocine, and midazolam in patient plasma in ICU.
2
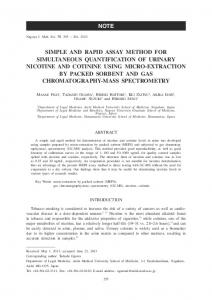
Journal of Analytical Methods in Chemistry Table 1: The optimized mass spectrometric parameters for dexmedetomidine, dezocine, midazolam, and IS. Parent ion (m/z) 201.01 246.19 325.64 293.20
Product ion (m/z) 94.90 147.00 290.75 237.08
Relative abundance
100 80 I 60 40 20 0 20 40
H3C N
94.90
H CH3 CH3 201.01
HN 67.77 95.51
201.72 60
80
100
120 140 m/z
160
180
200
100 80
II
60
97.10
246.19
20 100 120 140 160 180 200 220 240 260 280 m/z
1#74 RT: 0.22 AV: 1 NL: 3.76E7 T: + c ESI Full ms2 293.179 (100.000–300.000) (H3C)3C
Cl
F 249.10
40
325.64
20 0100 120 140 160 180 200 220 240 260 280 300 320 340 m/z (c)
Relative abundance
Relative abundance
290.75 N III
NH2
(b)
N
60
H3C
40
(a)
80
HO
147.00
0 80
220
1#52 RT: 0.25 AV: 1 NL: 9.06E6 T: + c ESI Full ms2 326.100 (100.000–350.000) N CH3
100
Collision energy (V) 17 18 25 13
1#106 RT: 0.29 AV: 1 NL: 7.39E6 T: + c ESI Full ms2 246.199 (100.000–300.000)
1#246 RT: 0.96 AV: 1 NL: 1.01E7 T: + c ESI Full ms2 201.142 (20.000–220.000)
Relative abundance
Analytes Dexmedetomidine Dezocine Midazolam IS
100 80 IS 60 40 20 0 100 120
N H
O 237.08
OH N H
O
293.20
202.24 140
160
180
200 220 m/z
240
260
280
300
(d)
Figure 1: Chemical structures and positive-ion electrospray mass spectra of dexmedetomidine (I), dezocine (II), midazolam (III), and IS.
2. Materials and Methods 2.1. Materials. Dexmedetomidine and midazolam were obtained from Sigma-Aldrich Chemical Company (St. Louis, MO, USA). Dezocine and carteolol (IS) were purchased from the National Institute for the Control of Pharmaceutical and Biological Products (Beijing, China). HPLC-grade methanol and acetonitrile were obtained from Tedia (Fairfield, OH, USA). HPLC-grade formic acid was purchased from Kermel Chemical Reagent Co., Ltd. (Tianjin, China). All other chemicals were of analytic grade or better. 2.2. Instruments and Analytical Conditions. A TSQ Quantum Ultra mass spectrometric detector with electrospray ionization (ESI) interface (Thermo Scientific, USA) was coupled with a Dionex Ultimate 3000 ultra-performance liquid chromatography system consisting of an LPG-3400SDN pump, a WPS-3000TSL autosampler, and a TCC-3000RS column compartment. The separation of analytes and IS was achieved
by using a Hypersil GOLD C18 column (50 mm × 2.1 mm, 3 µm; Thermo Scientific, USA) that was maintained at 25°C. The water (containing 0.1% formic acid and solvent A) and acetonitrile (solvent B) was used as mobile phase with gradient elution. The gradient was as follows: 0 min 5% B, 0.5 min 5% B, 2.0 min 80% B, 2.1 min 5% B, and 3.0 min 5% B, and then stopped. The flow rate was set at 0.4 mL/min. The select reaction monitoring (SRM) conditions (source parameters) were defined as follows: spray voltage 3.5 kV, vaporizer temperature 250°C, and capillary temperature 300°C. The optimized mass spectrometric parameters and mass spectra for all the analytes are shown in Table 1 and Figure 1, respectively. All the operations, acquiring and analysis of data, were controlled using Xcalibur software (Thermo Scientific, USA). 2.3. Preparation of Standard Solutions, Calibration Samples, and Quality Control Samples. Standard mixed stock solutions of dexmedetomidine, dezocine, and midazolam were prepared in DMSO at 1.0, 1.0, and 2.0 mg/mL, respectively, and then serially diluted with methanol to obtain the
Journal of Analytical Methods in Chemistry working solutions. The carteolol (IS) stock solution of 20 mg/mL was prepared in double-distilled water and further diluted with methanol to 1.0 µg/mL. All solutions were kept at 4°C before use. The diluted solutions were mixed with blank rat plasma (1 : 99) at final concentrations of 0.1, 0.5, 1.0, 10.0, 20.0, and 100 ng/mL for dexmedetomidine; 0.1, 0.5, 1.0, 10.0, 20.0, and 100 ng/mL for dezocine; and 0.2, 1.0, 2.0, 20.0, 40.0, and 200 ng/mL for midazolam. The quality control (QC) samples were prepared in blank rat plasma at four different concentration levels, lower limit of quantification (LLOQ, 0.1/0.1/0.2 ng/mL), low QC (0.2/0.2/0.4 ng/mL), medium QC (5.0/5.0/10.0 ng/mL), and high QC (80.0/80.0/160 ng/mL), for dexmedetomidine, dezocine, and midazolam, respectively. 2.4. Preparation of Plasma Samples. Frozen plasma samples were thawed at room temperature and vortexed for 1 min. 100 μL of rat plasma was mixed with 10 μL of IS solution (1.0 μg/mL) and 550 μL of ethyl acetate. Then, the extraction was carried out by vortex mixing for 3 min and centrifuging at 14,000 rpm for 10 min. The organic phases were transferred into clean polythene tubes and evaporated to dryness with a gentle nitrogen stream at 40°C. The residues were reconstituted in 100 μL of methanol followed by vortex mixing. After centrifuging at 14,000 rpm for 10 min at 4°C, 10 μL of the supernatant was injected onto the LC-MS/MS system for analysis. 2.5. Method Validation. A full method validation of the assay for the analyte determination in rat plasma was performed according to the China Food and Drug Administration guidelines for the preclinical pharmacokinetic study with respect to selectivity, linearity, precision, accuracy, recovery, matrix effect, stability, and dilution integrity [11]. 2.6. Application of the Method. Six male Sprague-Dawley rats weighing 180–220 g were supplied by the Shandong Laboratory Animal Center of Shandong Academy of Medical Sciences (certificate number SCXK (Shandong) 2014-0007). Rats were housed in environmentally controlled quarters (about 23°C–25°C) under a 12 h: 12 h light-dark cycle for at least 1 week before experiment. All rats were fasted but with freely available water for 12 h prior to pharmacokinetic study. The animal welfare and experimental procedures were approved by the Animal Ethics Committee at Institute of Materia Medica, Shandong Academy of Medical Sciences (Jinan, China). The established LC-MS/MS method was applied for the plasma concentration determination of dexmedetomidine (20 μg/kg), dezocine (80 μg/kg), and midazolam (400 μg/kg) after simultaneous intravenous administration through tail vein to healthy SD rats (n � 6). Blood samples were drawn into heparinized tubes before and at 2, 5, 15, 30, 45, 60, 120, 180, 240, 360, and 480 min after a single intravenous administration. The samples were immediately centrifuged at 3500 rpm for 10 min at 4°C. The plasma was separated and stored below −20°C until LC-MS/MS analysis [12, 13].
3
3. Results and Discussion 3.1. Optimization of LC-MS Conditions. After lots of preliminary experiments, a Hypersil GOLD C18 column (50 mm × 2.1 mm, 3 µm) was chosen to achieve satisfactory chromatographic results. The mobile phase consisted of water (containing 0.1% formic acid) and acetonitrile with gradient elution, which played a great role in achieving good peak symmetry with appropriate retention time and high MS sensitivity. In addition, owing to the complex nature of plasma, the pretreatment of plasma sample is a significant step to remove protein and potential interferences prior to LC-MS/MS analysis. The extraction conditions, including protein precipitation and liquid-liquid extraction, were investigated. Although the extraction procedure of protein precipitation required less time and could decrease the cost of the assay, the sensitivity and specificity could not meet the requirements of the research. For liquid-liquid extraction, the ratio of ethyl acetate to plasma volume was investigated. Finally, ethyl acetate at the ratio of 1 : 5.5 to plasma volume proved to be the best extraction method, as it yielded high recovery, negligible matrix effect for the analytes, and acceptable evaporation time. Additionally, 3 min was proved to be the most appropriate time for vortex mixing. As a result, the liquid-liquid extraction showed the advantages of specificity, sensitivity, stability, and accuracy. 3.2. Method Validation 3.2.1. Specificity and Selectivity. The retention time of dexmedetomidine, dezocine, midazolam, and carteolol (IS) were 2.14, 2.02, 2.30, and 1.86 min, respectively, and all samples were found to have no interferences from endogenous substances at the retention time of the analytes. The SRM chromatograms of the three analytes and IS are shown in Figure 2. 3.2.2. Linearity and LLOQs. To evaluate linearity, the calibration curves for each analyte were prepared and assayed from the ratio of the analyte peak area to the IS peak area (y) versus concentration (x). The LLOQ was determined as the lowest concentration with a signal-to-noise (S/N) ratio of 10, and the accuracy was between 80.00 and 120.00% by analyzing six replicates. The linear ranges, correlation coefficients, weight factors, regression equations, and LLOQs for all analytes are summarized in Table 2. 3.2.3. Precision and Accuracy. The QC samples at four concentration levels (lower limit of quantitation (LLOQ), low, medium, and high) were selected and analyzed to evaluate the intraday and interday precision and accuracy on three consecutive days (n � 6), which could cover the whole range of the calibration graph. For dexmedetomidine, dezocine, and midazolam, the intraday and interday accuracy was between 92.60 and 119.00%, and the intraday and interday RSD was