Multi-Agent Systems for Web-Based Map Information ... - CiteSeerX
Recommend Documents
Ljubljana, February 2005. Danny Weyns1, Michael Schumacher2, Alessandro Ricci3,. Mirko Viroli3, and Tom Holvoet1. 1 AgentWise, DistriNet, K.U.Leuven,.
AgentLink Technical Forum Group (TFG) on environments for multiagent systems ..... The plan of the TFG on environments is to continue the exploration of this.
We elaborate on environment engineering, and we illustrate how the environment ..... they are therefore an excellent candidate for supporting environment laws.
The above considerations result in the following list of serious drawbacks of ... organizational model, and includes mechanisms for role enactment and norm enforcement. ..... That is, the clauses in an interaction contract specify actual instantia-.
types of computational agents. We also describe two approaches that address complementary aspects of MAS construction. These approaches may be ...
Department of Electrical and Computer Engineering. Wright-Patterson Air ... detail to adequately support complex system development [5]. In our research, we ...
sign' definition of the second workshop on normative multiagent systems in 2007 we derive the .... The typical example of the former is that you can enter a train without a ticket, but you may be .... he cannot fix if given a free hand to design the
yDep. de Teor a de la Señal, Comunicaciones e Ing. Telem atica, E.T.S.I. Telecomunicaci on ... The process of KBS development consists of lling a number of model templates. ...... Newsletter of BCS SGES Methodologies Interest Group, 1.
Email: [email protected]. Abstract: This paper** ...... The other robot B-BOMBER from h5 can move only straight ahead, one square at a time, e.g., ...
information sharing, coordination and planning. Frans C.A. .... erative multi-robot systems in which all robots share a common goal. .... IOS Press, March 2004.
Information-rich environments are the open environments that characterize ...... Charles J. Petrie, Jr. Agent-based engineering, the web, and intelligence. IEEE.
readability, a free, easy-to-use online com- puter program was employed (http://www. online-utility.org): the URL of each website was copied and pasted into this ...
AIl rights reserved 0738-4602-1998/ $2.00SUMMER 1998. 79. Appears in: AI
magazine Volume 19, No.2 Intelligent Agents Summer 1998. Multiagent. Systems
.
most of them are focused on the conception that crea- tivity deals with ...... Genome. http://www.ncbi.nlm.nih.gov/genome/guide/huma n, last access March 2002.
called COMAS which uses Prodigy/Agents as individual agents. GOAL INTERACTION COORDINATION. In a multiagent system, the environment is never static.
(named agent-monitors) and host monitors (named host-monitors). An agent- monitor is associated to each domain agent and a host-monitor is associated to.
Different agents plan for different .... to know of the state change has to either plan to achieve ... behaves as an independent agent performing a plan server.
refueling station. The scrub removal portion of the task is analogous to Graze, while refueling is similar to ...... manned Aerial Vehicle Team 35]. It is intended.
In related work, they show how to use these formal repre- sentations to define criteria for coalition formation [2], or measures for multiagent systems inspired by ...
Sep 7, 2008 - the intersection and the traffic signal controller can be regarded as an autonomous agent. However, the âagentificationâ of a transportation ...
and customers or vendors can be either individuals or software agents. We also show ...... from a multi-agent electronic marketplace experiment. In MAAMAW'97.
Squirrels live in these locations in small groups. When they have acorns, they go ... It dies to avoid living forever when there are no more resources available but ...
A Foundation for the Organisation of Multiagent Systems. Klaus Fischer, Michael Schillo and Jörg Siekmann. DFKI GmbH,. Stuhlsatzenhausweg 3,. Dâ66123 ...
Commitments in multiagent systems. 2. Some history, some confusions,. 3 some
controversies, some prospects. 4. Munindar P. Singh. 5. Abstract The notion of ...
Multi-Agent Systems for Web-Based Map Information ... - CiteSeerX
browser providing an easy use Web user interface for online map information retrieval. ... the internet, and a web page appears on his browser. There are a lot .... Parser. Ontology. Repository. Ontology. Object. SVG. Creator. Spatial Data. Java.
Multi-Agent Systems for Web-Based Map Information Retrieval1
Maozhen Li, Sheng Zhou and Christopher B. Jones Deptartment of Computer Science Cardiff University, Cardiff CF24 3XF, United Kingdom {maozhen, s.zhou, c.b.jones}@cs.cf.ac.uk
Abstract. Many types of information are geographically referenced and interactive maps provide a natural user interface to such data. However, map presentation in geographical information systems (GIS) and on the internet is closely related to traditional cartography and provides a very limited interactive experience. We present the MAPBOT, a web-based map information retrieval system to search geographical information using software agent techniques. Each kind of map feature such as a building or a road is treated as an agent called a Maplet. Each Maplet has a user interface level to assist the user to find information of interest and a graphic display level that controls the presence and the appearance of the feature on the map. Semantic relationships of Maplets are defined in an Ontology Repository (OR) and used to control their retrieval. To allow system developers to manipulate the OR, an Ontology Editor is implemented with a graphical user interface. Visualisation on the client is based on Scalable Vector Graphics (SVG). The paper describes the current state of development of the prototype and presents, and evaluates experimentally, an agent-oriented graphical conflict resolution procedure, which demonstrates the potential for conflict resolution via low level agent communication, as opposed to global control.
1. Introduction Maps are being used increasingly in local, networked and mobile information systems for communicating geographically referenced information. This has become possible because of the now relatively widespread availability of digital map data and developments in geographical information system (GIS) technology. The applications are wide ranging including local government planning, environmental monitoring, market analysis, navigation and public access to information. Interaction with a digital map is typically based on a cycle of elicitation of user input via menu and dialog boxes, selection of map areas or features, and return of 1This
research has been funded by UK EPSRC grant GR/N23172
information, which may in turn induce modification to the map content. The maps themselves are often close replicas of traditional paper map cartography. The approach is to be found in many commercial GIS and is now being reflected in mapping applications on the internet. Developments in human computer interaction with regard to information retrieval and data visualization raise the question of whether the conventional approach can be improved. Certainly there is a motivation to investigate new approaches, since the current map interface, particularly on the Internet, often suffers from poor legibility of symbols and text, unnecessary user actions and inadequate adaptation to user interests. Recent years have seen a marked interest in agent-oriented technology [1,2] spanning applications as diverse as information retrieval, user interface design, network management and complex system simulations [3,4]. An agent is a computational entity which acts on behalf of other entities in an autonomous fashion, performs its actions with some level of pro-activity and/or reactiveness, and exhibits some level of the key attributes of learning, cooperation and mobility [5]. The next generation of GIS may be expected to provide user interfaces with intelligent agents to assist users to search, query and operate the system [6]. The use of agents to represent map features is a characteristic of the project AGENT [7]. That project addressed the problem of map generalisation using software agents but was not directly concerned with information retrieval or interactivity issues. Here we present the MAPBOT, a multi-agent system for active maps which makes use of agent technology both for web-based map information retrieval and map generalisation. MAPBOT provides a user interface agent to assist users in effectively and efficiently searching map related information. Finding the right piece of information at the right time can be quite a complicated task. Conventional information retrieval techniques can help us find relevant information, but interacting with these systems is often an awkward experience, especially for novices. User interface agents are adopted for finding contextually useful information appropriate to interactive tasks for users. A user interface agent (UIA) is in charge of interacting with the user and of making the other agents transparent to him. The UIA is able to understand the user’s requests and translate them for the other agents. It is also in charge of coordinating the work of the other agents [8, 9]. The interface agent performs a number of tasks that are crucial for the correct operation of an intelligent semantic matching system: • assisting a user in performing requests and compiling his profile; • deducing a user’s information needs by both communicating with them and observing their "behaviours"; • translating the requests of a user and selecting the agent(s) able to solve their problem(s); • presenting and storing the retrieved data. A great deal of work has been carried out into the use of interface agents in recent years [10, 11, 12, 13, 14]. A number of prototype information retrieval systems have been developed that incorporate intelligent interface agents. Some notable examples are Ontoseek [15], InfoSleuth [16], RETSINA [17] and WebMate [18]. Many of the systems are based on ontology technology [19, 14, 15], they all rely on centralized ontology databases that are stored in relational database systems. The emergence of XML, OML and RDF allows the ontology metadata to be embedded in
the encoded web document, facilitating semantic matching by retrieval agents. Although the encoding agents may still refer to centralized ontology databases during the encoding process, the databases can now also be encoded in XML because of its openness. Like many systems, the UIA in MAPBOT makes use of ontology to validate user inputs and captures user interactive intentions, but the ontology in MAPBOT is organized in XML like OSCA [20]. In addition, the UIA works in a Web browser providing an easy use Web user interface for online map information retrieval. A key concept of MAPBOT is an active map, characterised by the following features: • Responds helpfully to direct manipulation of the displayed map symbols. • Exhibits intelligence with regard to knowledge of concepts and context of individual map features and classes of feature. • Guides the user to relevant related information within the map space and within the information space. • Modifies its map symbols, icons and text dynamically to assist in focusing on particular types of information and particular geographical locations. In MAPBOT, the active map will be associated with different agents: representing geographical phenomena, capable of communicating with the map user, visualized by symbolic or iconic representations that adapt to the scale and purpose of the map, and knowledgeable of their ontology, their spatial context and the application specific procedures that might be applied to them. In the remainder of this paper we sketch out in Section 2 a scenario of the type of user interface facilities that we are aiming to achieve in the longer term. Section 3 describes the software architecture of the system, with reference the agent properties, functionalities and interactions of the Maplets that represent individual map features. This is followed in Section 4 by a summary of the current implementation which uses a Java servlet for web communications, the SVG standard for visualisation and a simple ontology in combination with a GUI-based ontology editor, to encode the user concepts associated with Maplets. Section 5 describes the results of some experiments which demonstrate the potential of using multi-agent techniques for resolving graphical conflicts in the map display. Here we focus on the specific case of simple polygonal objects and compare results with previous work on the same sub-problem. The approach is novel in the context of conflict resolution in being based essentially on message passing between neighbouring map features. Its effectiveness is demonstrated in comparison with two "global" iterative improvement techniques. The paper concludes in section 6 with a summary of results and a discussion of future work.
2. Scenario of Map-Based Information Retrieval 1.
Suppose a user wants to travel to Cardiff. He downloads the MAPBOT from the internet, and a web page appears on his browser. There are a lot of iconic metaphors on the map with each one representing one category such as a bus station, a pub or a museum.
2.
He types in Cardiff in the Search box, then a map covering the vicinity of Cardiff appears in the map window. 3. He moves the map in different directions to find something interesting. 4. He points to Transportation from the Common Category menu, then all information related to Transportation such as Railway Station, Bus Station and Cardiff Airport appears on the map. Other unrelated information like Rivers will disappear from the map, unless it is part of the transport infrastructure, or essential base map information. If he moves to a Bus Station and clicks the right button of his mouse on it, then an information menu will appear to ask him to select information of interest. Options might be Timetable; How to get to the station; History of the station. Then the system will lead the user to the related web page. 5. He types in a search sentence like " Tell me where is the nearest art museum to my current position?". After confirming the location, the system will pop up a window showing how the user could get to the museum and how far it is. The interface will understand some words like where, when, what, how far, nearest etc. 6. He moves his mouse cursor in the map window. The interface will display a message bar to show more detailed information about a map feature which is symbolized. For example, if he puts his mouse cursor onto a pub symbol, then a message bar will appear to show that this is a pub and where it is located. If he wants more information, he can click the right button of his mouse and then an information menu will appear to ask him to select more information. 7. When he moves his mouse cursor around the map, the map features that have a photo associated with them will flash continually. The user can point to one flashing object and click on it. Then a picture associated with the object will be displayed. When the user points to the picture and moves his mouse, the picture will move around and show itself from different angles to provide a Virtual Tour. 8. He types in "Interesting Places" in the Search box, then the map will display a range of types of places like a museum, a castle, a sports stadium and so on. Clicking on one of these results in the map displaying more of a similar type. 9. He can change his search by selecting on option from Common Category menu or typing in another search topic in the Search box. 10. The user interface agent builds up a profile of the user based on his interactive actions and, in the current and subsequent sessions, helps him to search for the information he needs, by anticipating his interests.
3. Software Architecture the MAPBOT
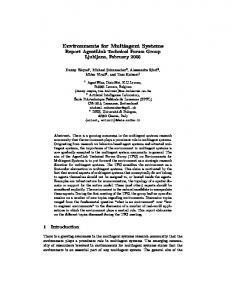
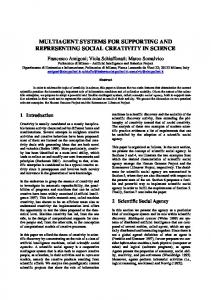
3.1 Agent attributes According to Maes [22], an agent is a system that tries to fulfil a set of goals in a complex, dynamic environment. It can sense the environment through its sensors and act upon it using its actuators. The agent paradigm has been the subject of Artificial Intelligence (AI) research for some time, but it is only now that it is beginning to spread into information technology and commercial markets. There are two main functions of agents in the MAPBOT. One is to provide an intelligent user interface for retrieving map related information, the other is to resolve graphic conflicts through the communication between map feature agents. Desirable attributes of agents used in MAPBOT are given below. • Autonomous: Exercises control over its own actions. • Reactive: Responds in a timely fashion to changes in the environment. • Proactive: Acts based on goals, purposes. • Interactive: Communicates with other agents, perhaps including people. • Deductive: Deduces the user’s interactive intention from their actions. 3.2 Agent types There are many agents in MAPBOT. Based on their functionalities, the agents can be classified into User Interface Agent (UIA), Server Agent Broker (SAB) and Maplets. Each kind of map feature such as buildings and roads can be a Maplet. Figure 1 shows the software architecture of the MAPBOT. And we now explain the individual components. User Interface Agent (UIA) receives inputs from a user and assists the user to search, query and manipulate the map in an efficient and user-friendly way. The UIA tries to understand the subject and geographical context of interest to the user and sends a message to the server to ask for more information or modify the map to change the content and level of detail. The UIA should keep a concise profile for each user to record their search interests. Server Agent Broker (SAB) receives requests from the UIA. It broadcasts a user’s requests to Maplets. Based on the Ontology Repository (OR), the SAB can ask certain kinds of Maplet to display themselves or to provide more information to the user. Each kind of map feature is an agent represented by a Maplet. Each Maplet has its own control flow and can respond to change in its environment. Each Maplet has sensors to perceive its environment and actuators or effectors to act on it. The environment can be the system initialisation, SAB communication or other Maplet communication. Based on its reasoning rules, the effector can be "Display itself", "Disappear", "MoreAboutMe" or "MoveLocation". Figure 2 shows the control flow in a Maplet.
Server Maplet
Server User Interface Agent
Internet
Spatial Data
Maplet
Maplet
Client
Maplet
Agent Broker
Ontology Repository Ontology Editor
Fig. 1. Software architecture of MAPBOT Perceives
Maplet Environment
Sensors
System Initialization
Reasoning
SAB Communication
Effectors
Maplet Communication
Display Move
Acts
Fig. 2. The control flow in a Maplet
Disappear MoreAboutMe
3.3 Agent interactions In the following, we demonstrate a scenario of interaction among the MAPBOT agents in the context of a simple query execution. During the system start-up, the SAB initializes itself and commences listening for queries from the UIA and for advertisement information from Maplets. Each Maplet registers itself with the SAB and retrieves related data from the Spatial Database. When registering with the SAB, each Maplet needs to tell the SAB the ontology concept to which it belongs. A user starts interactions with the MAPBOT by means of a Web Browser, currently through Microsoft Internet Explorer. The user poses a query by means of pointing to a map feature of interest, typing the query in a search field, or selecting a query category from a category list presented in the applet. Then the UIA submits the query along with the profile to the SAB to retrieve information. When the user moves the mouse on a map feature on the map, the map feature is highlighted. On receiving a request, the SAB searches the Ontology Repository (OR) to find matches with the query term, parses the profile to check if the query is valid and informs the UIA of the result. If the query is not valid, the UIA will display a dialogue to tell the user the query is not valid and ask them to perform another query. Otherwise the UIA will listen for further responses from the SAB to receive updated map data. The SAB retrieves the ontology information based on a valid query and broadcasts a request with the relevant ontology objects (concept terms) to all the Maplets registered with it. After receiving the request from the SAB, each Maplet needs to decide to display itself or not. The ontology will assist in these decisions as it can be used to calculate a semantic distance between the query terms and the class of the Maplet. These distances will be used to rank the relevance of particular classes of information. The SAB receives data from the Maplets that will be displaying (on the basis of exceeding a relevance threshold) and sends a formatted data stream to the UIA to update the map.
4 Implementation of the Prototype
4.1 The user interface A MAPBOT prototype has been implemented in Java. The UIA is implemented as a Java Applet and runs on the client side to interact with a Web user. The SAB is implemented as a Java servlet using Tomcat 3.2.4 as the servlet engine. Each Maplet is implemented as a Java object. The visualisation on the client side is based on Scalable Vector Graphics (SVG) developed by World Wide Web Consortium (W3C) [21]. SVG has the following advantages: • Plain text format - SVG files can be read and modified by a range of tools, and are usually smaller and more compressible than comparable JPEG or GIF images.
• • •
• •
Scalable - unlike bitmapped GIF and JPEG formats, SVG is a vector format, which means SVG images can be printed with high quality at any resolution. Zoomable - any portion of an SVG image can be zoomed in without any degradation. Interactive - SVG images can be made interactive through the assignment of event handlers, such as "onclick" and "onmouseover", to image elements. These can be used to highlight a selected map feature, show attribute information or display a map tip. Open Standard - SVG is an open recommendation developed by a crossindustry consortium. Unlike some other graphics formats, SVG is not proprietary. True XML - as an XML grammar, SVG offers all the benefits of XML.
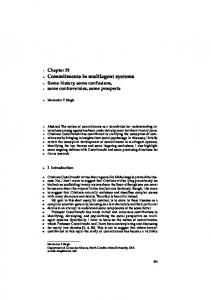
To view the MAPBOT prototype, web users need to download a SVG Viewer plugin from Adobe [23] and use Internet Explorer. Figure 3 shows a snapshot of the prototype. There are several components in the prototype, a web page, an invisible applet, a servlet and an ontology parser. The data workflow is given in Figure 4.
Ontology Repository
Ontology Object Client SVG & JavaScript
HttpServlet Request
Java Applet
Java Servlet HttpServlet Response
Ontology Parser
SVG Data
SVG Creator
Spatial Data
Fig. 4. The data flow in the prototype
When a user accesses the web page, the JavaScript embedded in the web page will call a "faceless" Java applet to send an http request to the Java Servlet which will invoke the Ontology Parser to create an Ontology Object from the Ontology Repository and then send the object as a serialized Java object to the applet. At present the Ontology Object contains the entire ontology. The applet uses the Ontology Object to check if the user has made a valid search. If valid, the Applet will submit the search to the Servlet which in turn invokes the SVG Creator to create a SVG file for the client to refresh the web page. A fragment of an SVG file created in this way is illustrated in Figure 5. 4.2 Ontology Repository An ontology for a body of knowledge, concerning a particular task or domain, describes a taxonomy of concepts for that task or domain that define the semantic interpretation of the knowledge [24]. Ontology in the MAPBOT defines the semantic relationships of Maplets. The Ontology Repository (OR) is organised in a tree structure and described in XML. The DTD definition is shown below. The OR has one or more nodes in it. Each node has a name, a parent node, one or more synonyms and related keywords.
]> //specify how to display Railway Station, Road Node, Lake, Woodlandboundary and Dluaboundary.