2009 Ninth IEEE International Conference on Bioinformatics and Bioengineering
Multi-Agents System to model cell signalling by using Fuzzy Cognitive Maps. Application to computer simulation of Multiple Myeloma. Vincent Rodin1∗ , Gabriel Querrec2 , Pascal Ballet1 , Franc¸ois–R´egis Bataille3 , Gireg Desmeulles2 , Jean–Franc¸ois Abgrall4 , Jacques Tisseau2 1 European University of Brittany, UBO, EA 3883 LISyC, IFR 148 ScInBioS, CS 93837, 29238 Brest Cedex 3, France. 2 European University of Brittany, ENIB, EA 3883 LISyC, IFR 148 ScInBioS, CERV F-29280 Plouzan´e, France. 3 INSERM, Institut National de la Sant´e et de la Recherche M´edicale, CHU Nantes, UMR 601, Nantes, France. 4 CHU Brest, EA 3883 LISyC, IFR 148 ScInBioS, 29609 Brest cedex, France. ∗ Corresponding author, email:
[email protected]
multi-agents model [6]. Most of these methods can not easily simulate complex networks using the features described previously. In this study, we use a Fuzzy Cognitive Map to simulate two models of a biochemical pathway: the “Mitogen Activating Protein Kinase” Pathway (MAPK). Results are then compared to those obtained by differential equation. We also use Fuzzy Cognitive Maps in order to modelize and simulate multiple myeloma cells. Before explaining our applications, let us defined more precisely Multi-Agents System (MAS) and Fuzzy Cognitive Map (FCM).
Abstract—In order to simulate biological processes, we use multi-agents system. However, modelling cell behavior in systems biology is complex and may be based on intracellular biochemical pathway. So, we have developed in this study a Fuzzy Influence Graph to model MAPK pathway. A Fuzzy Influence Graph is also called Fuzzy Cognitive Map. This model can be integrated in agents representing cells. Results indicate that despite individual variations, the average behavior of MAPK pathway in a cells group is close to results obtained by ordinary differential equations. So, we have also modelled multiple myeloma cells signalling by using this approach.
I. I NTRODUCTION
II. M ULTI - AGENTS S YSTEMS
Modelling systems biology is a new challenge for computer scientists. Multi-agents system may be a good candidate for modelling and simulation of biological systems. Moreover, the hard core of the multi-agents modelling of biological processes results in giving to agent-cells a complex coherent behaviors. Cell behavior complexity [1] arise from the intracellular networks that control cells’ processes. So, one of the solution is to model the intracellular biological networks controlling cells. The used methodology should firstly allow semantic to permit discussions with the experts of the domain. Secondly, it may have to allow retroaction which is one of the biological networks’ features. Thirdly, we usually dispose only partial data ; this makes it difficult to perform quantitative simulations and the modelling of the complete map of the biological networks. Many attempts have been done to model intracellular biological network with many different methods, either in a single cell (for example using Artificial Neural Networks [2] and Bayesian Networks [3]) or in a multi-agents model by using a simple algorithm [4], BDI (Beliefs, Desires and Intentions) architecture [5], or an intracellular network 978-0-7695-3656-9/09 $25.00 © 2009 IEEE DOI 10.1109/BIBE.2009.23
The first studies on the MAS date back to the eighties. They are justified by the following observation: “there are systems in nature,.. ,that are capable of accomplishing complex, collective tasks in a dynamic environment without external controls or central coordination” [7]. We will start this section by defining the concept of agent and MAS before presenting the “in virtuo” methodology developed in our laboratory and then we will compare MAS and biological systems. A. Agent, MAS and “in virtuo” experimentation An agent is an autonomous entity, i.e. there is no global control of the system but the control is distributed between all the agents. Each agent, thus, has its own behavior, which is no more than the way in which it manages its autonomy. Agent can be classed in two categories depending on their ability for complex behavior such as “cognitive agents” as opposed to “reactive agents” [8]. Agents always evolve according to a three-stroke cycle: perception (of their environment), decision (according to the external signals and also on their internal states) and action (on their environment). 236
Authorized licensed use limited to: Universite de Bretagne Occidentale. Downloaded on October 21, 2009 at 02:20 from IEEE Xplore. Restrictions apply.
The MAS come from Artificial Intelligence. They are based on the concept of “intelligence distribution”. Ferber [9] described the MAS as sets of agents and their interactions. The use of MAS allows us to interact with the model during the simulation. This opens the way to the “in virtuo” experimentation [7]. This approach supplements the traditional approaches: in vivo, in vitro and in silico. Exceeding the simple observation of the activity of the digital model, the user can test the reactivity and the adaptability of the model during execution. This makes possible the simulation of the addition of new drug at a given moment of simulation ; that also helps to understand a phenomenon by easily modifying it without starting again simulation. This approach is closer to those carried out during the experiments in vivo and in vitro.
The interested reader can find an overall of this tool in the J. Aguilar paper [17]. A Fuzzy Cognitive Map is first of all a simple influence graph. Nodes are named by concepts forming the set of concepts C = {C1 , · · · , Cn }. Arcs (Ci , Cj ) are oriented and represent causal links between concepts; id est how concept Ci causes concept Cj . Arcs are elements of the set A = {(Ci , Cj )ij )} ⊂ C × C. Weights of arcs are associated with a link value matrix Lij ∈ Mn (K) where K is ZZ or IR: if (Ci , Cj ) 6∈ A then Lij = 0 else excitation (resp. inhibition) link from concept Ci to concept Cj gives Lij > 0 (resp. Lij < 0). FCM concepts’ activations take their value in an activation degree set V = {0, 1} or {−1, 0, 1} if crisp mode or [−δ, 1]; with δ = 0 or 1 if fuzzy mode. At moment t ∈ IN, each concept Ci is associated with two types of activations: inner activation degree ai (t) ∈ V and extern forced activation value fai (t) ∈ IR. This defines inner activation a ∈ (V n )IN and extern forced activation fa ∈ (IRn )IN vector sequences. A FCM is a dynamical system. Initialization is a(0) = 0. The dynamic obeys a recurrent relation: ∀t ≥ 0, a(t + 1) = G (fa (t), LT · a(t)), involving link matrix product with inner activation vector, fuzzy logical operators between this result, extern forced activation vector and normalization: ∀i ∈ [1, n], ai (0) = 0 , ! X ∀t ≥ 0, ai (t + 1) = σ(gi fai (t), Lji aj (t) )
B. MAS and Systems Biology Systems biology proposes to study biology as a system [10]. Unlike traditional biology that has examined single genes or proteins in isolation (“reductionism paradigm”), systems biology simultaneously studies the complex interaction of many levels of biological information - genomic DNA, mRNA, proteins, functional proteins, informational pathways and informational networks - to understand how they work together. Von Bertanffy in 1973, was the first to introduce systemic in biology. Moreover, the little availability of molecular biology knowledge lets “systems biology” in aimless. But, now that biological knowledge has been improved, systems biology is back on the rise. We believe that it is easier to model such biological system by another system, the MAS. Many key features (robustness, emergence, self-organization, ...) are shared by MAS and biological system this could explain why MAS may be a good tool to simulate this process. Next, let us define the notion of Fuzzy Cognitive Map used in our simulations to model MAPK pathway and complex cancer cells.
j∈[1,n]
2
where gi : IR → IR are fuzzy operators between influence graph inner activations and extern forced activations, and σ : IR → V standardizes activations via sigmoidal function. If fuzzy mode, V = [−δ, 1], σ is the sigmoidal function 1+δ −δ σ(δ,a0 ,k) : a 7→ 1 + e−k(a−a0 ) 1+δ centered in (a0 , 1−δ 2 ), of slope k · 2 in a0 and of limits in ±∞ respectively 1 and −δ. If bimodal,
III. F UZZY C OGNITIVE M AP
σ : a 7→ If trimodal, −1 σ : a 7→ 0 1
A Fuzzy Cognitive Map (FCM) is a Fuzzy Influence Graph which result from works of some psychologists. “Cognitive Maps” has been first introduced to describe complex topological memorizing behaviors in the rats [11]. In the Seventies, Axelrod describes the “cognitive maps” as directed, interconnected, bilevel-valued graphs, and uses them in decision theory applied to the politico-economic field [12]. In 1986, Kosko extends the graphs of Axelrod to the fuzzy mode which become thus FCMs [13]. It includes many advantageous modelling features which are flexibility concerning system design and control, the comprehensible (white-box) structure and operation, the adaptability to problem-specific prerequisites and the capability for abstractive representation and fuzzy reasoning. FCM has previously been used in various fields. Let us cite for exemple the use of FCM to describe and model complex dynamic system [14], for decision analysis and operation research [15], and to model effect–based operation [16].
0 si σ(0,0.5,k) (a) ≤ 0.5 1 si σ(0,0.5,k) (a) > 0.5 si si si
σ(1,0,k) (a) ≤ −0.5 −0.5 < σ(1,0,k) (a) ≤ 0.5 σ(1,0,k) (a) > 0.5
Asymptotic behavior (t → +∞) of a FCM with constant extern forced activation vector sequence could be a fixed point, a limit cycle or even a strange attractor if complex enough. A FCM has the forward chaining ability only: it can answer to “What’s happen if...?”, it can not answer to the question “Why...?” because of non-linearity. FCM helps to predict the evolution of the system (simulation of behavior). The fundamental difference between a FCM and a Neural Network is that all the nodes of the FCM graph have a strong semantic defined by the modelling of the concept whereas the nor input and nor output nodes of the graph of the Neural Network have a weak semantic, only defined by mathematical relations.
237
Authorized licensed use limited to: Universite de Bretagne Occidentale. Downloaded on October 21, 2009 at 02:20 from IEEE Xplore. Restrictions apply.
(a)
(b)
E1
E1 MAPKKK
E’1 MAPKKK-P
MAPKKK
E2 MAPKK
MAPKKK-P
E2 MAPKK-P
MAPKK-PP
MAPKK P”ase MAPK
MAPKK
MAPK-P
MAPKK-P
MAPKK-PP
MAPKK P”ase MAPK
MAPK-PP
MAPK P’ase
Fig. 1.
MAPK-P
MAPK-PP
MAPK P’ase
a: Huang and Ferrel’s model, b: Kholodenko’s model
Fuzzyfication Sensors
Perceptions
FCM D
on
isi
Defuzzyfication
Fig. 2. (a)
Association of agents with FCM
+1 INPUT
E1
am
Actions
yn
ec
D
Effectors
ic
Agent
+1 MAPKKK
+1 MAPKK
MAPK
OUTPUT OUTPUT
-1
(b) +1 INPUT
E1
+1 E’1
+1 MAPKKK
+1 MAPKK
MAPK
OUTPUT OUTPUT
Fig. 3.
FCM’s of the MAPK’s model
(a)
Fig. 4.
(b)
a: Huang and Ferrel’s model, b: Kholodenko’s model (from Bl¨uthgen [18])
IV. A PPLICATIONS Initially, thanks to FCM, we have developed two models of MAPK pathway that we have integrated in an agent-cell.
We have also modelled multiple myeloma cells signalling by using this approach. But, first of all, let us detail oRis our multi-agents platform supporting the implementation of these 238
Authorized licensed use limited to: Universite de Bretagne Occidentale. Downloaded on October 21, 2009 at 02:20 from IEEE Xplore. Restrictions apply.
models.
are close in amplitude to those obtained thanks to differential equations (figure 4). Nevertheless, we don’t use any kinetic data, so time duration and kinetics are not biologically significant in any of those simulations. We will discuss about this in the section dedicated to the conclusion and discussion. First simulation of Kholodenko’s model with only one cell shows a periodic signal with an average period of 7.6 oRis time unity (OTU) and a standard deviation of 0.55 OTU. Interestingly, more cells are presents in the simulation less the standard deviation is (n=100, average period = 8.0 OTU +− 0.47 and n=1000 average period = 7.9 OTU +− 0.45).
A. oRis platform oRis [19] is an environment for interactive simulation: it is a programming language founded upon active objects and an execution environment. Those characteristics make oRis a generic platform for multi-agents systems implementation, more particularly dedicated to simulation. It is a dynamically interpreted language, with instance granularity which makes it possible to intervene in the course of simulation to observe the multi-agents system, to interact with agents or on the environment and to modify them on line. In oRis, a multiagents system is composed of agents (active objects) whose environment consists in objects, possibly located in space (2D or 3D) and time.
D. Multiple Myeloma FCM model implementation Thanks to our FCM approach for the pathways modelling of complex cells, we propose to implement a computer simulation supporting the maturation model of myeloma cells based on the CD45 expression. The CD45 is an important tyrosine phosphatase which intervenes in the activation and the development of plasmocytes. It was highlighted that, during normal plasmatic differentiation, the proliferation is associated with a high expression of CD45 on the surface of the cell. The differentiation is, as for it, correlated with the decrease of CD45. Sometimes, but rarely, this decrease can even bring about a complete loss of CD45. Thanks to in vivo experiments, the expression of CD45 on the surface of plasmocytes can be evaluated. So, it is possible to determine that the immature plasmocytes which are in the tonsils and the blood express strongly CD45. But, in the other hand, the phenotypic study of the CD45 on plasma cell shows a heterogeneity in the bone marrow. Indeed, in the bone marrow, plasmocytes can lose the expression of CD45. All these data seems to indicate a correlation between the expression of CD45 and the cellular proliferation. Bataille distinguishes several types of plasma cells expressing the CD45 which, as the cases may be, influence the prognonis of the disease (figure 6-a). The cells with a high expression of CD45 (CD45 Bright), the cells with a low expression CD45 (CD45 Low) and the cells with no expression of CD45 (CD45 Neg) [22]. It has been shown that CD45 expression decreases with the maturation of the cells and CD45 annihilation is a critical prognonis for patient survival. CD45 expression is also necessary for IL6 proliferation signals but inhibits IGF-1 proliferation signals. Moreover, CD45 expression is stimulated by IL6 and its activity is inhibited by dimerization. The kinetic of CD45 dimerization depends of the molecule isoform. So, we have developed a computer simulation based on a multiagent system and FCM which integrates the model of myeloma cell previously described in their microenvironnement (figure 6-b). The figure 7-a shows the evolution of the virtual myeloma tumor. All the virtual cells are controlled by the FCM shown figure 6-b. This model involves two different growth factors, IL6 and IGF-1. The first one acts, mainly, thanks to the MAPK and JAK-STAT pathway and stimulates the expression of CD45 phenotype. The CD45 thus behaves as a “switch” which allows the cell to choose its growth factor. So, when a cell
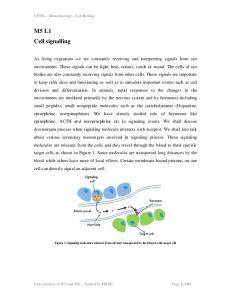
B. Agent/FCM connection We have developed simple MAS models using a FCM because FCMs can specify and control behavior of agents. An agent has sensors, effectors and decides on its behavior. FCM in relation with this agent has perceptive and motor concepts. Decision of the agent associated with the FCM is controlled by extern activations and FCMs dynamic. Perceptive concepts are activated by fuzzyfication of sensors, while motor concepts activate effectors by defuzzyfication (figure 2). C. MAPK models implementation The MAP Kinase are a group of protein kinase that have been established to have an important function in signal transduction pathway that mediates the nuclear response of cells. These enzymes are activated by pathways that have been conserved during evolution in many organisms. The MAPK pathway is composed of three kinases: Raf (MAPKKK), MEK (MAPKK) and ERK (MAPK). Many models have been developed in literature. Currently, the reference model is the one which has been proposed by Huang and Ferrell [20] who have described the activation of MAPK pathway in xenopus oocyte (figure 1-a). The model input is a hypothetical enzyme called E1 which is the negative feedback’s target of Kholodenko’s model [21] (figure 1-b). This can induce oscillation in MAPK concentration. Figure 3 shows the FCMs we have used in order to model MAPK pathway. One can observed on this figure that arcs weight equals to +1 for activation arcs and -1 for inhibition arcs. Each concept represents the activated form of the molecule (MAPK node represents the activated form of MAPK: MAPK-PP). Input data is the E1 concentration given by the agent-cell. E1 concentration is first fuzzified and then can be used by the influence graph. The output data MAPKK and MAPK, respectively MAPKK-PP concentration and MAKP-PP concentration, are defuzzified before that agent-cell is able to use them. For both models we have compute two simulations, the first one with n=1 cell and the other with n=1000 cells on which we have calculated the average MAPKK-PP and MAPK-PP concentrations. Both simulations of Huang and Ferrel’s model (figure 5a and figure 5-c) shows that MAPK-PP concentration results
239
Authorized licensed use limited to: Universite de Bretagne Occidentale. Downloaded on October 21, 2009 at 02:20 from IEEE Xplore. Restrictions apply.
1200 (a) N=1 900
(b) N=1
600 300 MAPKKK* 0 7.50 MAPKK** MAPK** 1200 (c) N=1000 900
15.00
22.50
0
9.25
18.50
27.75
37.00
(d) N=1000
600 300 0
8.00
16.00
9.25
24.00 0
18.50
27.75
37.00
Fig. 5. a: Huang and Ferrel’s model with N=1 cell, b: Kholodenko’s model with N=1 cell, c: Huang and Ferrel’s model with N=1000 cells, d: Kholodenko’s model with N=1000 cells (b)
(a)
CD45
IGF1
IL6
CD45 Low CD45 Bright CD45 Neg
Less aggressive disease More aggressive disease
+ MAPKKK
PI3K
MAPKK
+
+
+
MAPK
+
Proliferation Fig. 6.
JAK
+
LYN
AKT
Terminal stage of disease
+
+
+
+ STAT
+
CD45 synthesis
a: Evolution of the disease according to the expression of CD45 ; b: FCM model of myeloma cells
V. C ONCLUSION AND DISCUSSION
goes away from IL6 sources (osteoclast), fewer IL6 is then available. Therefore, the cell will use IGF-1 to stimulate its growth.
In this study, we have developed a FCM model of MAPK pathway for multi-agents simulation. We have compared our results to those obtained by Bl¨uthgen [18] thanks to Ordinary Differential Equation (figure 4) because this is the reference method in the field. Let us note that in our simulations, contrary to Bl¨uthgen, we voluntarily do not use the kinetic data of biochemical reactions which intervene in the model of MAPK pathway. We adopted this approach because all intracellular activation pathways are not as well known as those of the MAPK, and thus the kinetic data are not always available. One can observe on figure 5 that thanks to the defuzzification process amplitude of our curves are close to those obtained by differential equations. Nevertheless, we do not use kinetics parameters so no exact quantitative simulation like differential equation can be done. However, FCM allows a greater predictive value than boolean network. Indeed, exceeding the simple 0 or 1 state of the boolean networks, this methodology consider continuous activation level of the molecule. This permits FCM to be associate to an other quantitative method. This association could allow the simulation of a drug effect
The figure 7-b presents the evolution of the various populations of CD45: Bright which proliferate slightly, Low which proliferate more and Neg which proliferate much more and in a exponential way. At the beginning, only the cells expressing CD45 Bright proliferate: it is the initial stage of the disease. Then, when the disease becomes more serious, the cells expressing CD45 Low begin to proliferate: it is the transitional stage of the disease. Lastly, the cells expressing CD45 Neg proliferate exponentially: it is the terminal stage of the disease. The results obtained in virtuo seem coherent with the clinical observations of the cancerologists. The in virtuo experiment has allowed to easily pre-test hypotheses which must be afterwards verified in vivo or in vitro. This research approach can be seen as a tool of reflection. It allows to restrict the number of ways to be studied and thus, probably, to gain a precious time in the field of cancer research. Let us now conclude on perspectives and discuss about this work. 240
Authorized licensed use limited to: Universite de Bretagne Occidentale. Downloaded on October 21, 2009 at 02:20 from IEEE Xplore. Restrictions apply.
488
(b)
(a)
Number of cells
Total number of cells
366
CD45 Neg CD45 Low
244
CD45 Bright 122
Time
0 0
40
80
120
160
Fig. 7. a: 3D visualization ; b: Kinetics of total cells, cells with high expression of CD45 (CD45 Bright), cells with few CD45 (CD45 Low), cells with no CD45 (CD45 Neg).
[6] P. Ballet, J. Pers, V. Rodin, and J. Tisseau, “A multi-agent system to simulate apoptosis model of B–CD5 cell,” in Proceeding SMC’98, IEEE International Conference on Systems, Man and Cybernetics, vol. 2, San Diego, CA (USA), 11–14 October 1998, pp. 1–5. [7] J. Tisseau, “Virtual reality – in virtuo autonomy –,” Ph.D. dissertation, Accreditation to direct research, University of Rennes I. http://www.enib.fr/˜tisseau/doc/hdrJTuk.pdf, Rennes (France), 2001. [8] M. Wooldridge, An Introduction to MultiAgent Systems. John Wiley and Sons, 2002. [9] J. Ferber, Multi-Agent Systems : An Introduction to Distribued Artificial Intelligence. Addison-Wesley, 1999. [10] H. Kitano, “System biology : a brief overview,” Science, vol. 295, no. 5560, 1st March 2002. [11] E. Tolman, “Cognitive maps in rats and men,” Psychological Review, vol. 55, no. 4, pp. 189–208, 1948. [12] R. Axelrod, Structure of Decision. Princeton, NJ: Princeton University Press, 1976. [13] B. Kosko, “Fuzzy cognitive maps,” International Journal Man-Machine Studies, vol. 24, pp. 65–75, 1986. [14] D. Koulouriotis, I. Diakoulakis, D. Emiris, E. Antonidakis, and I. Kaliakatsos, “Efficiently modeling and controlling complex dynamic systems using evolutionary fuzzy cognitive maps (invited paper),” International Journal of Computational Cognition, vol. 1, no. 2, pp. 41–65, June 2003. [15] C. Stylios and P. Groumpos, “A soft computing approach for modelling the supervisor of manufacturing systems,” Journal of Intelligent and Robotic Systems, vol. 26, no. 3–4, pp. 389–403, November–December 1999. [16] D. Yaman and S. Polat, “A fuzzy cognitive map approach for effet–based operations: An illustrative case,” Information Sciences, vol. 179, no. 4, pp. 382–403, February 2009. [17] J. Aguilar, “A survey about fuzzy cognitive maps papers (invited paper),” International Journal of Computational Cognition, vol. 3, no. 2, pp. 27– 33, June 2005. [18] N. Bl¨uthgen, “Dynamical models of signal transduction and the influence of feedback loop,” Ph.D. dissertation, Humboldt University Berlin. http://itb.biologie.hu-berlin.de/˜nils/, Berlin (Germany), 2001. [19] V. Rodin, A. Benzinou, A. Guillaud, P. Ballet, F. Harrouet, J. Tisseau, and J. Le Bihan, “An immune oriented multi-agent system for biological image processing.” Pattern Recognition, Elsevier, vol. 37, no. 4, pp. 631–645, April 2004. [20] C.-Y. Huang and J. Ferrel Jr, “Ultrasensitivity in the mitogen-activated protein kinase cascade,” Proceedings of the National Academy of Sciences of the United States of America (PNAS), vol. 93, no. 19, pp. 10 078–10 083, 17 September 1996. [21] B. Kholodenko, “Negative feedback and ultrasensitivity can bring about oscillations in the mitogen-activated protein kinase cascades,” European Journal of Biochemistry, vol. 267, no. 6, pp. 1583–1588, March 2000. [22] R. Bataille, N. Robillard, C. Pellat-Deceunynck, and M. Amiot, “A cellular model for myeloma cell growth and maturation based on an intraclonal CD45 hierarchy,” Immunological Reviews, vol. 194, no. 1, pp. 105–111, August 2003.
on the system. The study’s aim was to implement a model of cell with a complex coherent behavior. Indeed, this is the hard core of modelling multi-agents model. As far as we know, multiagents model developed simulate simple organism such E. Coli [4], [5] or cell limited behavior [6]. But we also would like to simulate more biological process like Multiple Myeloma which is a Plasma Cell cancer. Myeloma Cells are very complex cells which integrate many stimuli coming from bone microenvironment. Consequently, we decided to find a methodology which respects many features. First, methodology should allow semantics which is an important point to integrate experts’ knowledges and to test hypothesis of biologists. Next, the methodology should allow retroaction. So, we use a Fuzzy Influence Graph which is commonly called Fuzzy Cognitive Map (FCM). In FCMs we used, nodes are the presence of activated molecules. So, it exists a semantic in each node of the graph this make us able to discuss with expert. Moreover, FCMs theory allows retroaction either positive or negative. Finally, FCM dynamics is randomly computed by oRis simulator. This permit each cell to have his own dynamic. Nevertheless, figure 5-d shows that most of the cells behave in the same way. So, we believe that FCM dynamics is closer to natural behavior than a purely deterministic method. R EFERENCES [1] H. Atlan, “The living cell as a paradigm of complex natural systems,” Complexus, vol. 18, no. 6–7, pp. 764–766, 2003. [2] J. Vohradsky, “Neural model of the genetic network,” Journal of Biological Chemistry, vol. 276, no. 39, pp. 36 168–36 173, 28 September 2001. [3] K. Sachs, D. Gifford, T. Jaakkola, P. Sorger, and D. Lauffenburger, “Bayesian network approach to cell signaling pathway modeling,” http://stke.sciencemag.org/cgi/content/abstract/sigtrans;2002/148/pe38, 3 September 2002. [4] J. Kreft, G. Booth, and J. Wimpenny, “BacSim, a simulator for individual-based modelling of bacterial colony growth,” Microbiology, vol. 144, pp. 3275–3287, 1998. [5] C. Jonker, J. Snoep, J. Treur, H. Westerhoff, and W. Wijngaards, “Putting intentions into cell biochemistry: an artificial intelligence persepective,” Journal of Theoritical Biology, vol. 214, no. 1, pp. 105–134, 7 January 2002.
241
Authorized licensed use limited to: Universite de Bretagne Occidentale. Downloaded on October 21, 2009 at 02:20 from IEEE Xplore. Restrictions apply.