DocCube : multi-dimensional visualisation and exploration of large document sets Josiane Mothe(1,2), Claude Chrisment(1), Bernard Dousset(1), Joel Alaux(1) (1) Institut de Recherche en Informatique de Toulouse Université Paul Sabatier, 118 Route de Narbonne, 31062 Toulouse Cedex, France (2) Institut Universitaire de Formation des Maîtres Midi-Pyrénées 56 av de l’URSS, 31400 Toulouse, Fance Fax : 33 5 61 55 68 52 Tel : 33 5 61 55 63 22 e-mail :
[email protected] http://www.irit.fr/~Josiane.Mothe
KEY-WORDS Information retrieval, global visualisation, 3D representation, multidimensional visualisation and analysis
ABSTRACT This paper presents a novel user interface that provides global visualisations of large document sets in order to help users to formulate the query that corresponds to their information needs and to access the corresponding documents. An important element of the approach we introduce is the use of concept hierarchies (CHs) in order to structure the document collection. Each CH corresponds to a facet of the documents users can be interested in. Users browse these CHs in order to specify and refine their information needs. Additionally the interface is based on OLAP principles and multi-dimensional analysis operators are provided to users in order to allow them to explore a document collection.
1
DocCube : multi-dimensional analysis of documents KEY-WORDS Information retrieval, global visualisation, 3D representation, multidimensional analysis
ABSTRACT 1. INTRODUCTION The amount of information available electronically is so huge that more and more sophisticated information management systems are necessary to exploit it. In addition to efficient retrieval engines that give direct access to the document content, the users need some tools to provide them with global views of the available information so that they can define or refine their information need or their query formulation accordingly. Helping the user to formulate his query in order to improve the search results is not a new issue and a wide range of approaches have been studied in information retrieval literature. Query reformulation is one of the first and most popular tracks that has been explored in order to help the user refining her/his information need formulation. Different methods have been developed in the literature to automatically reformulate a user's query. Relevance feedback is one of them. In relevance feedback, the user is asked to judge the relevance of some of the documents (generally the first top documents) retrieved according to an initial query. The information (i.e. the indexing terms) extracted from relevant documents and nonrelevant documents, combined with the initial query, is used to automatically expand and re-weight the query terms [34], [18]. An important feature of this method is that it requires relevance judgements. Thesauri have alternatively been used in order to reformulate automatically a user's query. In [17], the query is modified by adding terms from an online thesaurus related to the initial query terms. Many general and domain-oriented online thesauri exist that can be used for this purpose. Both relevance feedback and query expansion implies that an initial query is provided to the system. However, many users find it difficult to formulate an initial query and to decide what should be the relevant terms to use. The shortness of the queries on the web is one of the manifestations of these difficulties. One of the reasons of these difficulties is that information retrieval systems generally do not provide elements to help the user understanding the relationships that exist between documents and queries. In addition, there is generally no a coherent access to the information because of the heterogeneity in term meaning, name conventions and user perceptions [31]. This is especially true on the World Wide Web where information is available on about all the subjects. Web portals offer a solution to that problems. They have been developed in order to provide the user with subject directories that gather information of given topics. In the case of subject or domain portals, the knowledge of the domain is transcribed into a category structure. One of the interesting components of the subject directories is their information navigation foundation. The user browses the category or concept hierarchy in order to formulate his information need. Indeed, doing so, the user is guided in the information space and never loses the semantic context of his current query formulation. Number of Web portal organises the URLs into such categories (e.g. Yahoo!). Some specialised databases provide the same kind of functionalities.
2
MEDLINE for example is a collection of medical articles associated with the MeSH (Medical Subject Headings) thesaurus. Indeed, whereas thesauri have been widely used as an input source when analysing texts, it seems that they will have more importance during retrieval in the future [35]. Thesaurus-like structures or ontologies will be important components of the semantic web [4]. This project aims at extending the web by structuring it in order to ease automatic web processing and to allow a closer cooperation between human users and agents. Thesauri will be one kind of components of the semantic web; an other type are the intelligent agents or applications that will be able to handle the information and to provide the users some help when exploring the available information. However, in most of the current applications thesauri are used as adhoc components in order to expend an initial query. An other feature of the current applications is that thesauri are used to represent the entire word (e.g. WordNet) or a specific domain (e.g. MeSH) [19] but do not take into account the variety of facets a document has. Applications that would take into account the different facets or points of interest of the users would make information access easier to the user. This paper introduces a novel user interface that corresponds to this type of applications. We promote an approach where information searching and exploration take place in a domain-dependant semantic context. A given context is described along concept hierarchies (CH) or ontologies that depict different facets of the documents. This component provides users with the knowledge of the domain according to complementary points of view. This type of knowledge is missing in current IR applications ; even if it is mandatory for users to decide the terms to be included in the initial query. In our approach, the CHs are used in order to structure a document collection or a document flow. The task to be carried out is document categorisation [22], [13]. The ontologies not only provide the query language for users. They also allow them to explore the information space, that is to say the vocabulary of the domain and its structure. Moreover, the CHs are used in a novel way to provide the users with global views and knowledge of the document collection. A key component of our approach is that CHs allow to define a visual presentation of the entire collection or of a sub-collection based on multi-dimensional analysis. Traditional multidimensional analysis operators are provided to allow the user to analyse and explore the information space before deciding to access some documents. The paper is organised as follows. In section 2, we parallel the case of multidimensional analysis based on texts with the case of data. Structure data is the type of source usually used in Knowledge Discovery from Database. Handling text implies additional functionalities that we point out. In section 3, we present the DocCube model. This model answers the needs for applying multidimensional analysis to structured or non structured texts. The DocCube interface and the added value of the operators this interface includes are then described in detail in section 4. More specifically we indicate how users are assisted when querying and analysing a document collection. The last sections correspond to the related works, discussions and conclusion.
2. FROM KNOWLEDGE DISCOVERY TEXTS
IN
DATABASES
TO
KNOWLEDGE DISCOVERY
IN
The main goal of KDD (Knowledge Discovery in Databases) is to extract or infer useful and previously unknown knowledge from important volumes of data [16]. KDD corresponds to a decision support process. As examples, this technology can be used to analyse customer behaviours or to predict market
3
evolutions. In the context of text, the knowledge includes word association, trend [8], information classification and correlation. A KDD process is divided into three stages [9], [16]: Data selection and pre-treatment: This consists in collecting, homogenising, cleaning and reducing the data. This phase aims at improving the space of data to explore in order to provide the only useful pieces of information to mine according to the users’ objectives. In the context of structured data, this is achieved by filtering and summarising the data from on-line databases that traditionally support the OLTP (On-Line Transaction Processing). The filtering is obtained by querying data sources. Summarising is used to turn the detailed data into more global data. The resulting data is generally stored in a data warehouse. Indeed, a data warehouse is defined as a repository of data designed to support management decision-making and provides integrated and historical data from which to do analysis [21], [36]. A major difference between data (from databases) and texts is that in the former case the information is described by a limited set of attributes. On the contrary, texts contain a large variety of information. that has first to be extracted. The definition of new languages such as XML [6] and RDF and the generalisation of their use (as recommended by the W3C for the Web) ease the representation of documents under the form of patterns or (attribute: values) couples. This feature makes texts and structure data comparable with regard to their management, specifically considering data analysis and mining techniques. Even for non structured documents, it is possible to add value on their content and to represent them according to facets (that can be parallel to attributes for data bases) that can be useful for users. We argue that categorisation techniques can be applied for that purpose. Given categories (or attribute values), textual documents are automatically associated to the relevant ones. In section 3, we describe the technique use and the results obtained regarding this type of document representation. Data analysis and mining: The main objective of data mining and analysis is to mine the cleaned information in order to discover existing but previously unknown relationships among the data [16]. A distinction can be done between data mining and data analysis. Data mining refers to the automatic discovering of rules, which can then be used in an expert system for example. Data mining is directly related to the machine learning and KDD. The main functions defined in data mining are [1]: classification and clustering, discovering of dependencies and temporal dependencies. On the other hand, multidimensional analysis is used in OLAP mechanisms ; a data warehouse is typically modelled multidimentionally in order to ease this type of analysis [9]. The dimensions are defined according to the type of data manipulated by the operational sources. As examples, the dimensions can be the product, the time of sale, the seller or the shop, etc. Generally, the dimensions are hierarchical so that roll-up (increasing the level of aggregation, looking at more global information) and drill-down (decreasing the level of aggregation, looking at the detailed data) operations can be performed. To multidimensionality analysis is associated a graphical interface that allows to visualised the figures of 2 or 3 dimensions simultaneously. Multidimensional analysis is typically interactive and uses roll-up and drill-down operations. The knowledge extracted from the data is either visualised by the user through an adapted interface or automatically written down via reporting tools. With regard to texts, mining can refer to automatic term and document classification [10], [12], [15], [20]. In the latter case, documents are analysed considering their representation which corresponds generally to “bag of words”. That is to say that like in IR applications, each document is represented by a set of terms
4
and the role of the terms within the documents are not taken into account. Other applications intend to extract term correlation from a target set of documents. In our approach we consider the different facets a document has as document dimensions [27]. Like in data cubes, these dimensions are hierarchical and roll-up and drill-down operators are available for the user to analyse the document collection and the repartition of the documents according to the dimension values. Interpretation: The objective is to fulfil the user's needs in term of knowledge and to allow him or her to take the relevant decisions. The information produced by the analysis or mining process has to be presented to the user in the most synthetic and expressive way. This is the case with multidimensional analysis and the associated data cube views. The current applications that handle texts only aim at providing users with maps that show the term correlation (e.g. Semiomaphttp://www.semio.com/products/semiomap.html) or the document correlations (e.g. Kohonen maps [29], [33], ) or tree-like representation (e.g. Dendrogram). Our approach is different has we suggest to apply OLAP techniques in order to provide users with a way to analyse the document collection before starting querying it. Direct access to document content is also possible with our application.
3. DOCCUBE MODEL On of the key components of the DocCube approach is its multidimensional modelling. The information is organised according to dimensions and to facts that can be interactively analysed. DocCube relies on a data warehouse which schema is presented in the next paragraph. In this section we also indicate how new documents are taken into account in this structure.
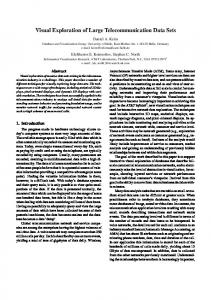
3.1. Multidimensional modelling Generally speaking, a data warehouse is composed of a fact table, which stores the measures to be analysed, and dimensional tables, which corresponds to the axes along which the measures can be analysed. The DocCube model is based on a star schema [30] (see figure 1a) and is composed of several dimension tables and a fact table. Time
Dim1 table
Fact table Dim1Ref Dim2Ref … Value
Dim1Ref Level1 Level2 ….
Time Day Month Year
Fact table
Dim2 table Dim2Ref Level1 Level2 ….
a) General data warehouse model (star schema)
Time Industry Country Doc. Ref Weight
CH Country
CH Industry Industry Level1 Level2 ….
Country Town Country Continent
b) DocCube model
Figure 1 : Star schema of the web data warehouse
5
3.1.1. DOCCUBE DIMENSION TABLES The model contains one dimension table per dimension i.e. per facet that describes the domain. A dimension is organised as a concept hierarchy; the different levels are depicted in a single table. These dimension tables are not different from the ones used in traditional OLAP systems. It is important to note that the number of dimensions is not limited a priori. It depends on the application and on the type of users’needs the application answers. For example, when science monitoring is concerned, relevant dimensions are document authors and affiliations, the date of document creation or of last modification, pages referenced (either at a URLs, servers or domain name level), the products cited in the page. [26]. The relevant dimensions will not be the same for an economic application. In this latter case, the dimensions could be for example the economic indicators, the type of industry and the geographic regions concerned. The text dimensions can be parallel to attributes in databases. They correspond to the characteristics that depict the information. 3.1.2. DOCCUBE FACT TABLE A fact table traditionally stores the measures to be analysed and keeps the links with the dimension tables; no direct link is kept with the initial data source used to compute the measure values (excepted some meta data on the source). One of the reasons is that data warehouse are generally designed in order to summarise the data that are managed by the transaction processing and that the usual decision support systems do not imply to visualise the raw or source data. The fact table content is different in DocCube. This is due to the nature of the source information itself. Whereas in databases sources the information is represented under "attribute: value" or "attribute: set of values" templates, this is not the case for textual information. The transformation under such a format corresponds to an intermediate step. In DocCube, this intermediate step is achieved by categorising documents according to the different dimensions representing the domain. The fact table stores the results of this categorisation step. The fact table keeps the link between the different dimensions and the document. In addition, because of that link, the user can access the document content when needed. Like in information retrieval systems, the link between a document and a concept can be weighted. More precisely, the “weight” (see Figure 1b) stores the degree of confidence on the association of the text with the concept hierarchy node. This weight results from the document categorisation and it is used when the user accesses the documents in order to provide him with an ordered document list. The link with the document content is kept through the “Doc. Ref” field, which corresponds to the document identifier or document URL. In that model, a document can be categorised in different places in the information space, even in the same dimension. Indeed, the assumption that a document can be categorised in different categories is more realistic that considering a document can be clearly identified as belonging to a unique category [19]. Figure 1b gives the example of the part of the model devoted to represent the economic domain as described in the IRAIA project (http://iraia.diw.de). In that case, the dimension tables represented are time, industries and countries, all of them corresponding to hierarchical categories.
6
3.2. Association of texts to dimensions. The association of textual documents to dimensions corresponds to a categorisation task and is based on the "vector voting method" [32]. This method is based on a voting mechanism that is similar to the HVV (Hyperlink Vector Voting) method used in the Web context to calculate the authority of a page [23]. The basis of the process is that the more terms from the profile of a category occur in a text, the stronger is the link between the text and that category. In this section we only present the results we validated by experiments. Alternative methods, discussion and results can be found in [28]. 3.2.1. DEFINITION OF THE CATEGORY PROFILES Category profiles are learnt from a training set of positive and negative examples (documents already categorised). We calculate different estimators by analysing the training set in order to decide the terms to be added to each category profile as follows: Given, Fi g the term frequency in the group or category, Fic , the term frequency in the collection ; the function that leads to the best results was defined as follows:
R = Pi − Qn gi where Pi =
Est ( Fi g ) Est (TFg )
, Qn gi =
Est ( Fin g ) Est (TFn g )
and
Fin g = Fic − Fi g , TFg = å Fi g , TFc = å Fic , Est ( Fi g ) = Fi g + 0.5 ,
Est (TFg ) = TFg +
nb nb Est (TFn g ) = TFn g + Est ( Fin ) = Fin + 0 . 5 g g 2 , 2 ,
3.2.2. VECTOR VOTING The weight of the link between a document D and a category E from a dimension H is computed as æ NT ( E , D ) ö follows: æ F (T , D) S ( H ) ö ççè NT ( E ) ÷÷ø VotingWeight(E(H),D) =
å çç
è S ( D)
*
÷*e F (T , H ) ÷ø
Where: F(T,D) is the number of occurrences of T in D, S(D) is the total number of terms in D, S(H) is the total number of terms in H, F(T,H) is the number of occurrences of T in H, NT(E,D) is the number of terms from the profile of E that occur in D and NT(E) is the number of terms that compose the profile of E. Discussion on that function (and other functions) can be found in [28].The results we obtained on Reuters-21578 improves the results compared to Rocchio method. We obtained a precision higher than 80% (whatever the recall considered).
4. DOCCUBE INTERFACE The DocCube interface aims at providing the users with complementary functionalities, including: -
Access to document content,
-
Knowledge derived from the entire collection.
7
When scientific monitoring is involved, DocCube allows one to visualize global information such as the number of publications per author, per domain or per topic [25], what are the main authors in a given area. Knowledge on relationships between the authors and the topics of the documents ; the strength of these links and their evolution in the time can also be discovered. In the same way, it is possible to extract what are the organisations involved in a given topic and how all these relationships have evolved in time. Whatever the application, DocCube provides global views of the document collection content. By browsing the dimensions, the user know the dispersion of the documents according to the dimension values and can change the level of aggregation he want to visualize. At any moment, he can have direct access to the documents associated with selected dimension values. In addition, the user is guided to express his information need according to the language of the domain (described along the dimensions or concept hierarchies) ; he can refine his information need in an interactive way. The existing applications are mainly devoted to handle data from structured sources (data bases). The specificity of the documents leads us to develop a new interface. It implements the commonly used operators (drill down, roll-up and slices). Different interfaces have been proposed in the literature to provide users with advanced functionalities [2], however, our purpose is different: in a first stage, we aim at showing the importance of the main operators of the OLAP systems to explore and visualize large collections of documents.
4.1. Information space DocCube corresponds to a subject portal where different domains are available. To start with, the user has to decide the information space he wants to move in. The corresponding concept hierarchies or dimensions that describe the information space the user can move in are then displayed. Like OLAP systems, DocCube provides two and three dimensional visualisations. However, more than three dimensions can be used to depict the information space. Indeed, a user has to select up to 3 dimensions when analysing the collection. Once the user has decided the information space and the dimensions he is interested in, to start with a collection browsing, the user is provided with the top level of the dimensions or hierarchies. This is a commonly used starting point that is reasonable to provide to the user. The user can then browse the hierarchy until he riches the level of detail he is interested in (see Figure 2). Users who know well the hierarchy contents can directly select the level without any browsing: an example of terms in each level is provided to the user to remember him the kind of detail is contained at each level (see Figure 3). In addition to the level in the hierarchy, the user can select the concepts he wants to focus on. These concepts do not really correspond to a query that could be used to access documents in a traditional information retrieval system, instead, these concepts correspond to the general description of the user interest. Whereas concept hierarchies browser are traditionally adapted to select punctual values (or concepts), in DocCube, the dimension browser is optimised in order to select set of entries. Two different colours distinguish selected (green colour) and non-selected (red) entries (see Figure 2).
8
Figure 2: Selection of hierarchy level and of sets of concepts to be used during the analysis
Figure 3. Direct selection of the hierarchy level without browsing the hierarchies
Whatever the level chosen by the user, selecting a given node leads to an automatic selection of all its children in addition to its parents. Figure 4 illustrates this feature.
9
Whenever the user modifies the selection of the nodes, DocCube makes automatically the selection being coherent. A toolbox completes the node selection component. These tools allow for examples the user to invert the selection, select and deselect all the nodes or display only the selected elements. A C
B
Node selected by the user
D
E F
G
When the node E is selected, its parents (A and C) are automatically selected and its children as well (F, G and H)
H
Figure 4: Node selection in a hierarchy of DocCube
4.2.
3D representation
Figure 5: DocCube 3D global representation of documents The 3D representation corresponds to the core component of the DocCube interface (see Figure 5). It displays a global view of the documents related to the concepts chosen by the user. The axes of the cube correspond to the dimensions whereas the spheres represent the number of documents that have been categorised in the corresponding category (dimension value). The dimensions of the sphere are related to the corresponding number of documents. When applying roll-up, the counting takes into account the documents that are placed in categories corresponding to children of this node.
10
Lets C,N,I be a concept (category) from the hierarchy I which is at level N, LI is the leave level for the category I and Doc (CI) is the set of documents that have been placed in CI. The size of the sphere is proportional to the following number:
( ( (
( )) ( )) ( ))
æ Doc (C N ,I ) ∪ Doc (C N −1, I ) ∪ ... ∪ Doc C LI , I ∩ ö ç ÷ Card ç Doc (C N , J ) ∪ Doc (C N −1, J ) ∪ ... ∪ Doc C LI , J ∩ ÷ , ç ÷ ç Doc (C N ,K ) ∪ Doc (C N −1, K ) ∪ ... ∪ Doc C L , K ∩ ÷ è ø I where Card corresponds to the number of documents in the specified set.
4.3. Roll-up and drill-down These operators refer to the possibility for the user to change interactively the level of aggregation of the analysed data. Rolling-up, the user goes up the levels and obtains more general information; the opposite operation corresponds to a drill-down. In DocCube, that allows the user to refine the level of detail he needs for the global document visualisation, before eventually querying the system in order to access the document content.
4.4. Slice The slice function is used to set one of the dimensions and to obtain a two dimensional view of the results (See Figure 6). In DocCube, this operation results in a graph that represents the number of documents under the form of circles. The slice operator is run via the mouse device. In addition, the user can interactively modify the scale of the obtained graph. This is particularly important because the number of documents i.e. the size of the corresponding circles can vary from one slice to another. The same functionality exists for the 3D representation.
Figure 6: A DocCube slice
4.5. Document access A direct query can be formulated by selecting one or several spheres in the cube. As a result of the selection the document references are displayed under the form of a ranked list. The terms corresponding to the query are highlighted and are displayed also in the search result windows at the same time than the
11
corresponding document references. The top documents correspond to the ones that get the best scores. These document scores are computed as an average of the weights associated with documents as follows:
Score( Dd ) =
(
Avg H = I , J , K Weight (C N , H , Dd ) + Avg (Weight (C N −1, H , Dd ) ) + ... + Avg (Weight (C LH , H , Dd )
)
LH − N
where Dd is a document, AvgH=I,J,K corresponds to the average of the value obtained for the three concept hierarchies (I, J, K), CN,H is a concept from the hierarchy H that occurs at the level N and LH is the leave level of the hierarchy H.
Figure 7: Access to documents in DocCube
4.6. Examples of analysis using DocCube DocCube is useful for users in different ways. It depends on the dimensions that have been chosen as axes. In this paper, we describe two classes of usage. 4.6.1. BIBLIOMETRIC ANALYSIS AND SCIENCE MONITORING DocCube provides an interesting ground for performing systematic bibliometric studies. The objective of bibliometric systems is to provide a way to represent relationships between the information that is analysed. One of the applications is science monitoring [26], [13]. In the case of DocCube, the global visualisation can provide 3D histogram-like views that indicate the users what are the main authors or organisations involved on the different subject topics, along time for example. To get such information, the three following dimensions have to be chosen when defining the data cube: the author dimension, the theme and the time. In the applications we did using DocCube, the author dimension is defined hierarchically : the top level represents the country of the authors, the next level is the organisation in which the authors are affiliated and finally the leave level corresponds to the authors them selves. With regard to the time dimension, the hierarchy is defined in a traditional way. Finally, the theme is defined 12
according to the concept hierarchy of the domain (in some application, for which we did not had a concept hierarchy of the domain, we used all the main indexing terms, but in that case, the theme dimension had a single level. Like in traditional OLAP systems, the set of data can be visualised at different levels of granularity. Thanks to DocCube, it is possible to know what are the main authors in a sub-domain or, changing the level of abstraction, what are the main laboratories. It is also possible to know what are the sub-domains (topics) that are shared by almost all the organisations (each organisation gets a circle for the corresponding concept) and what are the specificities of an organisation (only a few organisations get a circle for a given topic. The slice functionality (see figure 6) provides views that are easier to interpret for a naïve user. The size of the circles directly provide the users with the information on how important are the different elements (dimension values) in the analysed collection. For example, considering the two dimensions “organisations authors belong to” and “topics”, if circles of equal size are shown for a given organisation whatever the topic is, that means that all the topics correspond to a domain of interest for that organisation. On the opposite if a single organisation is present for a given topic, that can mean that this topic corresponds to a specificity of this organisation. This type of information is particularly interesting when trying to detect who are the other companies working in the same area or whom it could be interesting to collaborate with in a given area. 4.6.2. QUERY ENHANCEMENT: DocCube allows the user to navigate into the information space by browsing the concept hierarchies that define the domain. Knowing better the vocabulary of the domain, he can enhance his query. Additionally, the global visualisation provided by DocCube gives him indications on the level he should choose for the query before accessing the documents. If too many documents are attached to a given node, the user knows, that he should use more specific terms (i.e. go deeper in the hierarchy level). If too few documents are associated with the terms he is interested in, he knows that he should chose an upper level. Moreover, a single view corresponds to the result of many trials using a traditional IR system. Users can decide whether he wants to access the documents from a node or not (the result of a traditional IR query). Additionally, they are provided with overviews of a grid of query results: the documents are directly linked to the different facets of the query. This type of views can be seen as categorisation on the fly, according to the users’ intererest.
5. RELATED WORKS Different interfaces have been presented in the literature that aim at helping the user when querying a document collection and navigating either in the query space or in the indexing space. Some of these interfaces aim at providing summarised views of the collection, other locate the different documents according to a given information space. Graphical representation of document clustering is one of the first type of tools that have been provided to the user to help him browsing the collection or retrieved document set. Kohonen maps have been widely used for this purpose. [33] for example displays the results of a document similarity-based clustering on two coloured maps. The intensity of the colours reflects the density of the documents in a given cluster. [7] presents the "Bead" system. Bead displays bibliographic documents as cubes where the documents are placed on the surface in clusters according to the document similarity. Other tools are based on 13
classification results. [24] presents a system where the documents are display under hierarchies. Cat-aCone [19] is an interactive interface allowing the document collection consultation through the search and browsing of large category hierarchies to which the documents are associated. The user can specify attributes, which induce a change in the organisation and the display of the document set. [5] presents a graphical display of the document summaries. A capsule overview (containing a set of topic stamps plus their textual context) is displayed according to several levels of document granularity (from whole document to paragraph level). A third type of visualisation interface provides the user with global visualisation of documents in the query space. In [3] the documents are displayed in a 3D space where the axes correspond to keywords given by the user. [14] presents VIBE (Visual Information Browsing Environment) a visual information retrieval system where the retrieved documents are displayed according to the query space. The Isidor interface represents the information space under the form of a cone where the axes correspond to query terms [11]. The same kind of approach is used in TOFIR [37] where special view points are defined. They correspond either to query components or to other interesting points.
6. DISCUSSION AND CONCLUSION The DocCube interface provides a novel kind of access for subject directories content. One of the functionalities of DocCube is an easy browsing into the information space of a domain. Because concept hierarchies or thesaurus-like structures describe the domain, the user is guided in the information space and never loses the semantic context of his current query or interest formulation. A key component of the interface is that the concept hierarchies are seen as document dimensions. This multidimensionality allows an analysis based on On Line Analytical Process that provides useful global visualisation of a document set. DocCube provides decision support components that make it relevant for bibliometric analysis. In addition, users are helped for query enhancement. Because they get a direct view on the link between documents and possible query terms, they understand better the information space and the terms to be used for an efficient retrieval. Finally, access to the document content is easily obtained when selecting one or several nodes in the cube representation. All the screen dumps included in this paper have been obtained using the DocCube system. The interface is based on a database that manages web documents on the economic domain as well as concept hierarchies that have been provided by experts. DocCube has been modelled so that other domains can easily be added. In the future, we will to create a new domain in order to handle REUTER articles. To REUTER articles are associated terms from different hierarchies. Because of that, this information can be added easily to DocCube. Another short-term perspective is to integrate an automatic classifier to DocCube. This classifier will place new documents into one or several categories of the corresponding domain. We believe that DocCube type of applications corresponds to a key component of the future semantic web. It provides a way to structure the web in addition to intelligent tools to analyse the document content in a global way.
14
7. ACKNOWLEDGEMENT We would like to thank Alan Smeaton for his valuable comments and discussions. Specials thanks to Sarah Chrisment.
8. REFERENCES [1] R. Agrawal, T. Imielinski, A. Swami, Database Mining: A Performance Perspective, IEEE transactions on knowledge and data engineering, pp 914-925, Vol.5, N.6, 1993. [2] A. Ammoura, O. Zaiane, Y. Ji, "Immersed Visual Data Mining: Walking the Walk," Proc. of the 18th British National Conference on Databases, Oxford, UK, July2001 [3] S. Benford, D. Snowdon, C. Greenhalgh, I. Knox, C. Brown, VR-VIBE: A Virtual Environment for Cooperative Information Retrieval, pp 349-360, Eurographics Association, Frits Post & Martin Gobel (Guest Editors), 1995. [4] T. Berners-Lee, J. Hendler, O. Lassila, The Semantic Web, Scientific American, 2001, http://www.scientificamerican.com/2001/0501issue/0501berners-lee.html. [5]
B. Boguraev, C. Kennedy, R. Bellamy, S. Brawer, Y-Y Wong, J. Swartz, Dynamic Presentation of Document Content for Rapid On-Line Skimming, AAAI Spring Symposium on Intelligent Text Summarization, 1998.
[6] T. Bray, J. Paoli, C.M. Sperberg-McQueen, Extensible Markup Langugae (XML) Specification, 1998. http://www.w3.org/TR/REC-xml. [7]
M. Chalmers, R. Ingram, C. Pfranger, Adding imageability features to information displays, pp 3339, Proceedings of the ACM Conference on User Interface Software and Technology (UIST), 1996.
[8] G. Chang et al., Mining the World Wide Web - An Information Search Approach, Kluwer Academic Publishers, Boston, Hardbound, ISBN 0-7923-7349-9, June 2001. [9] S. Chaudhuri, U. Dayal, An overview of data warehousing and OLAP technology, ACM SIGMOD Record, Vol. 26, N.1, pp 65-74, 1997. [10] C. Chekuri, M.H. Goldwasser, P. Raghavan, E. Upfal, Web search using automatic classification, 6th International Conference on the World Wide Web, 1997. [11] M. Chevalier, ISIDOR: a visualisation interface for advanced information retrieval, 2nd Internation Conference on Entreprise Information Systems, pp 414-418, 2000. [12] F. Crimmins, T. Dkaki, J. Mothe, A. Smeaton, Tétrafusion: Information Discovery on the Internet, Intelligent Information Retrieval, pp 55-63, July-August 1999. http://www.irit.fr/~Josiane.Mothe. [13] Y. Ding, Gobinda G. Chowdhury and S. Foo, Bibliometric cartography of information retrieval research by using co-word analysis, Information Processing & Management, Vol. 37, N. 6, pp 769-857, November 2001. [14] D. Dubin, Document analysis for visualization, pp 199-204, Proceedings of the 18th Annual International ACM SIGIR Conference on Research and Development in Information Retrieval, Seattle, Washington, 1995. [15] S. Dumais, H. Chen, Hierarchical classification of Web documents, 23nd International Conference on Research and Development in Information Retrieval, Athens, 2000. [16] U. M. Fayyad, G. Piatetsky-Shapiro, P. Smyth, R. Uthurusamy, Advances in Knowledge Discovery and Data Mining, AAAI Press, ISBN 0-262-56097-6, 1996. [17] S. Gauch, J. B. Smith, An Expert System for Automatic Query Reformation, Journal of the American Society of Information Science, Vol. 44, N. 3, pp 124-136, 1993, http://citeseer.nj.nec.com/gauch93expert.html
15
[18] D. Harman, Relevance Feedback Revisited, Proceedings of the 15th Annual International ACM SIGIR Conference on Research and Development in Information Retrieval. Copenhagen, Denmark, June 21-24, pp 1-10, 1992. [19] M.A. Hearst, C. Karadi, Cat-a-Cone: an interactive interface for specifying searches and viewing retrieval results using a large category hiearchy, International ACM Conference on Research and Development in Information Retrieval, 246-255, 1997. [20] M.A. Hearst, The use of categories and clusters for organizing retrieval results, in Natural Language Information Retrieval, T. Stralkowski (Ed.), Kluwer Academic Press, 2000. http://www.sims.berkeley.edu/~hearst. [21] W.H. Inmon, What is a data warehouse?, PRISM, Vol.1, N.1, 1995. [22] A.K. Jain, M.N. Murty, P.J. Flynn, Data clustering: a review, ACM Computing Surveys, Vol.31, N.3, pp 264-323, 1999. [23] Y. Li, "Toward a qualitative search engine", IEEE Internet Computing, 24-29, Vol.2, N.4, 1998. [24] S. Mukherjea, J.D. Foley, S. Hudson, Visualizing complex hypermedia networks through multiple hierachical views, in Proceedings of CHI, pp 331-337,1995. [25] J. Mothe, Internet-based information discovery: Application to monitoring science and technology, Research in Official Statistics, Vol.1, N.1, pp 17-30, 1998. [26] J. Mothe, D. Egret, T. Dkaki, B. Dousset, Analysis of evolutionary trends in astronomical literature using a knowledge discovery system: Tétralogie, Library and Information Services in Astronomy III Conference, LISA III, publié dans ASP Conference Proceedings Series, 1998. [27] J. Mothe, C. Chrisment, T. Dkaki, B. Dousset, D. Egret, "Information mining: use of document dimensions in order to analyse a document set", pp 66-77, European Colloquium on Information Retrieval Research, 2001. [28] J. Mothe, G. Hubert, J. Augé, K. Englmeier, Catégorisation automatique de textes basée sur des hiérarchies de concepts, submitted to ISI, 2002. [29] E. Oja, S. Kaski, Kohonen Maps, ISBN: 0-444-50270-X, ELSEVIER, 1999. [30] T Palpanas: Knowledge Discovery in Data Warehouses. SIGMOD Record 29(3): 88-100(2000) [31] M.P. Papazoglou, H.A. Proper, J. Yang, Landscaping the information space of large multi-database networks, Data and Knowledge Engineering, N. 36, V. 3, pp 251-281, 2001. [32] B. Pauer, P. Holger, Statfinder, Document Package Statfinder, Vers. 1.8, mai 2000. [33] P. Poinçot, S. Lesteven, F. Murtagh, Maps of information spaces: Assessments from astronomy, Journal of the American Society for Information Science, Vol. 51, N. 12, pp 1081-1089, 2000. [34] G. Salton, The SMART Retrieval System – Experiments in automatic document processing, Prentice Hall Inc., Englewood Cliffs, NL, 1971. [35] A.A. Shiri, C. Revie, Thesauri on the Web: current developments and trends, Online Information Review, Vol. 24, N. 4, pp 273-279, 2000. [36] J. Widom, Research problems in data warehousing, International Conference on Information and Knowledge Management, 1995. [37] J. Zhang, TOFIR: A tool of facilitating information retrieval – introduce a visual retrieval model, Information Processing and Management, N.37, pp 639-657, 2001.
16