www.nature.com/scientificreports
OPEN
received: 30 December 2015 accepted: 14 June 2016 Published: 11 July 2016
Multi-functionality Redefined with Colloidal Carotene Carbon Nanoparticles for Synchronized Chemical Imaging, Enriched Cellular Uptake and Therapy Santosh K. Misra1,*, Prabuddha Mukherjee2,*, Huei-Huei Chang1, Saumya Tiwari2, Mark Gryka2, Rohit Bhargava2 & Dipanjan Pan1 Typically, multiplexing high nanoparticle uptake, imaging, and therapy requires careful integration of three different functions of a multiscale molecular-particle assembly. Here, we present a simpler approach to multiplexing by utilizing one component of the system for multiple functions. Specifically, we successfully synthesized and characterized colloidal carotene carbon nanoparticle (C3-NP), in which a single functional molecule served a threefold purpose. First, the presence of carotene moieties promoted the passage of the particle through the cell membrane and into the cells. Second, the ligand acted as a potent detrimental moiety for cancer cells and, finally, the ligands produced optical contrast for robust microscopic detection in complex cellular environments. In comparative tests, C3-NP were found to provide effective intracellular delivery that enables both robust detection at cellular and tissue level and presents significant therapeutic potential without altering the mechanism of intracellular action of β-carotene. Surface coating of C3 with phospholipid was used to generate C3-Lipocoat nanoparticles with further improved function and biocompatibility, paving the path to eventual in vivo studies. Nanomedicine shows enormous promise for diverse biomedical fields such as diagnostic imaging1–5, therapy6 and image-guided therapies7,8. At a nanometer scale, the properties of agents can be precisely tuned with respect to their composition, size, shape and the functionalities at the surface9,10. In addition to individual properties, nanoparticle ‘multi-functionality’ is immensely attractive, providing impetus to develop specialized particles tailored for specific purposes. Typically, nanoparticles are the result of controlled self-assembly of various building blocks, which individually provide a specific desirable property to the final particles11–13. One of the most attractive properties has been prominent in preclinical studies, showing the benefits of using nanoparticulates as ‘excipients’ in reducing drug toxicity and efficacy. Despite the early promise, however, very few have actually been translated for human use due to a host of delivery, uptake and tracking issues14–16. The desire to enable nanomedicine solutions has prompted the design of “multifunctional” nanoparticles, where additional competences like targeting specific sites or function and image contrast enhancement are added. Introduction of multi-functionality can be defined with an extensive assortment of homing, imaging and agents leading to many applications, including imaging5,17,18 targeted therapy19,20 or imaging guided therapy21–23, sensing24,25, bio-separation26, cellular labeling27, and gene therapy28. Although this approach is appealing, additional functionality typically requires additional synthetic steps and costs, more intricate characteristics and uncertain effects in vivo alongwith greater, unknown regulatory obstacles29. Balancing the trade-off between multi-functionality and complexity is the subject of significant ongoing 1
Department of Bioengineering, University of Illinois at Urbana-Champaign, Urbana, Illinois 61801, USA. 2Electrical and Computer Engineering, Chemical and Biomolecular Engineering, Chemistry, and Mechanical Science and Engineering, Beckman Institute for Advanced Science and Technology, University of Illinois at Urbana-Champaign, Urbana, Illinois 61801, USA. ∗These authors contributed equally to this work. Correspondence and requests for materials should be addressed to R.B. (email:
[email protected]) or D.P. (email:
[email protected]) Scientific Reports | 6:29299 | DOI: 10.1038/srep29299
1
www.nature.com/scientificreports/ research as projected clinical benefits will be highly reliant on the individual selections made and their cumulative effect when designing multifunctional nanoparticles. We particularly focus on the additional steps and protocols needed to synthesize multifunctional particles as the complexity and multicomponent characteristics of nanoparticles present a large number of supplementary variables that may extensively escalate the level of difficulty in regulating processes and predictability in a biological system30. We recognize that synchronous imaging, therapy and facilitated cellular uptake are the three key deliverables for particles that are most critical and would require three properties: enhanced particle transport through the cell membrane into the cells, inclusion of a potent ligand detrimental to cancer cells, and enhanced contrast for robust detection in complex cellular environments. Further, a single moiety-based particle can mitigate several foreseen complexities associated with clinical translation i.e. variable precursor and properties, engineering of a reproducible manufacturing process, assortment of orthogonal analytical methods for ample characterization, a satisfactory pharmacological and toxicity profile, and demonstration of safety and efficacy. Our design proposed in this study focuses on the use of lycopenes or carotenoid molecules for synergistically functioning in multiple roles. Carotenoids are typically a C-40 class of terpenoid-based antioxidants with unique optical absorptive properties31. It is believed that carotenoids arose early in evolution playing an essential role as membrane stabilizers32,33 and are known to appear in most of the cellular membranes. Their cellular location and orientation largely depends on their molecular structure, polarity, dielectric properties and alterations such as hydroxylation or esterification, presenting opportunities for engineering carotenoid-based agents with specific properties. Previous studies have demonstrated that β-carotene and other nonpolar carotenoids such as lycopene tend to adopt in parallel with the membrane surface but situate deep within the lipid hydrophobic center34,35. Recognizing these properties, we hypothesized that nanoparticles carrying β-carotene functionality can be engineered to be efficiently taken up by cells compared to non-functionalized nanoparticles. Due to the presence of long chain conjugated alternating double bonds, further, the compound strongly absorbs in the visible region. Vibrational spectroscopic signals are also anticipated to be specific and large due to the presence of eight isoprene units, which are cyclized at each terminus. Owing to the presence of a large number of conjugated double bonds, β-carotene fluoresces in the visible and also exhibits intense Raman vibrational modes stemming from the backbone C=C vibrations36,37. This molecule has previously shown to exert various antioxidant38,39, anticancer40,41, and anti-metastatic42 effects in lung, breast and neuroblastoma cells. Hence, β-carotene presents a unique opportunity to use ‘multi’ dimensional properties of this single molecule. Carbon nanoparticles (CNP) synthesized from various sugar sources have been reported to exhibit remarkable optical properties such as broad band photoluminescence and intense vibrational Raman bands originating from graphitic modes rendering them easily detectable24. Figure 1A shows a hypothetical schematic portraying CNPs presenting carotenoids on the surface, inserted into the cellular phospholipid bilayer (Fig. 1B). Although many therapeutic materials have been previously incorporated within CNPs8,28, β-carotene incorporated carbon particles with multiplexing have remained largely unexplored. Many of the cancerous cells are known to be difficult for nanoparticle internalization and it makes therapy difficult through nano-delivery. To utilize the complete potential of a nanoparticle based therapeutic approach, a system can be designed equipped with an additional modality to improve cell internalization. We report passivating strategies for β-carotene on CNPs to produce colloidal carotene carbon nanoparticles (C3-NP) and their anti-proliferative effect on human cancer cells. Human melanoma (C32) and breast cancer (MDA-MB231 ER(-)) cells, were selected as model cell systems because nanoparticle internalization is difficult in these cell lines due to lack of prominent endocytotic path. C3-NP were traceable after their cellular internalization on incubation with cells in 2D cell culture and biological tissue (skin). For delivery to various cells nanoparticles with lipid membranes have been reported to play a very constructive role in cell membrane interaction43,44, mechanism of internalization45,46, and delivery of the cargo47. In line of such advantages, further, we evaluated the idea of coating C3-NP with phospholipids (Fig. 1C) using physico-chemical characterizations. We also evaluated the effect of this process in inhibiting growth of cancer cells.
Results and Discussions
Preparation of C3-NP and C3-Lipocoat. Carbon materials can be derived from macromolecules, whose
well-defined compositions, structures, and topologies provide a background for assembly into nanostructures with controlled functional properties. Very recently we have reported an alternate, commercially amenable synthetic methodology to synthesize functionalized carbon nanospheres8. For the synthesis of C3 nanoparticles, a pre-passivation and in situ synthetic methodology was adopted following the latter route. A natural carbohydrate, nectar agave, was used as an inexpensive source of carbohydrates with surface pre-passivated with β-carotene. Linear polyethyleneglycol (mPEG; Mw = 5,000 Da) was considered for an in situ passivation of as-synthesized nucleating Carbon nanoparticles (CNPs) as a control nanoparticle (passivated). The synthesis of the pristine (bare, uncapped) CNP used no passivating agents. This synthetic procedure is cost-effective and involved only a simple hydrothermal step using a commercial hot plate. In a typical synthesis, commercial grade nectar agave (batch composition; 47–56% fructose and 16–20% glucose, rest is mixture of other sugars and water) was suspended with the passivating agent (desired wt.%), purged with argon and heated for 10–20 min. β-Carotene is a non-polar compound with high degree of conjugation. The compound was made soluble in ethanol and admixed with nectar agave in 1:1, 1:2, 3:1 and 3:4 mass ratio of agave nectar to β-carotene. Other ratios were also studied but resulted in as a poor colloidal dispersion, likely due to the inadequate in situ capping of the nucleating carbon core by β-carotene. Purified C3 nanoparticles were isolated from loosely bound β-carotene molecules following a repeated dispersion and centrifugation process. For coating C3 nanoparticles with phospholipids (C3-Lipocoat), a membrane freeze thaw co-sonication method was followed using lecithin-PC as an amphiphile. Produced nanoparticles were thoroughly characterized by multiple physico-chemical techniques to study their behavior in suspended and anhydrous form.
Scientific Reports | 6:29299 | DOI: 10.1038/srep29299
2
www.nature.com/scientificreports/
Figure 1. Schematic representation of C3-NP usases. (A) Graphical representation of a multifunctional nanoparticle system in anhydrous state presenting carotene functionalities on the surface for synchronous imaging, therapy and cellular transport. (B) Schematic portraying CNPs containing carotenoids driven into the cellular phospholipid bilayer. (C) Assembly of C3-NP from molecular to nanoscale, showing the final particle of use.
Physico-chemical characterizations. Figure 2A shows the hydrodynamic diameters of as-synthesized
C3-NPs to be 44 ± 2 nm while bare-CNP was 97 ± 8 nm in size that further decreased to 25 ± 5 nm after phospholipid coatings. Likely unstable in an aqueous suspension, C3-NPs aggregate to bigger particles by bringing together other clusters of C3-NP in hydration state. On the other hand, we found that neither an increase nor a decrease in the relative mass ratio of agave nectar to β-carotene during preparation of particles generate a narrower size distribution. Thus we choose only the C3 nanoparticles prepared with a 1:1 mass ratio for further characterizations and biological studies. Pristine CNPs exhibited a shift of electrophoretic potential from −45 ± 5 mv to −20 ± 2 mv after being passivated with the hydrophobic nucleating agent β-carotene. Decrease in surface charge potential corroborates the ineptness of the C3-NPs to form stable aqueous suspensions compared to pristine CNPs. Furthermore, surface coating of phospholipid around the C3-NPs changes the zeta potential to −6 ± 1 mV (Fig. 2B) confirming the negatively charged nanoparticles. Although the charge potential decreased after phospholipid coating, C3-Lipocoat showed improved colloidal stability likely due to its enhanced degree of hydration. Anhydrous particles were studied by transmission electron microscopy (TEM) and atomic force microscopy (AFM). It showed a distribution of sizes for C3-NPs to be 32 ± 8 nm (Fig. 2C,D) very similar to the colloidal state diameter. The anhydrous sizes of phospholipid coated C3-Lipocoat NPs was found to be 20 ± 5 nm (Fig. 2E,F), slightly smaller than its hydrodynamic diameter of 25 ± 5 nm (Fig. 2A). The loss of hydration layer around lipid coating (Fig. 2G) while preparing TEM samples likely accounts for the slight decrease in size. Similar to the colloidal state, anhydrous C3-NPs were also slightly bigger than C3-Lipocoat nanoparticles. Probably, incorporation of phospholipid coating prevents C3-NPs to clump together giving smaller size on TEM sample preparation compared to more than one C3-NPs clumping together and giving a bigger size in absence of phospholipid coating (Table S1). AFM revealed the surface profile of semi-spheroidal structures from C3-NPs with height of 15 ± 5 nm (Fig. 2G,H). The ultraviolet-visible (UV-Vis) absorption spectrum of C3 and that of CNPs show strong absorption at ca. 300 nm which is the distinct signature of CNPs, whereas a weak, broad peak from 400–500 nm shown in C3 corresponding to characteristic of β- carotene (λmax = 450 nm) (Fig. 2I). The fluorescence efficiency of CNPs were found to decrease on formulating to C3-NPs with β-carotene. (Fig. 2J). C3 have two prominent peaks roughly of the same intensity, one at 443 nm and the other at 479 nm; the former matches the second intense peak of CNPs, and the latter corresponds to the most intense peak of CNPs. Noticeably, the maximal fluorescence of Scientific Reports | 6:29299 | DOI: 10.1038/srep29299
3
www.nature.com/scientificreports/
Figure 2. Physico-chemical characterization of C3-NPs and C3-Lipocoat nanoparticles. (A) Hydrodynamic diameter; (B) Zeta potential; anhydrous state size of (C,D) C3-NPs and (E,F) C3 Lipocoat nanoparticles by TEM; (G,H) height profile of C3-NPs by AFM. The spectroscopic evaluation of integral photonic properties of C3-NPs and compared to bare-CNP and β-carotene itself for (I) fluorescence properties and (J) UV-vis absorption efficiency. Properties were well compared with bare-CNP and β-carotene formulations to show the co-existence in C3 particles.
Scientific Reports | 6:29299 | DOI: 10.1038/srep29299
4
www.nature.com/scientificreports/
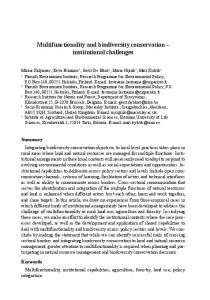
Figure 3. Characteristic Infra-red spectral features. Panel A shows the baseline corrected IR spectrum of a typical cell, C3 and C3 in cells. Spectra are offset for clarity. Panels B and C show the details of the IR spectra of the same in two different spectral regions. Characteristic spectral features of C3 are observed in cells as shown in Panel B at 1045 cm−1. Panel C displays the increase in the peak intensity ratio between ν2922 and ν2957 cm−1.
β-carotene occurs at 483 nm, which likely contributes to the diminition of fluorescent intensity of C3 at 479 nm, bringing the peaks at 443 nm and 479 nm to similar intensity. One of the β-carotene absorption peaks at 283 nm was used to calculate the amount of β-carotene loaded onto C3 NPs instead of λmax at 450 nm due to the strongly intense absorbance of CNPs, which made the difference in absorbance between CNPs and C3 indistinguishable in UV-Vis spectra. The overall loading percentages were found to be ~79% and used for the calculation of β-carotene concentration during various biological experiments. Colloidal stability of CNP, C3 and C3-Lipocoat NPs were studied by DLS measurement at various time points including 24, 48, 72, 96 and 120 h. It was found that CNP and C3-Lipocoat nanoparticles were stable without any significant variation in hydrodynamic diameter. Aqueous suspendability of CNP, C3 and C3-Lipocoat NPs was measured to be around 50, 10 and 60 mg/mL, respectably at ambient temperature. NPs were found to be stable for more than 6 months at this temperature. Suspendability of various nanoparticles in water was evaluated in comparative terms where C3 and C3-Lipocoat NPs were found to be highly dispersed in water compared to C3 NP (Table S1).
Infra-red spectroscopic characterizations. To structurally and spectroscopically characterize cells and tissue, we employ infrared (IR) spectroscopic imaging48,49. Shown in Fig. 3A are the average infrared spectra of cells (with no C3 incubation, control), C3, and cells incubated with a high concentration of C3 at 37 °C. Characteristic amide I and amide II bands are observed for both the controlled and incubated cells (blue and yellow). The fingerprint region of the C3 is broad and featureless except for a sharp peak at 1035 cm−1. Intense vibrational transitions for free β-carotene molecules are reported at ~966 cm−1 that arise from the deformation vibrations of the skeletal C-H bonds50. Weaker transitions are also observed at 1040 cm−1 that also results C-H deformation vibrations along with methylene (CH2) vibrations. The chemical nature of the passivation of the β-carotene molecules in the C3s suppresses these vibrational modes significantly (Fig. 3B) and intensifies the one at 1040 cm−1. An analysis of the infrared spectra of the cells incubated with high concentration of C3 revealed features (Fig. 3B yellow) that exhibit features similar to the C3 and cells taken together. However, the sharp feature Scientific Reports | 6:29299 | DOI: 10.1038/srep29299
5
www.nature.com/scientificreports/ of the C3 is red shifted to 1035 cm−1 due to binding with the cells. At low C3 concentrations and lower temperatures this characteristic peak is not observed in the IR spectra of the cells as the broad absorption of the phosphite (PO2−) peak and nucleic acids at 1080 cm−1 overwhelms any weak feature from the C3s in this region. Thus, we shift our focus to the C-H stretching region to assess the distribution of these particles over the cells at various conditions. In all the 3 spectra shown in Fig. 3C, we notice the presence of asymmetric CH3 (ν2957), CH2 (ν2922) and symmetric CH3 (ν2870), CH2 (ν2850) vibrations51. However, their peak ratios are remarkably different. For instance in the case of C3, the ratio of the asymmetric CH2 (~ν2920) stretch to symmetric CH3 (~ν2870) stretch modes is close to 1, while the same ratio is much greater than 1 for cells with or without the C3. We assign the main C3 peak at 2925 cm−1 to be originating from the C-H stretching vibrations of the C3 system (νC3) and its presence in cells will have an additional contribution at the same frequency. Thus, we expect the intensity ratio of the ν2925 band with any neighboring band will to increase when C3 is taken up by the cells. We calculated the pixel values of each of the IR images by taking the ratio of the band absorbance at 2922 and 2958 cm−1 from the spectrum of that pixel. Figure 4 shows the images of the absorbance ratio and the average IR spectra for five different conditions: (i) Cells without C3, (ii) Cells incubated with low concentration of C3 at 4 °C, (iii) same as the 2nd condition but at 37 °C, (iv) Cells incubated with high concentration of C3 at 4 °C, (v) same as 4 but at 37 °C. The ratio distribution is almost homogeneous for cells without any C3 and rages from 1 to 1.2. In the 2nd and the 4th case when cells are incubated with C3 at 4 °C and 37 °C respectively, we observe higher ratio at the edges compared to the center. While this might arise from scattering, the close wavelengths used to calculate our ratio are unlikely to result in substantial scattering effects52–54 or band shifts. While the average intensity at the center of the cells in case 2 compares well with the cell image in case 1, case 4 shows a rise in the intensity even at the center of the cells. However, at 37 °C for both low and high concentrations of C3 (Case 3 and 5), we observe the absorbance ratio to rise to almost 2 both inside and at the cell edges. We attribute this change in intensity to the presence of the C3 taken up by the cells. β-carotene is known to be internalized by cells and express their therapeutic activities38–42 and likely facilitating the entry of carbon nanoparticles into the cells. At low temperature and lower concentrations they stick to the cell membranes as the uptake mechanism is not fully functional. But we do find a positive correlation between the uptake and concentration of C3 at low temperature. At 37 °C the cells uptake C3 readily and increasing the C3 concentration subjects the cell to perish faster as evident from the cell morphologies and cell viability studies.
Raman spectroscopic characterizations. While infrared spectroscopy and imaging measure vibrational absorption55, Raman spectroscopy is a scattering process that depends on the polarizability tensor and is much weaker but is important to use here to understand the carbon skeletal contributions in the particles. Shown in Fig. S1A,B are the Raman spectra of cells (no C3), β-carotene (powder), C3 and C3 in cells. The wavelength axes are separated for clarity. Raman spectra of the cells by themselves are different from the IR spectra as the amide I and II modes collapse to an asymmetric broad band centered at 1650 cm−1. Strong modes at ~1450 cm−1 and 2923 cm−1 are observed that results from CH2 scissoring and asymmetric stretch vibrations. β-carotene displays 4 strong characteristic peaks at 1010 cm−1, 1185 cm−1, 1513 cm−1 and 3025 cm−1 resulting from ν(CH3), νC-C, νC=C and νC-H vibrations respectively51. C3 nanoparticles display two different kinds of Raman spectra depending on their concentration on coverslips. At low concentrations (green) they display three of the same features (ν (CH3), ν C-C, ν C=C) of that of β-carotene (blue) with a thermal oscillation. We find the ν C=C mode in the C3 to redshift by 8 cm−1 to 1521 cm−1 that can be due to covalent interactions between the β-carotene and carbon nanoparticles. At higher concentrations the Raman spectra almost matches that of amorphous Carbon with characteristic G and D bands56 along with thermal oscillations. These oscillations are more evident in the 3 micron region of the spectrum where it overwhelms any C-H vibrational features (not shown for the aggregated C3). The excitation wavelength of the laser is set to 532 nm that is close to π−π* transition of the carbon nanoparticles thereby triggering an almost electronic resonance condition and releasing heat, which affects the Raman spectra. If the excitation wavelength is changed to 633 nm or lower these oscillations are not observed. Shown at the bottom of Fig. 5 (M and N) are representative Raman spectra of cells incubated with high concentration of C3. We observe that the spectrum exhibits similar features of cells (1650 cm−1, 1450 cm−1 and 2923 cm−1) and C3 ν (CH3), ν C-C, ν C=C). Since the presence of both the localized and aggregated C3 is evidenced through the Raman feature at 1520 cm−1 and cells from 2920 cm−1, we use these two bands to distinguish one from the other in the Raman images. We measured Raman images of cells under the same conditions as the IR studies. For each of these five cases, Raman images were constructed by calculating pixel intensities for each image in the following way. The 1st image integrated the band intensities for the C-H vibrations and the 2nd one integrated the C3 intensities. While the C-H intensities are plotted against a color bar, C3 intensities are false-colored in red on them. As expected the Raman image of the cells display no contribution from the C3s. The images for 4 °C show more uptake of the C3 inside the cells than the IR study. However, at 37 °C the red regions dominate the image showing the extent of their uptake by the cells. At higher concentrations we see the morphology of the cells to change with the presence of a channel of C3 particles between two cellular regions. In vitro cell studies. The cell growth inhibition property of C3 was evaluated against two human can-
cer cell lines C32 (melanoma) and MDA MB 231 (breast cancer) cells by a 3-(4, 5-dimethylthiazole-2-yl)-2, 5-diphenyltetrazolium bromide (MTT) assay (Fig. 6A–F). Cells were incubated with controls of CNPs, 1% of dimethyl sulfoxide (DMSO), β-carotene, C3 and C3-Lipocoat NPs for 48 and 72 h at β-carotene concentrations of 125, 62.5, 31.25, 15.6 and 7.8 μM and their equivalence in samples without β-carotene. It was found that neither CNPs nor 1% of DMSO induced significant cytotoxicity in any of the used cell lines at up to highest used concentration (not shown). The cell growth regression showed that order of efficiency followed the pattern of best to minimum efficiencies in C3-Lipocoat, C3 and β-carotene at 48 h of incubation (Fig. 6A,B). A significant decrease Scientific Reports | 6:29299 | DOI: 10.1038/srep29299
6
www.nature.com/scientificreports/
Figure 4. Infra-red cellular imaging. IR images of the cell and C3 incubated in cells for 5 cases as mentioned in the rows. (A,D,G,J,M) Show the average, baseline corrected IR spectra with the variance, while two separate images corresponding to each of the conditions are displayed in the rest. The intensity of each pixel is calculated as the ratio between 2922 and 2958 cm−1 band.
Scientific Reports | 6:29299 | DOI: 10.1038/srep29299
7
www.nature.com/scientificreports/
Figure 5. Raman cellular imaging. (A,C,E,I,K) Display the bright field images of breast cancer cells incubated with C3 at 5 different conditions. Raman images of the same regions are shown in (B,D,F,J,L) respectively. The C-H region intensity is plotted in the adjacent color bar while the C3 intensities are false-colored in red. Representative Raman spectra are also shown for cells only and cells incubated with C3 in M and N. Since the C-H region is not affected by C3, it is used to isolate cellular regions, while the Raman spectra of the CNPs are used to isolate the C3s.
Scientific Reports | 6:29299 | DOI: 10.1038/srep29299
8
www.nature.com/scientificreports/
Figure 6. In vitro cellular studies. MTT assay for the evaluation of cytotoxic effects of β-carotene in free or passivated to CNPs with post coatings of amphiphilic phospholipidic assembly. Experiment was performed in (A,C) MDA-MB231 breast cancer and (B,D) C32 melanoma cells after incubation for (A,B) 48 and (C,D) 72 h at various concentrations (125, 62.5, 31.25, 15.6125, 7. 8 and 3.9 μM) of β-carotene in free or form of C3 nanoparticles and C3-Lipocoat nanoparticle formulations. (E) Comparative IC50 values of used formulations and (F) fold change across both the cell lines. Statistical analysis performed using Two-way ANOVA on IC50 values represented as ***for p