UVA Center for Wireless Health, University of Virginia, Charlottesville, VA 22904, USA. {lq7c ..... outgoing calls), and thus are used in our system to monitor.
Multi-Modal In-Person Interaction Monitoring Using Smartphone and On-Body Sensors Qiang Li, Shanshan Chen, John A. Stankovic UVA Center for Wireless Health, University of Virginia, Charlottesville, VA 22904, USA {lq7c, sc2xh, stankovic}@virginia.edu Abstract—Various sensing systems have been exploited to monitor in-person interactions, one of the most important indicators of mental health. However, existing solutions either require deploying in-situ infrastructure or fail to provide detailed information about a person’s involvement during interactions. In this paper, we use smartphones and on-body sensors to monitor in-person interactions without relying on any in-situ infrastructure. By using state-of-art smartphones and on-body sensors, we implement a multi-modal system that collects a battery of features to better monitor in-person interactions. In addition, unlike existing work that monitors interactions only based on data collected from one person, we emphasize that in-person interactions intrinsically involve multiple participants, and thus we aggregate information from nearby people to identify more interaction details. Evaluation shows our solution accurately detects various in-person interactions and provides insights absent in existing systems.
I.
I NTRODUCTION
According to the Department of Health and Human Services [1], the population of 65 and over in the US will increase from 40 million to 55 million between 2010 and 2020, a more than 30% increase during the decade. However, 15%-20% of senior people have significant depressive symptoms [2]. Many studies show that the lack of in-person interactions plays an important role in the initialization and development of depression [3] and is one of the most important indicators of physical and mental health in aging patients [4]. Therefore, inperson interaction monitoring is of great importance, because it enables psychiatric clinicians and geriatric professionals to perform more accurate diagnosis and treatment of psychological problems for elderly people. Plenty of existing work targets people’s daily activities, but they are not well poised to detect in-person interactions, because: 1) most activity detection methods such as [5] use very limited types of sensors, usually only accelerometers, and lack the multitude of sensing modalities needed to detect rich interactions between people; 2) existing solutions such as [6]–[9] detect human interactions solely based on data collected from one person, and ignore the involvement of multiple participants, which is the intrinsic nature of in-person interactions. These problems limit existing systems from extracting inperson interaction details such as the involvement of a person in a conversation. Yet this detailed information is critical for psychiatrists or caregivers to monitor and assess people’s mental health, as indicated in gerontological studies [3], [10]. To overcome these limitations, in this paper, we propose a multi-modal in-person interaction monitoring system using
smartphones and on-body sensors. Our system first detects seven kinds of primitives from all participants interacting with each other: activities of subjects, proximity information, presence of speech, speech volume analysis, GPS coordinates, phone call records, and calendar events. By analyzing these primitives, our system detects details about interactions. Our system suits best for facilities such as nursing homes where it can be deployed to all people and primitives from all participants of an interaction can be collected. It can also be used when people interacting with the subject do not have our system, because primitives collected from the subject such as activities, speech, and GPS are already sufficient to detect many interactions such as dining out though with less details. Moreover, unlike some existing work [4], [11] requiring deployment of environmental sensors, our system only uses smartphones and optionally on-body sensors to detect inperson interactions. This significantly improves the mobility and thus practicality of our system, since many interactions of interest such as dining with others happen where environmental sensors are unavailable. II.
R ELATED W ORK
Existing work on in-person interaction monitoring can be divided into two categories according to whether ambient sensors are used or not. In the first category, only on-body sensors, such as GPS, accelerometers, microphone, and camera, are used. CenceMe [8], [9] developed by Emiliano et al. automatically detects activities of individuals and shares the sensing results through social networks such as Facebook. In their work, various types of data such as location, acceleration, and audio signals are collected by sensors on mobile phones. SoundSense [7] developed by Hong Lu et al. distinguishes speech from music and ambient sound. Besides microphones, cameras are also used to detect social interactions. Pierluigi at al. [12] build a badge which includes a triaxial accelerometer and a JPEG camera. The camera is used to detect the presence of other people, which is an indicator of in-person interactions. Solutions in the second category use ambient sensors to understand interactions of multiple people. Datong et al. [4] place four video cameras and audio collectors in public areas including the dining room, living room and hallway. By analyzing collected audio/video signals, their work can detect high-level social interactions such as greeting, standing conversation, and walking together. Diane et al. [11] detect interactions in a smart home which is equipped with motion sensors distributed about every meter throughout the space.
TABLE I: The average value and standard deviation of θ and a ˆy for different postures. Posture Standing Sitting Lying
mean(θ) 7.28◦ 71.77◦ 13.58◦
std(θ) 2.81 3.64 1.78
mean(ˆ ay ) 1.07g 1.01g −0.07g
std(ˆ ay ) 0.01 0.01 0.10
phone also functions as a data aggregator for TEMPO nodes. The hardware platform is shown in Fig. 2a. The mobile app user interface is shown in Fig. 2b. B. Primitives
(a)
(b)
Fig. 2: System platform: (a) hardware; (b) mobile app user interface.
Solutions using on-body sensors, either use very limited types of sensors such as SoundSense, or fail to collect and utilize data from multiple participants such as CenceMe. The main problem with the second category of solutions is that they require environmental sensors deployed, which severely limits the applicability of the solutions. In addition, privacy is a major concern for solutions using cameras. Considering the prevalence of personal sensing devices, Paul et al. [13] discussed possibilities of socially aware computing, in which every device not only performs its own task, but also collaborates with each other to monitor and analyze social interactions. Brett et al. [6] equipped each subject with a GPS, and then determined how they spent time at the same location together. But their work can only provide general information on proximity of people. III.
M ULTI -M ODAL I N -P ERSON I NTERACTION M ONITORING S YSTEM
To overcome the shortcomings of existing solutions, we employ a multi-modal system to detect in-person interactions with detailed involvement information. The framework to detect in-person interactions is shown in Fig. 1. The techniques employed in the framework is detailed below. A. Platform Inertial sensors (TEMPO nodes [14]) and a smartphone (HTC One V) are used in our social interaction detection system. The TEMPO nodes are attached to the chest and thigh to monitor the motion and posture of the body, collecting acceleration data at a sampling rate of 120Hz — sufficient to capture the characteristic response of human activities. The HTC One V phone records audio signals around the subject, detects the proximity of other people, and collects GPS coordinates, calendar events, and phone call records. The
From data collected our system calculates seven kinds of primitives to detect in-person interactions. These primitives are: 1) activities of subjects, including static postures (standing, sitting, and lying) and dynamic movements; 2) the proximity information of nearby BSNs; 3) the presence of speech; 4) speech volume analysis during clear speech; 5) location information from GPS coordinates; 6) phone call records; 7) calendar events. 1) Activity: In activity detection, first we determine whether a person is dynamically moving or statically posturing (dynamic vs. static) according to the variation of accelerations. If the person is staticcaly posturing, we use accelerations from TEMPO nodes to determine specific static postures: standing, sitting, or lying. To distinguish specific static postures, we calculate the angle between the trunk and thigh, θ, using Equation (1), where a ˆ and a are the acceleration readings from chest and thigh, respectively.
θ=
180 a ˆx ax + a ˆy ay + a ˆ a q z z arccos( q ) π a ˆ2x + a ˆ2y + a ˆ2z · a2x + a2y + a2z
(1)
Table I, which is obtained from three subjects performing static postures multiple times, shows the value of θ and a ˆy (gravitational vector at chest) for different postures. Then we can distinguish standing (θ < 45◦ , a ˆy > 0.5g), sitting (θ > 45◦ , a ˆy > 0.5g), and lying (θ < 45◦ , a ˆy < 0.5g). To make our system more flexible, when TEMPO nodes are not present, our system automatically uses the accelerometer on the smartphone to distinguish dynamic vs. static. The system is easier to wear and deploy by excluding TEMPO nodes, but it also makes activity detection results unreliable since people do not always keep their phones at the same position. In addition, without TEMPO nodes our system does not distinguish specific static postures (standing, sitting, and lying), which are critical to detect specific kinds of interactions, e.g. it is an important feature of meetings that multiple people sit near to each other. 2) Proximity: Most radio devices provide Received Signal Strength Indicator (RSSI), which can be used to adequately estimate the distance between nodes when they are within several meters of each other , hence we use RSSI to detect proximity. In our system, we use the Bluetooth radio on the
Fig. 1: The framework to detect social interactions. TABLE II: Pre-measured RSSIref and n for typical indoor and outdoor environments. Environment Indoor Outdoor
mean(RSSIref ) −61.56 −83.89
std(RSSIref ) 3.08 3.46
3) Speech Detection: In our system, we classify audio signals recorded by a smartphone microphone into three categories: clear speech, speech in noise, and other sounds. The classification is based on audio features mentioned in [16].
n 2.51 1.35
smartphone to detect the presence and estimate the distance of other BSNs in the vicinity. The relation between distance and RSSI is described in Equation (2) [15], in which d is the transmitter-receiver distance, n is the attenuation constant, Xσ is a zero-mean Gaussian with standard deviation σ (multipath effects), and RSSIref is the RSSI value at reference distance dref . � RSSI = RSSIref − 10nlog10
d dref
� + Xσ
RSSIref −RSSI 10n
We extract eight features divided to 3 groups from recorded audio signals. They are: •
Amplitude modulation features: width, m1, m2, m3. width characterizes the modulation depth in the signal. m1, m2, m3 are the modulation depth for the modulation spectra of the signal envelope in three modulation frequency ranges: 0-4Hz, 4-16Hz, and 1664Hz.
•
Spectral profile features: CGAV (spectral center of gravity), CGF S (fluctuations of the spectral center of gravity). CGAV and CGF S describe static and dynamic spectral profile, respectively.
•
Harmonicity features: tonality is the ratio of to inharmonic (pitch is pitchvar is the variance
(2)
Usually n and σ are obtained through curve fitting of empirical data, but commonly we can assume Xσ to be 0 and distance can be obtained via Equation (3), in which RSSIref is measured at dref = 1m. d = 10
we consider BSNs within 3 meters potential participants of an interaction.
(3)
According to Equation (3), we need to do measurements to determine RSSIref and n to extract exact distance from RSSI. However, since we only need rough estimation of proximity when detecting in-person interactions, using pre-measured RSSIref and n are sufficient. Table II shows RSSIref and n we measured for typical indoor and outdoor environments for up to 3 meters. By extracting proximity information from Bluetooth radio, our system not only discovers nearby BSNs, but also roughly estimates their distance to the subject. Distance estimation is important because to monitor an interaction, we need to determine whether a BSN is a participant or not. In our system,
tonality and pitchvar. harmonic (pitch is present) absent) parts in the sound. of pitch.
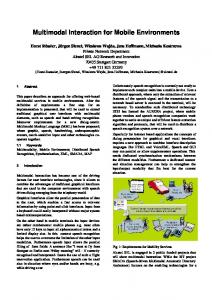
In our system, all features above are extracted on the smartphone in real-time every second. Using these features and bagged tree classifier, our system can detect 93.23% of clear speech and 85.85% of speech in noise. By accurately detecting both clear speech and speech in noise, our system provides a much more comprehensive picture of verbal communication comparing to existing work such as CenceMe [8], [9], which can only detect clear speech. 4) Speech Volume Analysis: For clear speech, we perform volume analysis to determine who is speaking. When one person is speaking, all mobile phones on the subject and nearby persons record the speech. By comparing their volume, we can figure out who is speaking, because the volume from the person speaking is larger than that on all other persons. However, this may not be true when there are noises around, therefore sound
Dynamic Static
Dynamic 91.19% 2.53%
Static 8.81% 97.47%
TABLE III: Confusion matrix for detecting static postures and dynamic movements using phone accelerometers.
Lying Standing Sitting Dynamic
Recall 95.92% 96.81% 96.71% 100%
Precision 100% 98.89% 99.69% 87.19%
TABLE IV: Results of detecting dynamic movements and specific static postures including standing, sitting, and lying using TEMPO nodes. Fig. 3: Conversation volume analysis when three people are talking with each other. classification mentioned in the previous section is necessary to make sure that volume analysis is only performed for clear speech. Fig. 3 illustrates the scenario when three people are talking with each other. When A speaks, phones of A, B, and C all record the voice signal. Since the volume recorded by A is larger than that recorded by B and C, we can detect that A is speaking. 5) GPS, Call Records, Calendar: The GPS data collected from mobile phones is very effective to detect some kinds of social interactions such as dining out, going to sport events or movies. Phone call records contain information such as the time, duration, caller (for incoming calls) or callee (for outgoing calls), and thus are used in our system to monitor the subject’s interactions with others over their smartphones. A calendar entry consists of the time, location, and name of an event. C. In-Person Interaction Detection Each primitive discussed in the previous section provides basic components to analyze in-person interactions. However, one single primitive can hardly give enough details. For example, through GPS the subject can be located in an office building, but it is hard to know if the person is involved in any kind of in-person interactions such as talking with others.
These examples show how multi-modal sensing helps extract details of in-person interactions. For example, instead of just detecting the “meeting” event, our system also evaluates the involvement of the subject into the meeting by using volume analysis to detect times and length the subject spoke. Similarly, by using the primitive of proximity, our system does not only detect “dining out” or “exercise”, but also detects if the subject is doing these activities with others. IV.
E VALUATION
We perform two types of tests to evaluate our system: component tests and integration tests. Component tests are used to verify primitives, while integration tests are used to evaluate the effectiveness of the whole system to detect inperson interactions. A. Component Test 1) Activity Detection: Our system detects activities in two levels of granularity: use the accelerometer on the smartphone to distinguish dynamic and static activities, or when TEMPO nodes are used, we detect specific postures including standing, sitting, and lying. To evaluate the performance of our activity detection method, each of four subjects wear our system and performs various daily activities for 10 to 15 minutes. We use a camera to capture video of the subjects as the ground truth.
Therefore, we adopt a multi-modal approach to detail inperson interactions: in our system, every in-person interaction is semantically defined using the vocabulary of primitives. Three in-person interactions are listed below to demonstrate how they are defined using a combination of primitives: •
Meeting: speech detection (clear speech) + proximity (multiple people are nearby) + activity (sitting posture) + volume analysis (how many times and how long the subject speaks).
•
Dining out: GPS (in a restaurant) + proximity (there are people nearby) + speech detection (speech in noise)
•
Exercise: activity (dynamic) + GPS (in a gym) + proximity (there are people nearby)
Fig. 4: Activity detection results using TEMPO nodes.
Indoor
Outdoor
d (m) 1 2 3 1 2 3
mean(dm ) (m) 1.06 1.93 2.51 1.05 2.15 2.73
std(dm ) (m) 0.14 0.19 0.29 0.22 0.37 0.55
TABLE V: Distance estimated using RSSI: d is real distance, dm is measured distance. Tab. III shows the confusion matrix of using the accelerometer on a smartphone to distinguish static postures from dynamic movements. During these experiments, the smartphone was put into a trousers pocket, where people usually keep their phones, and the accuracy is higher than 90%. However, when people make calls or hold their phones in the hand, the phone accelerometer can no longer be used to detect activities. Therefore, our system also utilizes on-body sensors. Using TEMPO nodes as described in Sec. III-A, our system correctly detects more than 95% of various static postures and dynamic activities as shown in Tab. IV. Most of errors happen when subjects move their legs while standing, sitting, or lying. In this case, our system detects dynamic activities instead of static postures, and hence the precision for the dynamic case in Tab. IV is relatively lower than others. Figure 4 shows the activity detection results using two TEMPO nodes as the subject sits, walks, lies down, walks, sits, stands, and then sits again. It also shows that the majority of misclassification is caused by regarding static postures as dynamic activities. 2) Proximity Information: Proximity information of other BSNs is retrieved through Bluetooth discovery service. Each smartphone tries to discover all nearby neighbors every 5 seconds. The process provides two levels of proximity information: 1) it detects the presence of a neighbor; 2) using the RSSI values collected, our system can approximate the distance between a neighbor and the subject. To test the accuracy of estimating distance using RSSI, two subjects stand 1m, 2m, and 3m away from each other in both indoor (office and house) and outdoor environments. Tab. V shows the results of estimating distance according to Equation (3). Though the channel condition changes constantly, the average of measured distance dm veritably corresponds to real distance d. The variance of dm caused by channel condition changes makes it hard to estimate d accurately when two BSNs are only in the vicinity for a short period of time. However, since effective in-person interactions like meetings usually last more than one minute, our system is still able to extract proximity information reliably. 3) Speech Detection: To evaluate the our speech detection method, 6 subjects recorded 100 minutes of audio data to train the classifiers: 50 minutes of clear speech, 20 minutes of speech in noise (the ambient noise is from street and supermarket), and 30 minutes of ambient noise from a walking street and a supermarket. Then seven of the eight features described in Sec. III-B3 are automatically selected to achieve the best performance for each classifier. The features selected are: width, m1, m2, m3, CGAV , CGF S, and tonality. The classifiers used include Naive Bayes, Discriminant, Boosted Tree, and Bagged Tree.
Fig. 5: Directional turn-takes and length of speech during a meeting of 3 subjects A, B, and C. Numbers in parentheses are the ground truth obtained from manually labeled data. Tab. VI shows the classification results. Among all classifiers, Discriminant is the easiest to implement and can achieve around 88% overall accuracy. Bagged Tree achieves best results in terms of sensitivity (recall), precision, and overall accuracy of 92.37%. Speech in noise is most difficult to correctly identify, because it is usually misclassified as clear speech when noise level is too low, or as noise when speech volume is too low. 4) Volume Analysis: How often and how long one speaks indicate the involvement during interactions with others. However, existing work fails to provide this information because it is difficult to identify the speaker only using the microphone on one single BSN. By sending volume recorded by each BSN to the back end server and detecting clear speech, our system is able to detect who is speaking. Fig. 5 shows the directional turn-takes of conversations between 3 subjects A, B, C, and the speech time of each subject. During the experiment, three subjects talk with each for 13 minutes. The conversation is recorded and manually labeled as ground truth. Our results show that A, B, and C each speak for 377s, 284s, and 124s, respectively, which are very close to the ground truth of 351s, 256s, and 150s. Also there are 55 times (against the ground truth of 45 times) that C starts talking after A. These information provides details about the involvement during a conversations, and thus indicates the quality of the interaction. Most errors are caused by two reasons: 1) there are rare times two or more subjects speak at the same time, and in this case, relative volume cannot correctly identify the speaker; 2) ambient noise can also change relative volume levels, and thus invalidates the results. Therefore, as described in Sec. III-B4, we only analyze the volume data of clear speech. B. Integration Test After evaluating each primitive, this section demonstrates how the multi-modal system provides more details of in-person interactions. Three typical interactions are studied: meeting, dining out, and exercising at a gym. More details about these activities can be detected by using different primitives: •
Meeting with colleagues: GPS (office building) + proximity (BSNs discovered) + activity (sitting) +
Classifier
Accuracy (%)
Naive Bayes Discriminant Boosted Tree Bagged Tree
88.08 88.98 87.27 92.37
Speech Recall (%) Precision (%) 92.05 95.13 93.13 91.73 87.55 94.85 93.23 95.74
Speech in Noise Recall (%) Precision (%) 73.08 67.71 73.96 72.27 78.84 58.18 85.85 78.08
Recall (%) 89.78 91.14 90.75 94.62
Noise Precision (%) 88.73 94.93 92.64 95.62
TABLE VI: Classification resutls for the four classifiers. Simple classifiers such Naive Bayes and Discriminant achieve about 88% accuracy, which can be improved to more than 92% using the more complicated Bagged Tree classifier. Activity Meeting with colleagues Meeting with and talking to colleagues Dining out Dining out with friends Dinning out and talking with friends Exercising in a gym Exercising in a gym with friends
Recall (%) 92.32 85.64 100 100 82.91 100 88.62
Precision (%) 94.31 88.14 100 100 75.41 100 100
TABLE VII: Results of using multi-modal sensing to detect more details about interactions. •
• • •
• •
speech detection (clear speech) Meeting with and speaking to colleagues: GPS (office building) + proximity (BSNs discovered) + activity (sitting) + speech detection (clear speech) + volume analysis (the subject is speaking) Dining out: GPS (restaurant) Dining out with friends: GPS (restaurant) + proximity (friends’ BSNs discovered) Dining out and talking with friends: GPS (restaurant) + proximity (friends’ BSNs discovered) + speech detection (speech in noise) Exercising in a gym: GPS (gym) Exercising in a gym with friends: GPS (gym) + proximity (friends’ BSNs discovered)
Table VII shows the experiment results of integration tests. We collect data on two people meeting and three people meeting for about half an hour. Four people dine out 3 times to collect dining data. Exercising data is collected when two people played table tennis. Though the accuracy of interaction detection becomes lower with requesting more details according to Table VII, our system still achieves accuracy of more than 80%.
R EFERENCES [1] [2]
[3]
[4]
[5]
[6]
[7]
[8]
[9]
[10]
[11]
V.
C ONCLUSIONS
In this paper, we propose a multi-modal way to detect inperson interactions using smartphone and on-body sensors. This multi-modal way enables our system to extract more details about in-person interactions. The component tests and integration tests demonstrate the practicality and accuracy of our system. In the current system, in-person interactions are defined semantically by the combination of primitives. In the future, by combing the calendar events and other primitives, our system can be improved to automatically discover patterns of new kinds of in-person interactions. VI.
ACKNOWLEDGEMENTS
This paper was supported, in part, by NSF grants CNS1035771 and EECS-0901686. The authors would also like to thank John Lach’s group from ECE department, University of Virginia for providing TEMPO nodes.
[12]
[13]
[14]
[15] [16]
Administration on Aging, “A profile of older americans: 2009,” U.S. Department of Health and Human Services, Tech. Rep., 2010. J. J. Gallo and B. D. Lebowitz, “The epidemiology of common latelife mental disorders in the community: Themes for the new century,” Psychiatric Services, vol. 50, no. 9, pp. 1158–1166, Sept. 1999. S.-I. Hong, L. Hasche, and S. Bowland, “Structural relationships between social activities and longitudinal trajectories of depression among older adults,” The Gerontologist, vol. 49, no. 1, pp. 1–11, 2009. D. Chen, J. Yang, R. Malkin, and H. D. Wactlar, “Detecting social interactions of the elderly in a nursing home environment,” ACM Transactions on Multimedia Computing, Communications and Applications, vol. 3, no. 1, pp. 1–22, Feb. 2007. Z. Y. He and L. W. Jin, “Activity recognition from acceleration data based on discrete cosine transform and svm,” in Proceedings of the 2009 IEEE International Conference on Systems, Man and Cybernetics, San Antonio, TX, USA, Oct. 2009, pp. 5041–5044. B. Adams, D. Phung, and S. Venkatesh, “Sensing and using social context,” ACM Transactions on Multimedia Computing, Communications and Applications, vol. 5, no. 2, pp. 11:1–11:27, Nov. 2008. H. Lu, W. Pan, N. D. Lane, T. Choudhury, and A. T. Campbell, “SoundSense: Scalable sound sensing for people-centric applications on mobile phones,” in Proceedings of the 7th International Conference on Mobile Systems, Applications, and Services (MobiSys’09), Krak´ow, Poland, June 2009, pp. 165–178. E. Miluzzo, N. D. Lane, S. B. Eisenman, and A. T. Campbell, “CenceMe - injecting sensing presence into social networking applications,” in Smart Sensing and Context, ser. LNCS, 2007, vol. 4793, pp. 1–28. E. Miluzzo, N. D. Lane, K. Fodor, R. Peterson, H. Lu, M. Musolesi, S. B. Eisenman, X. Zheng, and A. T. Campbell, “Sensing meets mobile social networks: The design, implementation and evaluation of the CenceMe application,” in Proceedings of the 6th ACM Conference on Embedded Network Sensor Systems (SenSys’08), Raleigh, NC, USA, Nov. 2008, pp. 337–350. G. Hubbard, S. Tester, and M. G. Downs, “Meaningful social interactions between older people in institutional care settings,” Aging and Society, vol. 23, no. 1, pp. 99–114, 2003. D. J. Cook, A. Crandall, G. Singla, and B. Thomas, “Detection of social interaction in smart spaces,” Cybernetics and Systems, vol. 41, no. 2, pp. 90–104, Feb 2010. P. Casale, O. Pujol, and P. Radeva, “Face-to-face social activity detection using data collected with a wearable device,” in Proceedings of the 4th Iberian Conference on Pattern Recognition (IbPRIA’09), P´ovoa de Varzim, Portugal, June 2009, pp. 56–63. P. Lukowicz, A. S. Pentland, and A. Ferscha, “From context awareness to socially aware computing,” Pervasive Computing, vol. 11, no. 1, pp. 32–41, Jan. 2012. A. T. Barth, M. A. Hanson, H. C. P. Jr., and J. Lach, “Tempo 3.1: A body area sensor network platform for continuous movement assessment,” in Proceedings of the 2009 6th International Workshop on Wearable and Implantable Body Sensor Networks (BSN’09), Berkeley, CA, USA, June 2009, pp. 71–76. M. van de Goor, “Indoor localization in wireless sensor networks,” Master’s thesis, Radboud University Nijmegen, 2009. M. B¨uchler, S. Allegro, S. Launer, and N. Dillier, “Sound classification in hearing aids inspired by auditory scene analysis,” EURASIP Journal on Applied Signal Processing, pp. 2991–3002, 2005.