1
Multi-objective Optimization of Power System Performance with TCSC Using the MOPSO Algorithm Sara Mollazei, Malihe M. Farsangi, Hossein Nezamabadi-pour, and Kwang Y. Lee, Fellow, IEEE
Abstract— In this paper, Multi-objective Particle Swarm Optimization (MOPSO) Algorithm is used to find the optimal location of Thyristor Controlled Series Compensator (TCSC) and its parameter in order to increase Total Transfer Capability(TTC), reduce total transmission losses and reduce voltage deviation. This multi-objective optimization problem is solved by using the MOPSO with sigma method and encouraging results are obtained. Index Terms— Multi-objective optimization, multi-objective particle swarm optimization, sigma method, TCSC, TTC.
I. INTRODUCTION
T
TC is a terminology that is the largest value of electric power that can be transferred over the interconnected transmission network in a reliable manner without violation of specified constraints. Flexible AC Transmission system (FACTS) devices have potential impact on TTC. FACTS devices, which can provide direct and flexible control of power transfer, can be very helpful in the operation of power networks. TCSC as an effective series compensation device can be used for adjusting the limitation created by generation and transmission systems.
Different mathematical methods and algorithms have been developed for calculating TTC [1]-[6]. Also, various heuristic
approaches have been adopted by researches including genetic algorithm, evolutionary programming and particle swarm optimization [7]-[9] to enhance TTC by placing the FACTS devices. Kennedy and Eberhart introduced the Particle Swarm Optimization (PSO) method as an evolutionary computation technique [10]. The original version of the PSO operates in continuous space [10] was extended to operate on discrete binary variables [11]. The PSO has been proven to be very effective for static and dynamic optimization problems. However, to solve some problems, different objective functions have to be considered where these objectives cannot be typically met by a single solution. Therefore, the researchers are motivated to extend the PSO technique to multi-objective optimization [12]-[18] known as MultiS. Mollazei, M. M. Farsangi and Hossein Nezamabadi-pour are with Kerman University, Kerman, Iran. (e-mail:
[email protected],
[email protected],
[email protected]). K. Y. Lee is with the Department of Electrical Engineering, The Pennsylvania State University, University Park, PA 16802, USA (e-mail:
[email protected]).
1-4244-1298-6/07/$25.00 ©2007 IEEE.
objective Particle Swarm Optimizer (MOPSO). By adjusting the different objectives, the MOPSO seeks to discover what possible combinations of these objectives are available and then the best solutions can be found. Especially when different objectives are conflicting one another, the MOPSO method can find good trade-off solutions that represent the best possible compromises among the objectives. The multi-objective optimization problem has been the subject of many power system problems, and approached with different methods, such as analytic method with weighted sum [19], learning automata [20], and heuristic methods such as PSO [21] and Vector Evaluated PSO (VEPSO) [22]. In view of this, this paper investigates the applicability of MOPSO in placing TCSC in a power system considering different objectives such as increasing TTC, reduction of total transmission losses and reduction of voltage deviation. The paper is organized as follows: to make a proper background, the multi-objective optimization is briefly explained in Section II. Section III presents the basic concepts of the MOPSO. The multi-objective optimization problem is formulated in Section IV. The results of the MOPSO in a study system are given in Section V and some conclusions are drawn in Section VI. II. MULTI-OBJECTIVE OPTIMIZATION A multi-objective optimization problem can be defined as follows: minimize
{ f1 ( X ), f 2 ( X ),..., f m ( X )}
(1)
subject to, X ∈T where m ≥ 2 . The objective functions f i ( X ) : R n → R are conflicting one another and the aim is optimizing them simultaneously (without loss of generality it is assumed that the objectives are to be minimized). The decision vectors X = ( x1 , x2 ,..., xn )T belong to the feasible region (for decision vectors X ) T ⊂ R n which is formed by the constraints. The feasible region (for objective functions f ) is denoted by H ⊂ R m and is called as feasible objective region. The elements of H are called objective vectors and they consist of objective (function) values f ( X ) = ( f1 ( X ), f 2 ( X ),..., f m ( X )) . A decision vector X 1 ∈ T is said to dominate a decision vector X 2 ∈ T (denoted by X 1 p X 2 ) if and only if: I. II.
∀i ∃i |
: fi ( X1 ) ≤ fi ( X 2 ) , fi ( X 1 ) < fi ( X 2 ) ,
i = 1,..., m. i = 1,
L, m
(2) (3)
2
This means that the decision vector X 1 is not worse than X 2 in all objectives and is strictly better than X 2 in at least one objective. Also X 1 weakly dominates X 2 (denoted by X1 p X2 ) if and only if ∀i (4)
: fi ( X1 ) ≤ fi ( X 2 ) ,
where many different ways are introduced by researchers [12][18]. Flight is the most critical step in the MOPSO techniques. In this step the velocity and position of each particle i , is updated as below: v ij ,t +1 = wv ij ,t + c1 R1 ( p ij ,t − x ij ,t ) + c 2 R 2 ( p ij,,gt − x ij ,t ) x ij ,t +1 = x ij ,t + v ij ,t +1
i = 1,..., m.
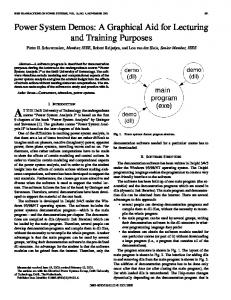
A decision vector X 1 ∈ T is called pareto-optimal if there dose not exist another X 2 ∈ T that dominates it. In the other word, solutions are said to be pareto-optimal (non-dominated), when the objective functions in (1) are minimized, some solutions may exist that performance on one objective cannot be improved without sacrificing performance on at least one other objective [16]-[18]. Therefore, an objective vector is called pareto-optimal if the corresponding decision vector is pareto-optimal. Fig. 1 shows a particular case of the dominance relation in the presence of two objective functions.
(5)
L
where j = 1, , n ; w is the inertia weight of particle, c1 , c2 are two positive constants , and R1 , R2 are random values in the range [0,1] .
Initialize t = 0; x i ; v i = 0 ; p i = x i ; t t t t
Evaluate
f2
pti
and generate
At
Finding local guide for each particle:
p ti , g : Findlb ( At , xti )
Update position xti +1 and velocity vti+1 (Flight)
f1 Fig.1. Dominance relation in a two objectives space where solutions dominated with solution .
pt +1 : Evaluate ( pt , xt +1 ) are Update Archive A
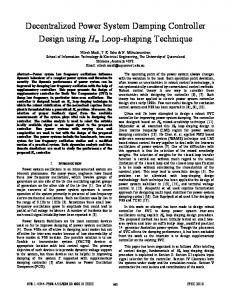
A. Typical Structure of MOPSO The principle of MOPSO algorithm is shown in Fig. 2. In this algorithm t denotes the generation index, pt the population and At the archive at generation t. First, the population pt is initialized, which contains the initial particles, their positions xti and their initial velocities vt . In the next step after evaluating population pt , initial archive At is generated with non-dominated solutions in pt . The function Findlb ( At +1 , xti ) finds the best local guide p ti , g from the set of non-dominated solution stored in the archive At for each particle i . How to select the local guide from the archive has a great impact on convergence and diversity of the solutions
: Update( pt , At )
t = t +1
III. MOPSO METHOD There exist several MOPSO methods such as Hu and Eberhart, Parsopoulos and Vrahatis, Coello and Lechunga, Fildsend and Singh [12]-[17] and sigma method [18]. Since finding the best local guides for each particle in the swarm is important in MOPSO, in each of these methods different suggestions are given. Since it was reported that sigma method has a good feature in finding solution [18], in this paper this method is used. Before explaining the sigma method, the typical structure of MOPSO will be shown.
t +1
No
Meeting end of criterion?
Yes Store the non-dominated solutions in the final archive. Fig. 2. General principle of the MOPSO algorithm.
According to (5), each particle has to change its position xti towards the position of a local guide p ti , g and its best personal position stored in pt . The particles in the population pt will be evaluated by the function Evaluate . In this equation, p i is like a memory for the particle i and keeps the non-dominated (best) position of the particle by comparing the new position xti+1 in the objective space with p ti , where p ti is the last nondominated (best) position of the particle i . At the end of Flight step, a random value known as turbulence factor RT is added to the current position of each particle to do some abrupt change in the population as follows:
3
x ij ,t +1 = x ij ,t +1 + RT x ij ,t +1
(6)
where R T ∈ [−1,1] is a random value added to the updated position of each particle with a probability. Function Update ( pt , At ) updates the archive and stores the non-dominated solutions among pt and At in the archive. The Update function compares whether members of the current population pt are non-dominated (the solutions that are not dominance with another solutions) with respect to the members of the archive At . In order to keep the archive domination-free therefore during executing of the Update function, the dominated solutions must be deleted [17]. The MOPSO algorithm will iteratively repeated until a termination criterion is met. The output of the MOPSO method is the set of non-dominated solutions (pareto-optimal) that will be stored in the final archive. B. Sigma Method This method was proposed by Mostaghim and Teich [16][18] to find the best local guide p ti , g for each particle. In this method, first a value σ i assigned to each point with the coordinates of ( f1,i , f 2,i ) in which all the points on the line f 2 = af 1 have the same value of σ , where σ follows:
σ=
is defined as
f 12 − f 22 f12 + f 22
(7)
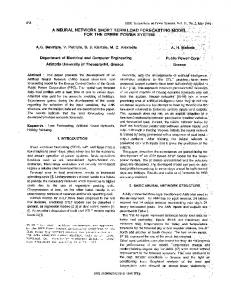
Therefore, all the points on the line f 2 = af 1 have the same σ values as σ i = (1 − a 2 ) /(1 + a 2 ) . Fig. 3 shows the values of σ for three different lines.
σ
⎛ ⎜ ⎜ =⎜ ⎜ ⎜ ⎝
f12 − f 22 ⎞ ⎟
f 22 − f 32 ⎟
2
⎟ /( f1 ⎟ ⎟ ⎠
. .
(8)
+ f 22 + f 32 ...)
C. Sigma Method for Finding the Best Local Guides Finding the best local guide ( p ti , g ) among the archive members for the particle i of population will be based on the sigma method and considering the objective space as follows: Step 1: Assign the value of σ j to each particle j in the archive. Step 2: Calculate σ i for particle i of the population. Step 3: Calculate the distance between the σ i and σ j , ∀j = 1,..., A
.
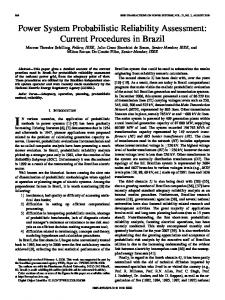
Step 4: Select the particle k in the archive as the best local guide for the particle i when its σ k has the minimum distance to σ i . In this step, the particle from archive member that has a closer sigma value to the sigma value of the particle i is selected as the best local guide for the particle i . Therefore, particle pti , g = x k is the best local guide for particle i . When m = 2 , closer means the difference between the sigma values is small, and when m > 2 closer means the mEuclidian distance between the sigma values is small. Finding the best local guide among the archive members for each particle of the population for a two-dimensional objective space ( m = 2 ) is shown in Fig. 4. This figure shows that each particle that has a closer sigma value to the sigma value of the archive member, must select that archive member as the best local guide. m=2
f2
σ = −0.882
σ =0
f2 Archive-members Particles
6
4
σ = 0.882 1 1
4
6
f1 f1
Fig. 3. Sigma method for a two-objective space.
It should be noted that σ = 0 if f 1,i = f 2,i . When f 2,i = 0 then σ = 1 and for f 1,i = 0 then σ = −1 . Also when a > 1 then
σ is negative and when a < 1 then σ is positive. For the problem with m objective functions, σ is a vector of ⎛ m ⎞ elements ⎜⎜ ⎟⎟ ⎝2 ⎠
in which each element of σ is the combination
of two coordinates in terms of (7) as below:
Fig. 4. Finding the best local guide for each particle of the population using the Sigma method.
IV. PROBLEM FORMULATION The goal is finding the location of TCSC and its parameter in order to increase TTC, reduce the active power losses and reduce voltage deviation. The objective functions in placing TCSC can be defined as follows:
4
1) Total Transfer Capability. For the TTC calculations, one area is considered as the source area and the other considered as the sink area where TTC is a directional quantity from the source to the sink. The scenario that is used for TTC calculation is Load / Generation method (LG) so that the loads in the sink area are increased and the source area will compensate for this increase by increasing its generation. The mathematical formulation of TTC can be expressed as follows: Maximize
λ
3) Voltage deviation: To have a good voltage performance, the voltage deviation at each load bus must be made as small as possible. The voltage deviation to be minimized is as follows:
∑ (V − V
Vd =
refk )
k
)
2
(15)
k∈Ω
Where Ω is the set of all load buses, V k is the voltage magnitude at load bus k and V refk is the nominal or reference voltage at bus k .
Subject to: PGi − PDi −
∑ V V (G cos δ n
i
j
ij
ij
j =1
QGi − QDi −
∑ V V (G sin δ n
i
j
ij
j =1
ij
+ Bij sin δ ij )
(9)
+ Bij cos δ ij )
(10)
Vi min ≤ Vi ≤ Vi max
(11)
Sij ≤ Sijmax
(12)
Where: λ is scalar parameter representing the increase in bus load or generation, λ = 0 corresponds to no transfer (base case) and λ = λmax corresponds to the maximal transfer. PGi , QGi are real and reactive power generation at bus i , PDi , Q Di are real and reactive power demand at bus i , n is the bus number, | Vi |, | V j | are voltage magnitude at bus i and j , δij is
V. STUDY SYSTEM The system shown in Fig. 5 consists of 16 machines and 68 buses for 5 interconnected areas. The first nine machines, G1 to G9, constitute the simple representation of Area 1. Next four machines G10 to G13, represent Area 2. The last three machines, G14 to G16, are the dynamic equivalents of the three large neighboring areas interconnected to Area 2. The subtransient reactance model for the generators, the first-order simplified model for the excitation systems, and the linear models for the loads and ac network are used. The power system datas are obtained from [24] then modified and used in Matpower. G14
G1
G8 60
53
66 40
48
29
47
41
2
26
25
28
1
61 24
G9
27
voltage angle difference between bus i and bus j , | Vi | min , | Vi | max are lower and upper limits of voltage magnitude at bus i , S ij is apparent power flow in line i - j
31
30 62
16
58 9
33
19
i∈Sink
(λ max ) −
∑P
0 Di
G6
12
56
49 34
51 50
G4 11
6
8
67 G15
20
5
35
Di
14
4
The TTC level in each case (normal or contingency case) is calculated as follows [1]-[9]:
∑P
22
15 32
42
TTC =
17
18
63
G10
is thermal limit of line i - j . and S ij max
3
G11
38
46
21
13
36
45 44
where PDi (λ max ) is the sum of loads in the sink area corresponding to the maximal transfer and P Di0 is the sum of loads in the sink area corresponding to no transfer (base case) .
G7
G2
55
65 52
i∈Sink
59
10 54
37
(13)
23
G5 7
64
57
68
39
G13
G3
G16
Fig. 5. One-line diagram of a 5-area study system.
2) Active power losses. The total power loss to be minimized is as follows: PL =
∑
⎡Vi 2 ⎣
⎤ + V j2 − 2VV i j cos(δ i − δ j ) ⎦ Yij cos ϕij
(14)
Where Vi and δ i are the magnitude and angle of voltage at bus i, and Yij and ϕij are the magnitude and angle of the admittance of the line from bus i to bus j.
For TTC calculation, the 5 areas of study system are shown in Fig. 6. The power transfers from area 2 to other areas (areas 1, 3 and 5). Also the power transfers from area 5 to 4 and 4 to 3.
5
non-dominated (best) position of the particle i and the position of a local guide ( p ti , g ). Now for choosing the leader or p ti , g , between the archive members based on the procedure in III.C, σ j (related to archive members) and σ i (related to the particle) is calculated by using (16). The particle from archive member that has a closer sigma value to the sigma value of the particle i is selected as the best local guide for the particle i . The obtained results are shown in Fig. 7. This figure shows the non-dominated solutions in the archive in the 3-objective space. Fig. 6. The 5-area of study system.
The MOPSO incorporating the sigma method is used to locate TCSC in the power system shown in Fig. 5. The implementation is presented below: First of all, since the three objectives in (13)-(15) are not in the same range, σ is calculated as below for current threeobjective optimization problem: σ
⎛ ( K 2 K 3 f1 ) 2 ⎜ = ⎜ ( K1 K 3 f 2 ) 2 ⎜ ⎜ (K K f ) 2 ⎝ 1 2 3
− ( K1 K 3 f 2 ) 2 ⎞ ⎟
− ( K1 K 2 f 3 ) 2 ⎟ /(( K 2 K 3 f1 ) 2 + ( K1 K 3 f 2 ) 2 + ( K1 K 2 f 3 ) 2 ) ⎟
− ( K 2 K 3 f1 ) 2 ⎟⎠
(16) where K1 ,K2 ,K3 are the maximum values of the objectives f1, f2 and ,f3, respectively, in which f 1 = Vd , and f2 is the function that enhance TTC defined as below: f2 =1/ (Improved TTC)
(17)
Improved TTC= (TTC1-TTC2)/ TTC2
(18)
Also, Table I shows the results obtained by MOPSO, which are stored in archive in more detail. As it can be seen in the table, we have three solutions for our problem. All three solutions found line 52-42 for the placement of TCSC, but with different levels of compensation. These solutions should be analyzed to find a good placement for TCSC. This can be done based on the importance of each objective function. Now the effect of TCSC with the obtained results by MOPSO is investigated. Figs. 8-11 show the V/P curve for the system without TCSC and with TCSC placed in the system based on the obtained solutions (archive members). These figures show that, by considering any of the solutions, the stability margin is improved but the stability margin of the third solution is better than other two solutions. Although the third solution has a better stability margin but Table I shows that the improved TTC for the third solution is less than other two solutions. TABLE I. NON-DOMINATED SOLUTIONS IN THE ARCHIVE FOR PLACING TCSC BASED ON THREE-OBJECTIVE FUCTION. Level of compensat ion by TCSC
Improved TTC
Voltage deviatio n
52-42
-.31XL
37.24%
.0387
3.61%
2
52-42
-.38 XL
35.60%
.0355
4.17%
3
52-42
-.50 XL
24.66%
.0315
4.85%
Archive member
Line
1
Percentage of losses reduction
where TTC1 is the amount of TTC with TCSC placement and TTC2 is the amount of TTC without TCSC placement, (TTC is defined in (13)) and f3 is the function that represents active power losses, thus f3 =PL in (15). In the MOPSO algorithm, n particles for a population are generated randomly where n is selected to be 40. The goal of the optimization is to find the best location of TCSC where the optimization is made on two parameters: its location and size. Therefore each particle is a d -dimensional vector in which d = 2 . The number of iteration is considered to be 100, which is the stopping criteria. The parameter in (5) must be tuned. These parameters control the impact of the previous velocities on the current velocity where, in this paper, c1 = c 2 = 2.05 , the weight w is decreasing linearly from 0.95 to 0.2 and the turbulence factor is set to be 0.05. The selected values are based on the suggestion made in literatures [23], [18]. The initialization is made on the position randomly for each particle where each particle shows a location and a size for TCSC. The maximum of TTC can be calculated by increasing the loads while one of the criteria of TTC limits such as voltage limit, transmission line thermal limit and generation limit are violated. Then with the obtained TTC, f2 is calculated and followed by calculation of f1 and f3 . According to (5), the position of each particle i is updated regarding to is the last
Fig. 7. Archive members in 3-objective space.
6
Fig. 8. V/P Curves without compensation.
Fig. 11. V/P Curves with 31% capacitive compensation by TCSC on Line 52-42.
Fig. 9. V/P Curves with 50% capacitive compensation by TCSC on Line 5242. Fig. 12. Particles and leaders in objective space after 100 iteration (40 particles)
Fig. 10. V/P Curves with 38% capacitive compensation by TCSC on Line 5242.
Fig. 12 shows the position of the particles with the obtained solutions (the three leaders) in the search space for the 100-th iteration. This figure shows that, almost all particles except a few particles have moved toward the leaders, this means that the convergence of the algorithm is good.
For the MOPSO problem, the algorithm is run for 10 independent run under different random seeds. 100% of the obtained results show the same solutions as shown in table I and this shows the robustness of the algorithm. To show the effects of the number of particles as well as iteration, another trail is considered as follows: The number of particles and iteration are increased to 60 and 200 respectively. The obtained results are shown in Fig. 13. This figure shows only one new solution (non-dominated solution) is added to the previous archive members. But the point is that once again the algorithm finds line 52-42 for the placement of TCSC. Table II shows this new archive member. Fig. 14 shows the position of the particles with the obtained solutions (the four leaders for the second trail) in the search space for the 200-th iteration. This figure shows that convergence of the algorithm is good due to moving the particles to the archive members. Fig.15 show the P/V curve for the system with TCSC placed in the system based on the new obtained solution.
7
Line
4
52-42
Level of compensat ion by TCSC
Improved TTC
Voltage deviatio n
-.46XL
24.69%
.0359
Percentage of losses reduction
Archive member
4.64%
VI. CONCLUSIONS
Fig.13. Archive members in 3-objective space.
In this paper, MOPSO is applied to determine optimal allocation of TCSC to maximize the TTC between different control areas, reduce the total active power losses and reduce the voltage deviation. To find the best local guides the sigma method in MOPSO is used, where the algorithm is converging to pareto-optimal solutions. Solving problems by considering different objective functions are difficult with an analytical method, especially for having a good trade off between the objective functions. Therefore, MOPSO could be a good alternative for solving such problems. Since the possible solutions are stored in an archive, this method can give us a chance to select a good solution from the archive for our problem based on the importance of the objective functions. For future work the ability of MOPSO in placing of Static Var Compensator (SVC) and then the Coordination of SVC and TCSC to improve TTC will be investigated by the authors.
VII. REFERENCES
Fig. 14. Particles and leaders in objective space after 200 iteration (60 particles)
Fig. 15. V/P Curves with 46% capacitive compensation by TCSC on Line 5242.
[1]
G. C. Ejebe, J. G. Waight, S. N. Manuel, and W. F. Tinney, “Fast calculation of linear available transfer capability,” IEEE Trans. Power Syst., Vol. 15, No. 3, pp. 1112-1116, August 2000.
[2]
G. C. Ejebe, J. Tong, J. G. Waight, J. G. Frame, X. Wang, and W. F. Tinney, “Available transfer capability calculations,” IEEE Trans. Power Syst., Vol. 13, No. 4, pp. 1521-1527, November 1998.
[3]
M. H. Gravener and C. Nwankpa, “Available transfer capability and first order sensitivity,” IEEE Trans. Power Syst., Vol. 14, pp. 512-518, May 1999.
[4]
M. Shaaban, Y. Ni, H. Dai, and F. F. Wu, “Calculation of total transfer capability incorporating the effect of reactive power,” Elect. Power Syst. Res., Vol. 64, No. 3, pp. 181-188, March 2003.
[5]
Y. Ou and C. Singh, “Assessment of available transfer capability and margins,” IEEE Trans. Power Syst., Vol. 17, No. 2, pp. 463-468, May 2002.
[6]
Y. Ou and C. Singh, “Improvement of total transfer capability using TCSC and SVC”, in Proc. 2001 IEEE Power Engineering Society Summer Meeting, Vol. 2, pp. 944 - 948.
[7]
W. Ongsakul and P. Jirapong, “Optimal allocation of FACTS devices to enhance total transfer capability using evolutionary programming,” in Proc. 2005 IEEE International Symposium on Circuits and Systems, Vol. 5, pp. 4175 – 4178.
[8]
M. Shaaban, N. Yixin, and F. Wu, “Total transfer capability calculations for competitive power networks using genetic algorithms,” in Proc. 2000 International Conference on Electric Utility Deregulation and Restructuring and Power Technologies, pp.114 – 118.
[9]
S. Mollazei, M. M. Farsangi, and H. Nezamabadi-Pour, “Allocation of TCSC to enhance total transfer capability using Guaranteed Convergence particle swarm optimization,” in Proc. 2006 TPE Conference, Turkey, pp. 5-15.
TABLE II. NEW NON-DOMINATED SOLUTIONS IN THE ARCHIVE FOR PLACING TCSC BASED ON THREE-OBJECTIVE FUCTION AFTER 200 ITERATIONS BY COSIDERING 60 PARTICLES.
8 [10] J. Kennedy and R. Eberhart, “Particle swarm optimization,” in Proc. 1995 IEEE Int. Conf. Neural Networks (ICNN’95), Vol. IV , pp. 1942– 1948, 1995.
BIOGRAPHIES
[11] J. Kennedy, “The particle swarm: Social adaptation of knowledge,” in Proc.. 1997 IEEE Int. Conf. Evol. Comput. , pp. 303–308, 1997.
Sara Molazei received her B.S. degree in Electrical Engineering from Nikbakht University in 2003. Currently she is a M.Sc. student in Kerman University. Her interests include power system control and stability and evolutionary computation.
[12] J. E. Fildsend and S. Singh. “A multi-objective algorithm based upon particle swarm optimization, an efficient data structure and turbulence”. The 2002 U.K. Workshop on computational Intelligence, pp. 34-44. [13] K. E. Parsopoulos and M. N. C. Vrahatis, “Particle Swarm Optimization method in Multi objective problems” in Proc. 2002 ACM symposium on Applied Computing (SAC), pp. 603-607. [14] C. A. Coello and M. S. Lechuga, “MOPSO: A proposal for multiple objective particle swarm optimization” in Proc. IEEE World Congress on Computational Intelligence (CEC2002), pp. 1051-1056.
M.M. Farsangi received her B.S. degree in Electrical Engineering from Ferdousi University in 1995, and her PhD degree in Electrical Engineering from Brunel Institute of Power Systems, Brunel University in 2003. Since 2003, she has been with Kerman University, Kerman, Iran, where she is currently an Assistant Professor of Electrical Engineering. Her research interests include power system control and stability and computational intelligence.
[15] X. Hu and R. Eberhart, ”Multi objective optimization using dynamic neighborhood particle swarm optimization”, in Proc. 2002 IEEE World Congress on Computational Intelligence (CEC2002), pp. 1677-1681. [16] S. Mostaghim and J. Teich, “Covering pareto-optimal fronts by sub swarms in multi-objective particle swarm optimization” in Proc. 2004 Evolutionary Computation (CEC,2004), Portland, Oregon, USA, Vol.2, pp. 1404-1411.
Hossein Nezamabadi-Pour received his B.S. degree in Electrical Engineering from Kerman University in 1998, and his M.Sc. and Ph.D. degree in Electrical Engineering from Tarbait Moderres University, in 2000 and 2004, respectively. Since 2004, he has been with Kerman University, Kerman, Iran, where he is currently an Assistant Professor of Electrical Engineering. His interests include pattern recognition, soft computing, evolutionary computation and image processing.
[17] S. Mostaghim and J. teach, “The role of ε -dominance in multi objective particle swarm optimization methods” in Proc. 2003 IEEE Evolutionary Computation (CEC, 2003), Canberra, Australia, Vol. 3, pp. 1764-1771. [18] S. Mostaghim and J. Teich, “Strategies for finding good local guides in multi-objective particle swarm optimization (MOPSO)” in Proc. 2003 IEEE 2003 Swarm Intelligence Symposium, pp. 26-33. [19] R. Garduno-Ramirez and K. Y. Lee, “Multiobjective optimal power plant operation through coordinate control with pressure set point scheduling,” IEEE Trans. Energy Conversion, Vol. 16, No. 2, pp. 115122, June 2001. [20] B. H. Lee and K. Y. Lee, “An application of S-Model learning automata for multi-objective optimal operation of power systems,” IEE ProcGener. Transm. Distrib., Vol. 152, No. 2, pp. 295-300, March 2005. [21] J. S. Heo, K. Y. Lee , and R. Garduno-Ramirez, “Multiobjective control of power plants using particle swarm optimization techniques,” IEEE Trans. Energy Conversion, Vol. 21, No. 2, pp. 552-561, June 2006. [22] J. G. Vlachogiannis and K.Y. Lee, “Determining generator contributions to transmission system using parallel vector evaluated particle swarm optimization,” IEEE Trans. Power Syst., Vol. 20, No. 4, pp. 1765-1774, November 2005. [23] F. Van den Bergh and A. P. Engelberecht, “A new locally convergent particle swarm optimizer”, in Proce. 2002 IEEE Conference on Systems and Cybernetics. (Hammamet. Tunisia), Vol. 3. [24] J. H. Chow “ Power system toolbox: A set of coordinated m-files for use with MATLAB,” Cherry Tree Scientific Software, 1997.
Kwang Y. Lee received his B.S. degree in Electrical Engineering from Seoul National University, Korea, in 1964, M.S. degree in Electrical Engineering from North Dakota State University, Fargo, in 1968, and Ph.D. degree in System Science from Michigan State University, East Lansing, in 1971. He has been with Michigan State, Oregon State, Univ. of Houston, and the Pennsylvania State University, where he is now a Professor of Electrical Engineering and Director of Power Systems Control Laboratory. His interests include power system control, operation, planning, and intelligent system applications to power systems. Dr. Lee is a Fellow of IEEE, Associate Editor of IEEE Transactions on Neural Networks, and Editor of IEEE Transactions on Energy Conversion. He is also a registered Professional Engineer.
.