6th International Symposium on Mobile Mapping Technology, Presidente Prudente, São Paulo, Brazil, July 21-24, 2009
MULTI-PLATFORM MOBILE DATA FUSION By Taher Hassan, and Naser El-Sheimy Mobile Multi-sensor Research Group Department of Geomatics Engineering, The University of Calgary 2500 University Dr. N.W. Calgary, Alberta, Canada T2N 1N4 Tel: (403) 220 7587, Fax: (403) 284 1980 E-mail:
[email protected], and
[email protected] KEY WORDS: Photogrammetry, Bundle Adjustment, Fusion, Georeferencing, Mobile Mapping ABSTRACT: Mobile mapping refers to the means of collecting georeferenced geospatial data using multi-sensors that are mounted on a moving platform. Multi-sensor integrated mapping technology has clearly established a trend towards fast geospatial data acquisition for many applications such as highway infrastructure mapping and corridor inventories acquisition. A common feature of land based mobile mapping systems (LMMS) is that a camera array is mounted on a mobile platform, allowing for stereo imaging and 3-D measurements. Direct georeferencing of digital image sequences is accomplished through integrated navigation component. Currently available land-based systems can achieve decimetre level accuracy of 3-D objects coordinate. Additionally, airborne sensors, such as large-format digital cameras, laser scanners (or LiDAR) have undergone tremendous development and have played a significant role in many mapping applications. Collaborative mapping with multi-platform sensors is becoming a new technological trend in mobile mapping. Images captured by terrestrial and airborne MMS are different in the sense of direction, scale, coverage, and hidden/visible features. With the fusion of images captured by different kinds of sensors (multi-modality), 2D images coming from the same vehicle, aerial images, an important issue will be the correct geo-referencing of data, which means a good localization (position, orientation) with respect to a common coordinate frame before model creation. Consequently, the integration between the data captured from different platforms is of high potential hence both image/navigation data sets are complementary and can be integrated to complete the picture about the earth’s surface. The proposed registration scheme improves the 3D mapping accuracy. Also, the common adjustment of terrestrial and aerial photogrammetric networks will recover/enhance sensors georeferencing information which bridges terrestrial systems during GPS signal outages or georeferencing aerial images block. The proposed integration framework uses lines (e.g. road edges and lane lines) as matching entities in addition to the traditionally-used point-based approach. In this research we consider the scientific and the technical issues about the strategy of the proposed fusion scheme. The used modalities simulate the configurations of the VISATTM mobile mapping system. 1. INTRODUCTION The number of sensors, orbiting our globe, is growing steadily over the years. Data, collected by such sensors and from different platforms, are considerably different in physical nature, type of information they capture, and geometric/radiometric resolutions and characteristics. It is firmly confirmed through plethora of researches that no single sensory data can provide the optimal solution for a specific query. Consequently, data fusion/integration is considered for better solution/information recovery about the object being captured. Many researchers have proposed different fusion schemes for integrating different sensory data. However, there is less amount of attention towards the fusion of imagery/navigation data of airborne and land-based mobile mapping systems. Mobile Mapping Systems (MMS) can be classified according to the physical carrier of operation into land (LMMS), and airborne (AMMS) based systems. Images captured by (LMMS) and (AMMS) are different in the sense of direction, scale, coverage, and hidden/visible features. Consequently, the integration between the data captured by the two systems is of high potential as both image/navigation data sets are
complementary and can be integrated to complete the picture about the earth’s surface. In this paper, we introduce a novel scheme for the fusion of AMMS and LMMS data through adapting many of the existing tools to fit the special requirements of the proposed fusion scenario. The investigation and the drawn conclusions are based on simulating modalities using VISATTM platform configuration. This research aims at realizing the correct georeference of multi-platform images, which can be visualized in several contexts of application and serves different scientific communities. The framework has already been presented in (Hassan and El-Sheimy, 2008) which shows partial results. This paper discusses more results. In section 3, the potential of the proposed fusion scheme is illustrated. Section 4 describes the math models for matching entities after applying the necessary adaptations to fit the proposed fusion scheme. Section 5 presents the possible object space constrains. Section 6 draws the main special requirements and features of the proposed fusion scheme. The preformed simulations are described in section 7 as well as the obtained results. Conclusions are drawn in section 8.
2. BACKGROUND
(position, orientation) in a common terrestrial coordinate frame before model creation.
Numerous types of sensory data have become available and they lie under different categories: Distinction
Example
Colour information
colour and pan images
Spectral bands
multi/hyper spectral
Recording media
analogue and digital
Sensor Dimensionality
frame, line, and panoramic
Platform/sensor location
satellite, aerial, terrestrial
Physical nature collected data
of
the
optical, Non-optical data like LiDAR (Light Detection And Ranging)
Based on the above discussion, the integration between the data captured by AMMS and LMMS is of high potential as both image/navigation data sets are complementary and can be integrated to complete the picture about the earth’s surface. A combined solution, from both systems’ observations improves the 3D quality of the object space model. In (Hassan et al., 2006a), a photogrammetric strategy for bridging LMMS during GPS signal outages has been introduced. The framework has been developed based on photogrammetric reconstruction using LMMS and point features only. The new proposed integration framework, of both data sets with different matching entities (i.e. lines and points), can make the reconstruction of the LMMS trajectory easier and more practical. Finally, as a major potential of this frame work, if the aerial images involved have no or poor georeference information−as huge image data base still exists−the georeference information can be recovered efficiently. The georeference of the aerial images, in this case, will be mainly based on the 3D control lane line extracted from LMMS (Cheng et al., 2007).
The topic of multi-sensor data fusion has received, over the years, a lot of attention by various parties, see for example (Hall and Llinas, 1997). These techniques have the overall objectives of achieving numerous benefits, for details see (Hong, 1999). Many researchers have proposed different fusion schemes for integrating different sensory data. This fusion process can be broadly classified into optical-to-optical, optical-to-nonoptical, and nonoptical-to-nonoptical.
The proposed three applications for the investigated fusion scenario serve different community. Enhancing the 3D object space accuracy is a pure mapping application. Additionally, aiding land-based systems in urban blocks is one of the navigation community’s concerns. Finally, georefencing airborne images using the proposed fusion scheme presents a fast and efficient solution for many photogrammetric applications
To name few works on multisensory data fusion, (Lee et al., 2002) presented a study on performing aerial triangulation using frame, push broom, and whisky broom cameras thus applying the concept of multi-sensor aerial triangulation (MSAT). (Lee and Choi, 2004), merged the terrestrial images and terrestrial lidar cloud points to reconstruct 3D GIS building models with more realistic geometric and radiometric properties. (Iavaronea and Vagnersb, 2004) generated complete and accurate solid model for Toronto city hall, Toronto, Canada, by combining aerial and tripod-mounted LiDAR data. In fusion literature, there is almost no attempt towards the fusion of airborne and land-based mobile mapping systems imagery/navigation data.
4. MATHEMATICAL MODEL
3. POTENTIAL OF THE MMS DATA FUSION Images captured by LMMS and AMMS are different in the sense of direction, scale, coverage, hidden/visible features. In LMMS, the direction of the camera axis is almost horizontal. While in AMMS, the camera optical axis is usually looking vertically down. Additionally, in LMMS the features of interest are usually traced in images captured at 20-50m away from the camera while, in AMMS the camera-object distance ranges from 300m to several kilometres above the earth’s surface. Therefore, one aerial image may cover the operational range of several hundreds of LMMS image sets. In AMMS, the images are earth-top views which contain mainly building roofs and road planes. LMMS’ images are complementary to AMMS’ images as they include the building sides and more road details. With data fusion of images captured by different kinds of sensors (multi-modality), an important issue will be the correct geo-referencing of data, which means a good localization
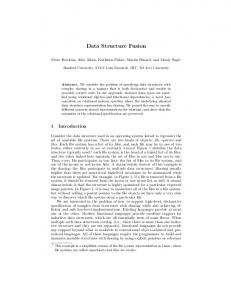
The trend in designing photogrammetric adjustment has changed significantly, with the availability of navigation sensors together with mapping sensors (i.e. mobile mapping systems), thus applying the concept of Integrated Sensor Orientation (ISO). The design of the bundle adjustment framework has been extended to include all the available information about the block configuration, e.g. platform position/attitude, as observed by GPS/INS integrated systems. Additionally, camera characteristics, as camera calibration procedure output, can be also included, (Ebner, 1976). All the introduced information is involved with appropriate weighting schemes. Most of the photogrammetric frameworks either in the scientific/educational community, see for example BLUH, (Linder, 2003) or commercial products, see for example (HJW), (INPHO' s), and (NOOBEED)1, are mainly designed for aerial applications, with one possible camera attached and with the possibility of integrating navigation information as observed parameters. However, this treatment makes it only suitable for single camera system per exposure station (i.e. AMMS). In case of integrating data from both LMMS and AMMS, a photogrammetric framework, Figure 1, specially designed for mobile mapping systems, is required. This framework is 1
HJW, Geospatial http://www.hjw.com/index.htm INPHO' s, Photogrammetric System. http://www.inpho.de/index.php?seite=index_en&navigation=1896 &root=165&kanal=html NOOBEED http://noobeed.com/index.htm
different from other frameworks for photogrammetric operations. The difference is more pronounced, if the system hardware includes more than one camera, fixed to the navigation sensor.
Where: xijk r , yijk r , f ( j ) b(k )
Rm
Image Meas. Line/Point
c( j )
Rb
X e( k ) , Y e ( k ) , Z e ( k ) Object Space Constrains
Navigation Data
∆X
λi
Object Space
Figure 1: Framework Input Data
LMMS always have multi-camera to increase the field of view of the system (e.g. the VISAT imaging system configuration, has 8 cameras with 330° panoramic field of view). For a single camera system, the physical exposure station coincides with the location of the camera perspective center. In case of multicamera system, the exposure station is the navigation sensor center (i.e. IMU triad center), see Figure 2. The different camera perspective centers are connected to the exposure station though a linear offset and series of rotations. The photogrammetric adjustment framework, based on multi-camera concept, models the system more efficiently and provides the ability to perform the system calibration.
C1
C2
b Exposure Station
Figure 2: Multi Camera System
A more general form of collinearity model for frame cameras is given: xijk r
( j) X i − X e( k ) ∆X c j b k ( ) ( ) yijk r = 1 / λi .Rb Rm . Yi − Y e( k ) − ∆Y ( j ) ( j) ∆Z ( j ) Z i − Z e( k ) f
, ∆Y ( j ) , ∆Z ( j )
X i , Yi , Z i
Framework
Camera IO/∆EO
( j)
(1)
Refined image measurements of point (i) in an image taken by camera (j) at the exposure station (k) The system attitude rotation matrix at the exposure station (k) Camera delta rotation matrix as a function of boresight angles System position, which are equivalent to the exposure station in multi-camera framework Lever arm component
Ground coordinate of point (i) Unknown scale factor
Until recently, aerial triangulation was based on point-wise measurements. Point-wise approach requires that measured image points in one image have to be identified on another image(s). These point measurements must be conjugate i.e. corresponds to exactly the same 3D object point. The mathematical formula for expressing image to object correspondence is based on collinearity equation. The other approach of introducing higher order primitives, usually referred to as feature-based, assumes that the measured points belong to certain object feature, which fulfils a certain path in 3D space. The attractiveness of applying feature based approach is that point to point correspondence is no longer required. The use of linear features is applicable in mapping of either: manmade areas where plenty of buildings, and road edges; or natural areas where river bank lines, coast lines and vegetation boarders can be involved as linear features (Heikkinen, 1992). Image space linear features are easier to extract than point features. Meanwhile, object space linear features can be directly derived form LMMS, GIS databases, and/or existing maps, (Habib and Morgan, 2003). Yet, the inclusion of linear features provide more constrained solution for the exterior orientation parameters, and better distortion modelling, however in some applications, is an option like for example camera calibration. Meanwhile, the inclusion of linear features becomes necessity, when they become the only possible (realistic) similarity entities for example in case of integrating LiDAR and photogrammetric data (Habib et al., 2004b). Another example that demonstrates the importance of involving linear feature constraints in photogrammetric triangulation is the multi-sensor triangulation, where various sensory data with different geometric resolution are involved. In this case, the measurements of conjugate linear features is of a great advantage, for their ease identification in different resolution images due to their high contrast (Habib et al., 2004a). The linear feature constraint, see Figure 3, is expressed mathematically as follows:
(V1 ⊗ V2 )• V3 = 0
(2)
6. FRAMEWORK The proposed framework for performing such integration scenario is considered as a generic bundle adjustment that can be easily extended to include additional matching entities and also to add any functionality if necessary. In order to make the developed framework fits the integration between mobile mapping data, many features have to be added.
Figure 3: Linear Feature Constrain
The framework, introduced in this paper, involves linear feature constrain since LMMS, with multi camera system, are usually operated over road networks, where plenty of straight road edges and lane line markings are available. The same features will be mostly visible in AMMS images. The implementation of the linear feature constraint can be implemented in a number of ways. The two vectors V1 and V2 (in Figure 3) can be either replaced by their corresponding object space vector that joins the perspective centre and the end/start point. Alternatively, they can be replaced by their corresponding image space vector after back projecting the line end points to the image space. The second approach is used as it can be adapted to point based existing photogrammetric frameworks without major programming efforts.
5. OBJECT SPACE CONSTRAINS One of the objectives of this framework is the enhancement of the navigation data quality during navigation in areas where GPS signals are denied. Object space constrains are consider as another source of information. The advantage of these constrains is that they are available for free. Additionally, downtown areas are usually rich with these type of constrains. There are several constrain that are available in man mad areas. Building edges are vertical lines. This constrain is applied during the bundle adjustment to improve the quality of the estimated unknowns. Every constrain has its own impact on some group of the estimated unknowns. Vertical line constrain improves the estimation of both roll and pitch angles with no effect on the other exterior orientation elements. Other constrains can be applied whenever it is realistic to apply. The implemented constrains are of the type of stochastic constrains to allow for applying different level of confidence in such constrains. There are several object-space constrains that were implemented within this framework which can be listed as follows: 1- Horizontal and spatial distance. 2- Horizontal line. 3- Vertical line. 4- Parallel lines. 5- Horizontal and spatial angle between two lines. 6- Line direction constrain.
One of the basic modification, being a multi-camera enabled, which is a must when involving land-based data. This can be done by involving another rotation matrix as a function of boresight angles. Of course, any order of rotation is possible. Regardless of the order, the three rotation angles are included as parameters in the adjustment. A disadvantage of this procedure is that the addition of these angles necessitates rather fundamental changes to the implementation of the adjustment, as the collinearity equations become functions of six angles instead of just three. This, in turn, makes the linearization of the collinearity equations considerably more complex. However, the necessity of changing the adjustment model presents a good opportunity to re-parameterise the
R cM (rotation matrix between camera and mapping frame) rotation matrix in terms of the roll, pitch, and azimuth angles. This enables the values observed INS angles as well as their covariance to be included in the adjustment. A great advantage offered by using linear feature, which is tightly related to the land based mobile mapping system bridging, is that using linear features can still be used in extreme cases where occlusions exist. These occlusion problems are always exhibited during navigation in downtown area as resulted from parking or heavy traffic. Finally, with linear feature, the reconstruction process is practical one as compared to strategies that rely on point feature only. Of similar importance to the previous features, the proposed framework is designed to be flexible when it comes to the treatment of the different adjustment objects in the adjustment. Two examples are given herein. Firstly, different scientific communities use certain parameterization for the rotation matrix: navigation community usually expresses the body attitude in space using roll, pitch, and azimuth; while the photogrammetric community use sequence of Euler rotations. Therefore, the framework must allow the parameterization of each exposure station independently using any parameterization set. Secondly, when dealing with camera interior orientation (IO), distortions in small format cameras can be modelled using first or second order polynomial. Meanwhile, when dealing with large format cameras (aerial), distortion models are more complicated and need higher order polynomial. Design flexibility allows attaching different distortion models to different cameras independently.
7. SIMULATIONS AND RESULTS The first simulation results (L_P) were presented in (Hassan et al., 2006b). It is shown here to allow the reader to follow the developed ideas and recognize the advantages of the proposed fusion scheme. L_P simulation is based on LMMS images and uses points only. It also assumes straight trajectory for the van, where images are captured every 10 ms along road centreline. Figure 4 and Figure 5 show the reconstructed 2D trajectory and profile respectively resulted from L_P simulation. The
horizontal position error reaches up to 40cm. Although these results meets the accuracy requirements for many mapping and navigation applications, the simulation is considered not practical to be implemented in real life applications, due to difficulty in tracking the same point through the image sequence. 0.4
X (m)
Y (m)
Sy stem Position Sy stem Trajectory Sy stem Heading
0.35 0.3
Z (m)
Northing (m)
0.25 0.2 0.15
Roll (‘)
0.1 0.05 0
Pitch (‘)
-0.05 -0.1
0
100
200 300 Easting (m )
400
500
Azimuth (‘)
Figure 4: Reconstructed 2D Trajectory from L_P Simulation 0.02
Sy stem Position Sy stem Profile Sy stem Pitch
0
Elavation (m)
-0.02 -0.04 -0.06 -0.08 -0.1
0
100
200 300 Easting (m )
400
500
L_PL_1
1.5E-01 1.1E-01 3.2E-01 -3.4E-01 8.2E-03 6.8E-03 1.9E-02 -2.3E-02 3.6E-03 3.0E-03 7.1E-03 -7.4E-03 7.6E+00 6.0E+00 1.9E+01 -1.5E+01 1.2E+00 9.3E-01 3.2E+00 -1.9E+00 1.3E+00 1.1E+00 3.3E+00 -2.3E+00
1.1E-01 8.3E-02 2.4E-01 -2.6E-01 8.0E-03 6.6E-03 1.7E-02 -2.5E-02 3.8E-03 3.1E-03 8.2E-03 -7.3E-03 7.6E+00 5.9E+00 2.3E+01 -1.2E+01 1.3E+00 1.0E+00 3.4E+00 -2.0E+00 1.3E+00 1.1E+00 3.3E+00 -2.5E+00
The previous simulations assume that the straight lines (lane line markings) are extended throughout the whole trajectory which may not be realistic. The third group of simulations involves airborne images, which constitute a frame to tie all images due to its large coverage compared to land images. The question is how to establish the georeferencing of airborne images. Simulations LA_LP_1I (one airborne image) and LA_LP_2I (two airborne images) assume that the image(s) are of known exterior orientation resulting from airborne MMS.
X (m)
Figure 5: Reconstructed Profile from L_P Simulation
The simulations become more realistic when linear features are involved. Additionally, the simulation with only linear features (L_L) shows significant improvement in the estimated trajectory. The RMS of the trajectory components are 8, 4mm (x and z) and 7.4, 1.5, and 1.4 arc min (roll, pitch, and azimuth). As mentioned earlier the forward direction was not observable as fitness value does not change by forward motion of the vehicle. This means that the forward direction component is not updated during the adjustment. To fix this problem, it is proposed to add some point measurements with the consideration to keep them to a minimum level. The two simulations L_PL_2 and L_PL_1 are conducted with two and one point measurements per image, respectively. The statistics of the obtained results are listed in Table 1. Results of both simulations are comparable and therefore it was concluded that one point measurement per image is enough which the amount of manual measurements. This conclusion was followed in consequent simulations.
L_PL_2
Table 1: L_PL_1 and L_LP_2 Results Statistics
-0.12 -0.14
RMS Mean Max. Min. RMS Mean Max. Min. RMS Mean Max. Min. RMS Mean Max. Min. RMS Mean Max. Min. RMS Mean Max. Min.
Y (m)
Z (m)
Roll (‘)
Pitch (‘)
Azimuth (‘)
RMS Mean
LA_LP_2I 1.1E-01 8.3E-02
LA_LP_1I 1.1E-01 8.3E-02
LA_LP_1IUG 1.1E-01 8.4E-02
Max. Min. RMS Mean Max. Min. RMS Mean Max. Min. RMS Mean Max. Min. RMS Mean Max. Min. RMS Mean Max. Min.
2.4E-01 -2.6E-01 7.9E-03 6.3E-03 1.5E-02 -2.5E-02 3.8E-03 3.1E-03 8.1E-03 -7.3E-03 7.5E+00 5.9E+00 2.4E+01 -1.1E+01 1.3E+00 1.0E+00 3.4E+00 -2.0E+00 1.3E+00 1.1E+00 3.3E+00 -2.5E+00
2.4E-01 -2.6E-01 8.0E-03 6.7E-03 1.7E-02 -2.4E-02 3.8E-03 3.1E-03 8.2E-03 -7.3E-03 7.6E+00 5.9E+00 2.3E+01 -1.3E+01 1.3E+00 1.0E+00 3.4E+00 -2.0E+00 1.3E+00 1.1E+00 3.3E+00 -2.5E+00
2.4E-01 -2.6E-01 8.0E-03 6.6E-03 1.7E-02 -2.5E-02 3.8E-03 3.1E-03 8.2E-03 -7.3E-03 7.6E+00 5.9E+00 2.3E+01 -1.2E+01 1.3E+00 1.0E+00 3.4E+00 -2.0E+00 1.3E+00 1.1E+00 3.3E+00 -2.5E+00
Table 2: LA_PL_1I, LA_LP_2I, and LA_LP_1IUG Results Statistics
Comparing the results of these simulations, it is clear that only one image is needed and this keeps the measurements to a min level. If the airborne images are not a product of a MMS, it is still can be used. The georeferencing can be obtained using few control points (as in the LA_LP_1IUG simulation) which can be established on the roof of tall buildings in down town blocks. Alternatively, the georeference can be obtained from land-based MMS data by having some land images outside the blockage area with some recommended configurations. The reconstructed 2D trajectory of LA_LP_1IUG is shown in Figure 6. The results when involving aerial images are shown in Table 2 0.03
Sy stem Position Sy stem Trajectory Sy stem Heading
0.02
Northing (m)
0.01 0 -0.01 -0.02 -0.03
-0.04
0
100
200 300 Easting (m )
400
500
Figure 6: Reconstructed 2D Trajectory from LA_LP_1IUG Simulation
It should be emphasized here that the results may be a bit optimistic as some of the errors were not taken into consideration like for example camera and system calibration residual systematic errors.
8. SUMMARY AND FUTURE WORKS Mobile mapping systems are accurate and effective tools for collecting and updating road network feature databases. The concept of mobile mapping can be implemented onboard different platforms including but not limited to vans, trains, and aircrafts. Navigation and pictorial data coming from different platforms are substantially different. Most known platforms are vans and aircrafts yielding to land-based and airborne mobile mapping system. The fusion between the data sets coming from these two systems is of great potential. In this work three major applications were proposed but the emphasis was given to enhancing the navigation solution of land-based system in urban areas. In this research work, a photogrammetric strategy for trajectory reconstruction is presented. The basic idea is to make the strategy more practical in terms of matching entities and required processing efforts. Results, based on simulations, are promising and need to be confirmed by applying the strategy on real data. Our future work will focus on testing the strategy on real data and also to apply optima weighting schemes.
9. ACKNOWLEDGMENTS This study was supported in part by research fund from the Natural Science and Engineering Research Council of Canada (NSERC) and Geomatics for Informed Decisions (GEOIDE), Network Centers of Excellence (NCE) to Dr. Naser El-Sheimy.
10. REFERENCES Cheng, W., Hassan, T. and El-Sheimy, N., 2007. Automatic Road Geometry Extraction System for Mobile Mapping, The 5th International Symposium on Mobile Mapping Technology, Padua Italy Ebner, H., 1976. Self Calibrating Block Adjustment. Bildmessung und Luftbildwesen 44: 128-139. Habib, A., Al-Ruzouq, R. and Kim, C.J., 2004a. SemiAutomatic Registration and Change Detection Using Multisource Imagery with Varying Geometric and Radiometric Properties, XXth ISPRS Congress, PS ICWG II/IV Change Detection and Updating for Geodatabase, Istanbul, Turkey, pp. pp.445. Habib, A., Ghanma, M. and Tait, M., 2004b. Integration of LIDAR and Photogrammetry for Close Range Applications, XXth ISPRS Congress, PS ThS 1 Integration and Fusion of Data and Models, Istanbul, Turkey. Habib, A. and Morgan, M., 2003. Linear Features In Photogrammetry. Invited Paper, Geodetic Science Bulletin, 9 (1): 3-24. Hall, D.L. and Llinas, J., 1997. An Introduction to Multisensor Data Fusion. Proceedings of the IEEE, 85(1): 6-23. Hassan, T. and El_Sheimy, N., 2008. Common adjustment of land-based and airborne mobile mapping system data, The XXI ISPRS Congress, Beijing, China. Hassan, T., Ellum, C. and El-Sheimy, N., 2006a. Photogrammetric Bridging of GPS/INS in Urban Centers for Mobile Mapping Applications, ION GNSS 2006, Fort Worth, Texas, USA. Hassan, T., Ellum, C., Nassar, S., Cheng, W. and El-Sheimy, N., 2006b. Photogrammetric bridging of GPS/INS in urban centers for mobile mapping applications. Proceedings of the Institute of Navigation - 19th International Technical Meeting of the Satellite Division, ION GNSS 2006. Institute of Navigation, Fairfax, VA 22030, United States, Fort Worth, TX, United States, pp. 604-610. Heikkinen, J., 1992. Feature Based Photogrammetry. Hong, L., 1999. Sense your world better: multisensor/information fusion. IEEE Circuits and Systems Newsletter, 10(3): 7-28. Iavaronea, A. and Vagnersb, D., 2004. Sensor Fusion: Generating 3D by Combining Airborne and Tripod Mounted Lidar Data. International Archives of the Photogrammetry, Remote Sensing and Spatial Information Sciences, Vol. XXXIV-5/W10. Lee, I. and Choi, Y., 2004. Fusion of Terrestrial Laser Scanner Data and Images for Building Reconstruction, XXth ISPRS Congress, Commission 5. Istanbul, Turkey. Lee, Y., Habib, A. and Kim, K., 2002. A Study on Aerial Triangulation from Multi-Sensor Imagery, Proceedings of the International Symposium on Remote Sensing (ISRS) Sokcho, Korea. Linder, W., 2003. Digital Photogrammetry, Theory and Applications. springer-verlag, Berlin Heidelberg.