Aug 10, 2009 - 4.4 Real-time digital signal processing . ...... Also note that the discrete Fourier transform is calculated from a limited amount of ...... any other method to desired setup and then the results are tuned so that multirate signal.
HELSINKI UNIVERSITY OF TECHNOLOGY Faculty of Electronics, Communication and Automation Department of Signal Processing and Acoustics
Tapani Pihlajamäki
Multi-resolution Short-time Fourier Transform Implementation of Directional Audio Coding
Master’s Thesis submitted in partial fulfillment of the requirements for the degree of Master of Science in Technology. Espoo, August 10, 2009
Supervisor: Instructors:
Matti Karjalainen Ville Pulkki
HELSINKI UNIVERSITY OF TECHNOLOGY Author:
ABSTRACT OF THE MASTER’S THESIS
Tapani Pihlajamäki
Name of the thesis: Multi-resolution Short-time Fourier Transform Implementation of Directional Audio Coding Date: August 10, 2009 Number of pages: 79 + vii Faculty: Professorship:
Electronics, Communication and Automation S-89
Supervisor: Instructors:
Prof. Matti Karjalainen Docent Ville Pulkki
The study of spatial hearing has been a prominent topic in the acoustical community. Research has also produced new ways for spatial audio reproduction. Recently proposed Directional Audio Coding is one of them. It is a method for processing and reproducing spatial audio. This is done with relatively simple algorithms analyzing the direction of arrival and the diffuseness from a sound signal in B-format form. This analyzed information is then used to synthesize direct sound and diffuse sound separately to produce a representation of the original soundfield which sounds similar to the human listener when compared to the original. These algorithms are based on a few psychoacoustical assumptions. In this thesis, in addition to evaluation of basic algorithms, a few new methods are proposed. These are: the application of multi-resolution short-time Fourier transform, frequency bin based processing, a hybrid decorrelation method and a time varying phase modulating decorrelation method. In informal evaluation, it was found that the use of multiple resolutions increases the quality of sound. Bin based processing, however, did not increase subjective quality. Also, new decorrelation methods did not produce any enhancement compared to the previously established methods. Also, these results were achieved with a great cost in calculation needs and use of alternative methods are recommended for all but the multi-resolution case. As a partial task for this thesis, a software library of Directional Audio Coding was developed. This library enables easy portability and application of Directional Audio Coding method in multitude of situations with a highly parametrized control over the performance.
Keywords: Abstract
i
TEKNILLINEN KORKEAKOULU Tekijä:
DIPLOMITYÖN TIIVISTELMÄ
Tapani Pihlajamäki
Työn nimi: Directional Audio Coding -menetelmän toteutus käyttäen monitarkkuuksista lyhytaikaista Fourier-muunnosta Päivämäärä: 10.8.2009 Sivuja: 79 + vii Tiedekunta: Professuuri:
Elektroniikka, tietoliikenne ja automaatio S-89
Työn valvoja: Työn ohjaajat:
Prof. Matti Karjalainen Dosentti Ville Pulkki
Tilakuulon tutkimus on ollut tärkeä aihe akustiikan alalla. Tutkimus on myös tuottanut tilaäänen toistoon uusia keinoja. Äskettäin esitetty Directional Audio Coding (DirAC) -menetelmä on yksi tuloksista. Se on tarkoitettu tilaäänen prosessointiin ja toistoon. Tämä saavutetaan suhteellisen yksinkertaisella algoritmilla, joka määrittää B-formaatti muodossa olevasta äänisignaalista äänen tulosuunnan ja diffuusisuuden. Käyttämällä näitä tietoja voidaan ei-diffuusi ääni ja diffuusi ääni syntetisoida erikseen ja toistaa alkuperäinen äänikentän niin, että se kuulostaa ihmiselle samalta. Nämä algoritmit perustuvat muutamaan psykoakustiseen oletukseen. Tässä työssä ehdotetaan muutamaa uutta menetelmää sekä arvioidaan vanhoja toteutuksia. Nämä ovat: monitarkkuuksinen lyhytaikainen Fourier-muunnos, laskenta perustuen diskreetteihin taajuusyksiköihin, yhdistelmämenetelmä dekorrelaatioon ja aikamuuttuvasti vaihetta moduloiva dekorrelaatiomenetelmä. Epäformaaleissa testeissä huomattiin, että useamman tarkkuuden käyttäminen paransi äänenlaatua. Diskreettien taajuusyksiköiden avulla laskeminen sen sijaan ei tuottanut havaittavaa etua. Samoin uudet dekorrelaatiomenetelmät eivät parantaneet tulosta aiempiin menetelmiin verrattuna. Lisäksi uusien ominaisuuksien lisääminen lisäsi algoritmin laskennallista vaativuutta merkittävästi. Tästä johtuen vaihtoehtoisia menetelmiä suositellaan kaikissa muissa tapauksissa paitsi monitarkkuusmenetelmän tapauksessa. Osana diplomityötä toteutettiin myös ohjelmakirjasto Directional Audio Coding -menetelmän käyttöön. Tämä kirjasto mahdollistaa menetelmän muuntamisen ja soveltamisen useisiin tilanteisiin ja tarjoaa paljon säätöjä menetelmän toiminnan muokkaamiseen.
Avainsanat: Tiivistelmä
ii
Acknowledgements First and foremost I want to thank my instuctor, Docent Ville Pulkki, who offered me the task for this thesis work and supported by providing new ideas and correcting my misunderstandings. Secondly, my thanks go to the supervisor of my thesis, professor Matti Karjalainen. Although he did not participate that much during my thesis work, it was still comforting to know that his support was there and at the final steps of my thesis work, his help was invaluable. I also want to thank my co-workers Jukka Ahonen, Mikko-Ville Laitinen, Juha Vilkamo, Marko Hiipakka, Marko Takanen and Olli Santala. They provided a lot of friendly support during my work and discussed ideas related to the thesis work. Especially Ahonen, Laitinen and Vilkamo were helpful for their knowledge in Directional Audio Coding. My gratitude goes also to everyone else in the Department of Signal Processing and Acoustics in Helsinki University of Technology. Friendly discussion with them was one of the things keeping me sane during the process.
Otaniemi, August 10, 2009
Tapani Pihlajamäki
iii
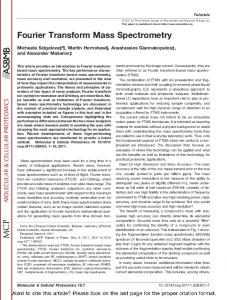
Contents Abbreviations
vii
1
Introduction
1
2
Physics of Sound
3
2.1
Fundamentals . . . . . . . . . . . . . . . . . . . . . . . . . . . . . . . . .
3
2.2
Sound propagation . . . . . . . . . . . . . . . . . . . . . . . . . . . . . .
4
2.2.1
Reflections . . . . . . . . . . . . . . . . . . . . . . . . . . . . . .
5
2.2.2
Reverberation . . . . . . . . . . . . . . . . . . . . . . . . . . . . .
6
3
4
Hearing and Psychoacoustics
7
3.1
Auditory system . . . . . . . . . . . . . . . . . . . . . . . . . . . . . . . .
7
3.2
Psychoacoustics . . . . . . . . . . . . . . . . . . . . . . . . . . . . . . . .
9
3.2.1
Critical bands . . . . . . . . . . . . . . . . . . . . . . . . . . . . .
10
3.2.2
Masking phenomena . . . . . . . . . . . . . . . . . . . . . . . . .
11
3.2.3
Spatial hearing . . . . . . . . . . . . . . . . . . . . . . . . . . . .
12
3.2.4
Pitch, loudness and timbre . . . . . . . . . . . . . . . . . . . . . .
17
Signal Processing
18
4.1
Sound signals . . . . . . . . . . . . . . . . . . . . . . . . . . . . . . . . .
18
4.1.1
Digital signals . . . . . . . . . . . . . . . . . . . . . . . . . . . .
20
Frequency domain . . . . . . . . . . . . . . . . . . . . . . . . . . . . . .
21
4.2.1
24
4.2
Aliasing . . . . . . . . . . . . . . . . . . . . . . . . . . . . . . . . iv
4.2.2 4.3
4.4
5
6
Windowing . . . . . . . . . . . . . . . . . . . . . . . . . . . . . .
25
Digital systems . . . . . . . . . . . . . . . . . . . . . . . . . . . . . . . .
25
4.3.1
Convolution . . . . . . . . . . . . . . . . . . . . . . . . . . . . . .
26
4.3.2
Linearity and time-invariance . . . . . . . . . . . . . . . . . . . .
28
4.3.3
Filters . . . . . . . . . . . . . . . . . . . . . . . . . . . . . . . . .
28
Real-time digital signal processing . . . . . . . . . . . . . . . . . . . . . .
31
4.4.1
Short-time Fourier transform . . . . . . . . . . . . . . . . . . . . .
32
4.4.2
Overlap-add . . . . . . . . . . . . . . . . . . . . . . . . . . . . . .
32
4.4.3
Windowing STFT . . . . . . . . . . . . . . . . . . . . . . . . . . .
32
Sound Reproduction
35
5.1
General idea . . . . . . . . . . . . . . . . . . . . . . . . . . . . . . . . . .
35
5.2
Classical systems . . . . . . . . . . . . . . . . . . . . . . . . . . . . . . .
36
5.3
Modern systems . . . . . . . . . . . . . . . . . . . . . . . . . . . . . . . .
37
5.3.1
Binaural recording . . . . . . . . . . . . . . . . . . . . . . . . . .
37
5.3.2
Head-Related Transfer Function systems . . . . . . . . . . . . . .
38
5.3.3
Crosstalk cancelled stereo . . . . . . . . . . . . . . . . . . . . . .
38
5.3.4
Spatial sound reproduction with multichannel loudspeaker systems
39
Directional Audio Coding
42
6.1
Basic idea . . . . . . . . . . . . . . . . . . . . . . . . . . . . . . . . . . .
42
6.2
B-format signal . . . . . . . . . . . . . . . . . . . . . . . . . . . . . . . .
43
6.3
Analysis . . . . . . . . . . . . . . . . . . . . . . . . . . . . . . . . . . . .
43
6.4
Synthesis . . . . . . . . . . . . . . . . . . . . . . . . . . . . . . . . . . .
46
6.4.1
Virtual microphones . . . . . . . . . . . . . . . . . . . . . . . . .
47
6.4.2
Non-diffuse sound synthesis . . . . . . . . . . . . . . . . . . . . .
48
6.4.3
Diffuse sound synthesis . . . . . . . . . . . . . . . . . . . . . . .
50
6.4.4
Decorrelation . . . . . . . . . . . . . . . . . . . . . . . . . . . . .
52
New propositions . . . . . . . . . . . . . . . . . . . . . . . . . . . . . . .
55
6.5.1
56
6.5
Multi-resolution STFT . . . . . . . . . . . . . . . . . . . . . . . . v
7
8
9
6.5.2
Bin-based processing . . . . . . . . . . . . . . . . . . . . . . . . .
56
6.5.3
Hybrid Decorrelation . . . . . . . . . . . . . . . . . . . . . . . . .
57
Implementation
59
7.1
Design principles . . . . . . . . . . . . . . . . . . . . . . . . . . . . . . .
59
7.2
Design choices . . . . . . . . . . . . . . . . . . . . . . . . . . . . . . . .
60
7.2.1
Overlap-add . . . . . . . . . . . . . . . . . . . . . . . . . . . . . .
60
7.2.2
Multi-resolution STFT . . . . . . . . . . . . . . . . . . . . . . . .
60
7.2.3
Time averaging . . . . . . . . . . . . . . . . . . . . . . . . . . . .
61
7.2.4
Synthesis filters . . . . . . . . . . . . . . . . . . . . . . . . . . . .
63
Results
65
8.1
Multi-resolution STFT . . . . . . . . . . . . . . . . . . . . . . . . . . . .
65
8.2
Effects of bin-based processing . . . . . . . . . . . . . . . . . . . . . . . .
66
8.2.1
Frequency smoothing . . . . . . . . . . . . . . . . . . . . . . . . .
67
8.3
Decorrelation methods . . . . . . . . . . . . . . . . . . . . . . . . . . . .
67
8.4
Efficiency . . . . . . . . . . . . . . . . . . . . . . . . . . . . . . . . . . .
69
DirAC software library
70
9.1
General design . . . . . . . . . . . . . . . . . . . . . . . . . . . . . . . .
70
9.1.1
Functional blocks . . . . . . . . . . . . . . . . . . . . . . . . . . .
71
Parameters . . . . . . . . . . . . . . . . . . . . . . . . . . . . . . . . . . .
72
9.2.1
General . . . . . . . . . . . . . . . . . . . . . . . . . . . . . . . .
72
9.2.2
Multi-resolution STFT . . . . . . . . . . . . . . . . . . . . . . . .
72
9.2.3
Frequency bands . . . . . . . . . . . . . . . . . . . . . . . . . . .
73
9.2.4
Analysis
. . . . . . . . . . . . . . . . . . . . . . . . . . . . . . .
73
9.2.5
Synthesis . . . . . . . . . . . . . . . . . . . . . . . . . . . . . . .
73
Future additions . . . . . . . . . . . . . . . . . . . . . . . . . . . . . . . .
74
9.2
9.3
10 Conclusions and Future Work
75
vi
Abbreviations DFT DirAC ERB FFT FIR IACC IDFT IFFT IIR ILD ITD MRSTFT STFT VBAP
Discrete Fourier transform Directional Audio Coding Equivalent rectangular bandwidth Fast Fourier transform Finite impulse response Inter-aural cross-correlation Inverse discrete Fourier transform Inverse fast Fourier transform Infinite impulse response Inter-aural level difference Inter-aural time difference Multi-resolution short-time Fourier transform Short-time Fourier transform Vector base amplitude panning
vii
Chapter 1
Introduction It has been roughly 132 years since Thomas Alva Edison invented the first sound reproduction mechanism, the phonograph. Through time the technology has evolved significantly and brought new wonders also in audio technology. Gramophone records and two-channel stereophonic transmissions were concurrently introduced and developed through the beginning of 20th century. When Philips introduced Compact Disc at 1979, the dawn of digital form broke. Nowadays, the most common form is digital data in "mp3" files. However, this evolution has happened only for the storage media. Actual sound reproduction paradigm has not changed that much. The most common home system tends to be a medium-sized stereo system offering passable quality. In most cases, the quality of the media is much better than the system can produce. However, during last ten years, multichannel systems have finally started to become more popular at homes, thanks to DVD-movies. However, there are still purists who say that only monaural systems are "pure". Still, there is room for development as the sound reproduction is not yet perfect. One can verify this by going to a music concert and noticing that the experience is on a completely different level compared to any recording. Current multichannel concert recordings come close but do not capture all nuances of the performance. This, however, can be enhanced with the newest technologies and this thesis will focus on one of them called Directional Audio Coding (DirAC). It is a relatively new method proposed only a few years ago but has already received some interest. The groundwork for its algorithms was already created for Spatial Impulse Response Rendering technology.
1
CHAPTER 1. INTRODUCTION The aim of this thesis is to produce a high quality short-time Fourier transform based version of DirAC. As there has been already few implementations of DirAC, the prime solution is to test and apply new algorithms. Also, the aim is to produce a software library which can be easily used in further development of DirAC. This thesis contains ten chapters with this introduction being the first one. Chapters 2– 5 will contain the background knowledge in the areas of physics of sound, hearing and psychoacoustics, signal processing and sound reproduction needed in this thesis. After that, chapters 6–8 describe the DirAC algorithm, its implementation in this thesis and the results. Chapter 9 is dedicated for describing the produced software library and chapter 10 concludes the thesis.
2
Chapter 2
Physics of Sound This chapter dwells in the properties of sound related to physics. First, fundamental properties are studied and then the propagation sound through air is described.
2.1
Fundamentals
Elementary physics state that sound is a movement of particles and changes of pressure in the air. Actually, air is not the only possible conduit. More precisely sound can be defined as longitudinal pressure waves moving through any medium (Rossing et al., 2002). These pressure waves can then be perceived as sound if they arrive to the human ear. Sound waves have two elementary variables which can be used to define the properties of the wave. They are sound pressure p and particle velocity ~u. Sound pressure is the same thing as normal pressure in any fluid but particle velocity might not be that clear. It is not the speed at which the sound wave moves through space but the speed at which wave transmitting particles move in space. Notable is that although particle velocity alternates like the sound pressure, particle velocity also has a direction. There are also a few important constants which depend on the medium through which sound is traveling. These constants are the speed of sound c, the mean density of the medium ρ0 and the characteristic acoustic impedance of the medium Z0 . The medium is usually air at room temperature (20◦ Celsius). In the context of this thesis, this is also assumed and thus kg Ns the constants have following values: c = 343.2 m s , ρ0 = 1.204 m3 and Z0 = 413.2 m3 .
3
CHAPTER 2. PHYSICS OF SOUND With these definitions it is possible to define other useful variables. They are sound intensity ~ sound energy E and diffuseness ψ. Intensity is defined as the product of sound pressure I, and particle velocity (Eq. 2.1) (Fahy, 1989). It describes the net flow of energy through space.
I~ = p~u
(2.1)
Sound energy also depends on the pressure and particle velocity. It is defined with equation
1 E = ρ0 2
�
p2 + k~uk Z02
� (2.2)
(Fahy, 1989) and tells the energy density the sound wave has. Diffuseness is useful to explain well in context of this thesis. Formally it is defined that in a perfectly diffuse field, the energy density is constant in all points within the volume of interest (Nélisse and Nicolas, 1997). What this really means is that with a perfectly diffuse sound, there is no energy transmission and thus no clear direction for the sound wave. Diffuseness can be calculated from the active intensity and energy with equation (Merimaa and Pulkki, 2005)
ψ =1−
~ khIik . hcEi
(2.3)
Here h·i denotes time average and k · k denotes the norm of the vector. This diffuseness value is in range [0, 1] with value of one implying totally diffuse sound and value of zero the complete opposite.
2.2
Sound propagation
Sound propagation through air is not as simple as with light as the particles are much larger and sensitive to the surrounding conditions. This can produce surprising effects like bending of the wave in some situations. However, in controlled situations1 , it is possible to use some assumptions and work with simpler theories. 1
A normal room where the air pressure and temperature are relatively constant is already controlled enough.
4
CHAPTER 2. PHYSICS OF SOUND One method is to model the sound sources with point sources. This means that the source is infinitely small point and radiates waves equally to all directions from it (Fig. 2.1(a)). Due to the symmetry of the wavefront the rising equations tend to be simpler to solve. A second useful simplification is to think that after a long enough distance, the radial wavefront from a point source can be modelled with a simple plane wave (Fig. 2.1(b)). This again effectively reduces complexity.
(a)
(b)
Figure 2.1: (a) Sound radiates evenly from a point source in and (b) after a distance it can be estimated with a plane wave As the sound waves propagate away from the source, the sound energy is divided constantly to a larger area. In free field2 , the sound pressure is inversely proportional to the distance traveled. This means that if distance is doubled then the sound pressure will drop in half.
2.2.1
Reflections
If sound waves come to contact with a surface, one of three things can happen. The sound wave can be reflected, it can be absorbed by the surface or it can transmit through the surface. In most situations all of them happen with varying degrees. Reflections work similarly to light reflections. If the surface is smooth and flat then the reflection is just like from a mirror (Fig. 2.2(a)). On the other hand, if the surface is rough when compared to the wavelength of the sound wave then the reflection will be diffuse and sound wave will spread to all directions from the surface (Fig. 2.2(b)). 2
Free field is a condition where there is nothing hindering the propagation of sound.
5
CHAPTER 2. PHYSICS OF SOUND
(a)
(b)
Figure 2.2: (a) Sound reflects evenly from a flat surface. (b) Sound reflects diffusely from a rough surface.
2.2.2
Reverberation
Reverberation is the combined effect of all reflections in the listening space. As the sound moves from the source to all directions, it will encounter walls and other objects which reflect the sound wave. If the sound waves are measured in one point, a listening point, then usually the sound moving on the direct path from the source to the listening point will arrive first. After that, a number of reflected sound start to arrive. First, only a small number of reflections arrive but the number of arriving reflections rise through time rapidly. If an impulse is sent from the sound source, then the measured sound pressure at one listening point in the room can be seen in Fig. 2.3. As it can be seen, the first arriving sound is the direct sound. Then a small number of independent reflections arrive. This part is called early reflections. After a while, the amount of independent reflections is so large that it is impossible to separate them anymore. This stage is then called late reverberation. Actually, this whole thing is called the room impulse response3 and defines the properties of the room quite well.
Figure 2.3: Sound pressure at the listening point when the space was excited with an impulse.
3
More of impulse responses in chapter 4.
6
Chapter 3
Hearing and Psychoacoustics This chapter will inspect how the hearing sensation functions. First, there will be a quick description of the anatomy and the physiology of the auditory system. After that, a more in-depth review will be performed on the topic of psychoacoustics which focuses on the sensation of hearing. Psychoacoustics in itself is a widely studied subject and can be quite complex to completely understand. In the context of this thesis, only necessary topics will be described in addition to the basic knowledge. A more comprehensive study can be found in a book by Moore (1995b).
3.1
Auditory system
To understand some of the psychoacoustic properties of the human hearing it is necessary to first study the anatomy and the physiology of the ear. A natural way to do this is to follow the path from the outside of the head all the way to the hair cells which finally convert the vibrations to neural impulses. It is wise to refer to the Fig. 3.1 throughout this trip. The trip starts from the outside, from a distance of the head. The sound waves are first affected by the head and the shoulders. The next step is the pinna which acts as a complex resonator modifying the spectrum of the sound based on the direction from which the sound arrives. Then, the sound waves enter the ear canal which is a tube leading to the tympanic membrane. This tube also amplifies some of the frequencies due to the natural resonances. This ends the outer-ear-part of the trip. Next, it is time to move to the middle ear. This is done through the tympanic membrane, or 7
CHAPTER 3. HEARING AND PSYCHOACOUSTICS
Stapes attached to oval window
Malleus Incus
Semicircular canals Cochlear nerve
Cochlea
Eustachian tube Outer Middle
Inner ear
Tympanic membrane External auditory canal
Figure 3.1: A cross section of the human ear. Different parts of the ear can be seen in it. Adapted from Karjalainen (2009).
the ear drum, which is connected to the malleus. The function of the tympanic membrane is to transform the pressure changes in the outer ear to vibrations in the malleus. Malleus is one of the three ossicles, which are three small bones found in the human ear, with incus and stapes being the other two. Stapes is attached to the oval window of the cochlea and incus connects the other two. As a team, ossicles transform the sound-induced-movement of the tympanic membrane to a form which is suitable for entering through the membrane in oval window to the fluid environment of the cochlea. Middle ear also contains the eustachian tube which is important for equalizing the pressure on both sides of the tympanic membrane. The trip now continues to the inner ear. The sound transformed to vibration by the ossicles now enters the cochlea from the oval window and moves towards the helicotrema. A simplification of the cochlea can be seen in Fig. 3.2. The fluid vibrations then excite the basilar membrane. The excitement spot changes smoothly depending on the frequency with highest audible frequencies exciting, or resonating, more at the beginning of the membrane. The resonant frequency then lowers with the distance traveled through the cochlea and the lowest audible frequencies resonate at the end of the cochlea. This place dependency produces the ability to divide the signal to its frequency components. Finally, the vibrations move back to the entry of the cochlea and out through the round window. The trip is almost at end as the basilar membrane has already been excited. With the aid 8
CHAPTER 3. HEARING AND PSYCHOACOUSTICS
Helicotrema Oval window
Bone skirt
Basilar membrane Stapes Round window
Figure 3.2: A simplification of the cochlea. The stapes connect to the oval window through which the sound travels to the cochlea. Sound then travels to the end of the cochlea exciting the basilar membrane on the way. Adapted from Karjalainen (2009).
of a cross section of cochlea in Fig. 3.3, it can be studied in more detail. As the basilar membrane vibrates, the fluids in the Scala media to also move. Inner hair cells then detect this fluid movement and generate neural impulses which then travel a complex path to the cortex to produce the hearing sensation (Goldstein, 2002). Outer hair cells, on the other hand, mainly receive information from the brain and act as a pre-amplifier to enhance hearing. This ends the trip but there is still a one more unexplained part in Fig. 3.1. The inner ear contains a part called semicircular canals which are very important for keeping balance.
3.2
Psychoacoustics
As it was previously mentioned, Psychoacoustics is the study of the hearing sensation. This study is usually conducted through subjective listening tests. Psychoacoustics is also an important topic in the context of this thesis as the algorithms presented later on, are derived based on the psychoacoustic properties of the human hearing. Even though all the following phenomena work together to produce the hearing phenomenon, it is prudent to study them separately. For these following sections, it is necessary to define the concepts of auditory and sound events. Sound events are separate events where sound arrives to the physical part of the
9
CHAPTER 3. HEARING AND PSYCHOACOUSTICS
Re Scala media
iss
ne
r’ s
Scala vestibuli
m
em
Tectorial membrane
br
an
Cochlear nerve fibres
e
Outer Inner hair cells Basilar membrane
Bone skirt
Scala tympani
Figure 3.3: A cross section of the cochlea. Inner hair cells detect the movement of the fluid in scala media caused by the vibration of the basilar membrane and produce neural impulses. Adapted from Karjalainen (2009).
auditory system. Auditory events, on the other hand, are events which are perceived in the cortex.
3.2.1
Critical bands
The frequency resolution of the hearing is usually represented with the concept of critical bands. The idea is that inside one critical band only one auditory event can be perceived. If multiple sound events happen inside one critical band then a combination event is heard instead. Also, the critical band is centered on the sound event instead of being at a constant position. This is quite logical when one remembers that the basilar membrane is indeed a membrane and thus cannot vibrate just in an infinitely small point. There are different schools in how to model the critical bands. A classical critical band is measured as follows. The subject alternates between listening to a narrow band noise and another noise with a variable bandwidth but constant sound pressure level. The subject is then asked to change the variable noise level so that both noise signals sound subjectively equally loud. The result is that when the bandwidth is increased, the loudness first stays 10
CHAPTER 3. HEARING AND PSYCHOACOUSTICS at the same value and after a certain threshold, suddenly starts to increase. This threshold defines the critical band and produces Eq. 3.1 for calculating the bandwidth related to the center frequency (Zwicker et al., 1957).
"
�
∆f = 25 + 75 1 + 1.4
fc 1000
�2 #0.69 (3.1)
This equation was formed based on listening test results. Frequency scale related to this classical method is called Bark scale. An alternative method of defining critical bands is called Equivalent Rectangular Bandwidth (ERB). This method uses masking noise on both sides of a test signal to remove the possibility that hearing reacts to the test signal with hair cells outside the critical band. By changing the bandwidth between masking noises, it is possible to experimentally measure the bandwidth. The bandwidth related to the center frequency is defined as (Glasberg and Moore, 1990)
∆f = 24.7 + 0.108fc .
(3.2)
The corresponding frequency scale, called ERB scale, results in more and narrower frequency bands than the classical Bark scale.
3.2.2
Masking phenomena
Hearing has an interesting property of masking sound events which are near in time or frequency. These are consequently referred as time masking and frequency masking. Time masking can be thought as an envelope (see Fig. 3.4) around each sound event. If another sound event arrives and its loudness is under the envelope of the previous sound event, then it will not be perceived. Similarly, frequency masking can be thought as an envelope in frequency domain (see Fig. 3.5). Again, sound events which fall under the masking envelope of another sound event, will not be perceived. However, frequency masking is also sensitive to the content of the masking signal and the shape of the mask changes quite a lot based on the signal.
11
sound level of test sound / dB
CHAPTER 3. HEARING AND PSYCHOACOUSTICS
80 70 pre60 masking
post-masking
50 unmasked hearing level of the test tone 40 -40
-20
0
0
20
40 60 time / ms
80
100
120
Figure 3.4: The effect of time masking. The shaded area represents the time when the masking sound event is present. In this figure, it is presumed that the masking sound is at least 200 ms long. Adapted from Karjalainen (2009).
sound level of test sound / dB
80 fc = 0.25
60
1
4 kHz
40 20 0 0.05
0.1
0.2
0.5
1
2
5
10
frequency of test sound / kHz
Figure 3.5: The effect of frequency masking with different narrow band noise signals. Notice how the envelope shape changes with the center frequency of the narrow band noise. Different signals have different frequency masks which they produce. With complex music signals, the mask is also complex. Adapted from Karjalainen (2009).
3.2.3
Spatial hearing
The subject of spatial hearing has been studied quite a lot. A comprehensive study can be found for example in Blauert (1997). Another good source is Moore (1995a) in which this section is based on.
12
CHAPTER 3. HEARING AND PSYCHOACOUSTICS Spatial hearing can be divided in two tasks: the localization of sound sources and the perception of spatial impression. Single sound sources are localized with the combination of Inter-aural Time Difference (ITD) cues, Inter-aural Level Difference (ILD) cues and spectral cues. Spatial impression is the impression a listener perceives about the physical properties of the listening (simulated or not) space, like the size, reverberation and envelopment. It is produced as a combination of ILD cues, ITD cues and, in traditional view, Inter-aural Cross-Correlation cues (IACC).
Sound source localization For this section, it is first necessary to explain ITD and ILD properly. Inter-aural Time Difference is defined as the time difference for a sound signal between its entry to the left and the right ear. It is caused by the effect that if sound is not arriving from the median plane, then there is a different distance from the sound source to one ear of the listener compared to the other. As the speed of sound is limited, this directly translates to a time difference. Notable is the fact that hearing analyzes ITD from the signal differently on different frequency ranges. At low frequencies, ITD is directly the phase difference between the waveforms while at high frequencies the delay between the envelopes of the waveforms is used. Inter-aural Level Difference is defined as the level difference of a sound signal on entry to the left and the right ear. This is also caused by the listeners head by attenuating the signal moving to the farther ear. Both of these effects can be seen in Fig. 3.6. Lateral sound source localization is produced primarily by ITD and ILD cues. This process is called the duplex theory (Rayleigh, 1907) and states that on low frequencies, ITD cues are the dominant method of localization and at higher frequencies, ILD cues are dominant. The dividing frequency has been found to be around 1500 Hz (Feddersen et al., 1957). However, it has been found that the strict duplex theory does not hold and ITD cues also affect the perception on the higher frequencies. Still, duplex theory is applicable in certain situations (Hafter, 1984). The combination of ITD and ILD cues are only able to detect where the sound is coming from in left-right direction. To detect successfully up-down and front-back direction, spectral cues are needed. They are direction dependent radical changes1 in the sound spectrum that are produced by the direction dependent filtering of the pinna and reflections from the 1
A radical change here is a dip or spike in the spectrum.
13
CHAPTER 3. HEARING AND PSYCHOACOUSTICS
Figure 3.6: The effect of head to an arriving sound. Signal to the farther ear is delayed and attenuated by the listeners head.
shoulders. This, with the addition of instinctive turning of head towards the sound source, enables full three dimensional localization of sound source direction. Additionally, the hearing has some restrictions in terms of localizing multiple concurrent sound events. The aforementioned frequency resolution in terms of critical bands is one and affects the perception of multiple sound events if they fall on the same critical band. Even more important is the property of summing localization. If multiple sound events arrive close to each other in time (in the range of 0 to 1 ms) then the localization is based on the superposition of those signals based on the inter-aural differences (Blauert, 1997). However, the accuracy of localization is limited and listening tests have shown that the accuracy changes based on the actual source direction. Without further in-depth study, figures for horizontal (Fig. 3.7) and vertical (Fig. 3.8) localization accuracy are presented (Blauert, 1997). Perception of auditory distance, that is the perceived distance to the sound source, has been studied less than the direction localization. Grantham (Moore, 1995a) notes that four cues have been identified for distance perception and they are as follows.
1. Sound pressure level – greater means closer 14
CHAPTER 3. HEARING AND PSYCHOACOUSTICS
90° 80,7° ±9,2° ϕ 179,3° ±5,5°
180°
359° ±3,6°
281,6° ±10°
0°
Direction of sound event Direction of auditory event
270°
Figure 3.7: Accuracy of localization on horizontal plane.
Direction of sound event
δ = 90°
+74° ±13°
δ = 36°
+68° ±22°
+30° ±10° δ = 0° ϕ = 0°
Direction of auditory event
δ = 36° +27° ±15°
0° ±9°
δ = 0° ϕ = 180°
Figure 3.8: Accuracy of localization on vertical plane. Notice that the events are opposite compared to the horizontal accuracy figure.
2. Direct to reverberant energy ratio – greater means closer 3. Spectral shape of the signal at longer distances (over one meter) – more high frequencies means closer 4. Binaural cues at close distances (under one meter) and off the median plane – greater ITD or ILD means closer. However, the evidence for this is inconclusive (Blauert, 1997).
15
CHAPTER 3. HEARING AND PSYCHOACOUSTICS Spatial impression Spatial impression is produced by the localization cues but, in traditional view, is also affected by Inter-aural Cross-Correlation (Blauert, 1997). IACC is the cross-correlation between the signals entering the left and the right ear. In addition to the time difference, it also contains information about spectral differences between signals arriving to the ears. High values of correlation mean that the signal is from a single, accurately localizable source. On the other hand, low values mean that the sound source cannot be localized accurately and the sound seems to enveloping the listener. How this transforms to a spatial impression is that lower IACC values mean that there are multiple versions of the original source signal present. This is exactly what reflections and reverberation is and IACC is thus connected to the spatial properties of the listening space. However, the effect and existence of IACC has been questioned in auditory processing. Instead, a proposal has been made, that the spatial impression is generated from the fluctuation of ITD and ILD cues (Griesinger, 1997). This proposal is important in the context of this thesis as Directional Audio Coding does not assume anything about IACC and still aims to reproduce spatial impression.
Precedence effect Another important topic of spatial hearing is the localization of sound source when there are reflections and reverberation present. With aforementioned localization cues, it would be quite hard to directly localize the sound source accurately as there are usually multitude of reflections present which could simply be new sources. However, hearing has a property of favoring the direction of the first sound from a multitude of similar signals. This property is called the precedence effect (Yost and Gourevitch, 1987). Precedence effect has been studied and it has been found that there is a certain time delay after which the first sound dominates the direction perception. Blauert (1997) presented that, with delays between 1 ms and 30 ms, precedence effect affects the direction perception. If the delay is smaller, then the localization is based on the combination of the signals. If the delay is larger, then a separate echo will be heard. This latter echo threshold is variable and depends on the signal. Impulsive signals have a smaller echo threshold whereas with continuous signals the threshold is larger.
16
CHAPTER 3. HEARING AND PSYCHOACOUSTICS Visual cues Spatial hearing is not defined only by auditory cues. Visual cues have a significant impact on the perceived direction. If the listener can see a clear sound source then there is a tendency that the sound is perceived to come from it if auditory cues do not clearly tell otherwise. This is called the ventriloquism phenomenon. More of this can be found for example in Radeau (1994).
3.2.4
Pitch, loudness and timbre
Pitch, loudness and timbre are important terminology used when discussing hearing. Pitch is the subjective quality of how "high" or "low" the perceived sound is. It is often related to the fundamental frequency of the harmonic sound event but is not always the same. Similarly, loudness is the subjective quality of how "loud" or "soft" the perceived sound is. Again, this value is related to the physical quantity of sound pressure level but is dependent on signal content. The final term, timbre, is a more complex one but is still simply defined as the thing which separates two sound events with the same pitch and loudness from each other. It can be related to the time-dependent spectrum but again does not fully correlate with it.
17
Chapter 4
Signal Processing This chapter presents elementary signal processing theory. This theory is the framework on which Directional Audio Coding, like all signal processing algorithms, is built. Explanations will be based on graphical examples when possible and there will not be any derivation of formulas here. More comprehensive knowledge of signal processing can be found in Sanjit K. Mitra’s book Digital Signal Processing (Mitra, 2006) in which this chapter is largely based on. Another good source for frequency domain processing is the freely available book by Smith (2008a). Also, the explanations are given with audio signals in mind where possible.
4.1
Sound signals
As it was presented in chapter 2, the sound is essentially pressure changes moving through air. If the pressure or any other property is measured in one point depending on the time, then the measurement result is called a signal. For sound, this measurement is performed with a microphone which transforms sound pressure to an electric signal. Alternating pressure is transformed to alternating voltage which is then easy to transmit or modify. Loudspeaker is the inverse pair of a microphone and transforms alternating voltage to alternating pressure. Signals can be inspected with a multitude of representations. The most definitive representation is the mathematical representation where the signal is given as a formula. For example, the formula for a sine wave is shown in Eq. 4.1 and the formula for an ideal
18
CHAPTER 4. SIGNAL PROCESSING square wave is shown in Eq. 4.2.
xsine (t) = A sin(ωt)
xsquare (t) = A
∞ 4 X sin((2k − 1)ωt) π 2k − 1
(4.1)
(4.2)
k=1
These formulas are simple but some of the mathematical formulas are hardly illustrative. Instead, it is much more useful to show a part of the signal as a figure. In Fig. 4.1 a few periods of both aforementioned signals can be seen. This shows a clear representation of the signal which is understandable with a quick look.
Figure 4.1: Four periods of a sine wave (the upper one) and an ideal square wave (the lower one). Both have same amplitudes. A third option of representing signal is to measure a series of time-value pairs which define a discrete sequence of signal values. It is not as accurate as the mathematical representation but proves to be useful like it is shown in the next section. Usually time values are taken (sampled) with a constant step size in time so that there is no need for presenting time value for each pair. Instead the signal is represented as series of values and one value is anchored to a certain time point to define the series fully.
19
CHAPTER 4. SIGNAL PROCESSING
4.1.1
Digital signals
Previously mentioned electric signals are usually dubbed with a term analog signals when they represent changes in some other quantity like the sound pressure in case of sound signals. This term is created from the process how the microphone converts continuous pressure changes to continuous voltage changes in the electric circuit. Thus, the electric voltage is analogical to the sound pressure. The counterpart for analog signals are digital signals. The difference is that when analog signals have infinite time and value resolution, digital signals have a discrete number of time moments where it has a value. Also the number of possible values is limited to discrete steps. One could think that there is no advantage in reducing information by changing it to digital form but there are a lot of advantages. The most important advantage is that the information reduction also reduces space needed to store and transmit the signal. This enables studying and modifying the signal with computers. Another advantage is realized when there is a need to transmit the signal as all transmission lines are susceptible to noise. With a discrete amount of known possible values for the signal, it is possible to create an error correction algorithm which can reconstruct the signal even after it is corrupted by some amount of noise. This effectively equals noise-free signals if the signal can be reconstructed.
AD- and DA-conversion Analog signals can be converted to digital signals by sampling and quantizing the signal. This is called analog to digital (AD-) conversion. This process is illustrated in Fig. 4.2. The inverse process is called digital to analog (DA-) conversion and applies interpolation1 to reconstruct the continuous analog signal from the digital samples. Sampling means that a sample of signal is taken regularly to represent the signal during the time interval called sampling interval. Quantizing then means that there is a discrete amount of possible values which the sample can have. Quantizer rounds the sample’s value to the nearest possible value. This rounding, however, produces some distortion to the signal. In DA-conversion, interpolation tries to invert the process as well as possible by calculating values in between samples from the samples. There are multiple methods to interpolate and they give different results. All in all, it is clear that one of the issues defining digital signal processing system quality is the quality of the AD- and DA-converters. 1
Interpolation is a method of calculating values in between known values using the known values.
20
CHAPTER 4. SIGNAL PROCESSING
Figure 4.2: Sampling and quantization of a sine wave. The upper waveform shows the original sinusoid and the time samples taken from it. The lower waveform is the digital signal received after the time samples are linearly quantized.
Limitations Digital signals, however, have some restrictions. As it was previously mentioned, in ADconversion, values are quantized to discrete possible values. This produces noisy distortion depending on how much the quantized value differs from the original value. Usually, the number of possible values is selected high enough or matched to the signal with various methods to reduce the level of quantization distortion under audible level. Sampling interval also produces a restriction as there is a finite time resolution available. Simply put, information between two consecutive samples is essentially lost and the smallest period possible to represent correctly is the one spanning exactly three consecutive samples. As the frequency is the inverse of the period, this means that the frequency is bound from above. This limit frequency is exactly half of the sampling frequency fs and often called Nyquist frequency. Frequencies higher than this border do not convert correctly to digital domain. More of this will be discussed in section 4.2.1.
4.2
Frequency domain
In previous sections, signals were studied as values depending on time. This representation is also called the time domain representation. 21
CHAPTER 4. SIGNAL PROCESSING In some cases, it is easy to identify the signal from a time domain representation (i.e. sine wave) and estimate its parameters. However, with for example a speech signal (Fig. 4.3), the signal is too complex to be identified by simply looking at the waveform.
Figure 4.3: A sample of vowel /a/ from the word "kaksi" in finnish. Periodicity of the signal can be seen but it would be hard to tell from this form what this signal actually represents. In many cases more information can be seen from the frequency domain representation. In frequency domain representation the signal is presented in a form where the properties of the signal are given depending on frequency instead of time. This representation can be formed from the time domain representation with the aid of Fourier transform. Fourier transform for continuous (analog) signals is defined in Eq. 4.3 and corresponding transform for discrete (digital) signals is defined in Eq. 4.4. Z
∞
X(ω) = F{x(t)} =
x(t)e−jωt dt
(4.3)
−∞
X(k) = Fd {x(n)} =
N −1 X
n
x(n)e−jk2π N dt
(4.4)
n=0
The result is referred as the spectrum of the signal. Note that the frequency domain signal is denoted here with a capitalized letter. This is a convention used widely and will also be used in this thesis. Also note that the discrete Fourier transform is calculated from a limited amount of values called a "block" with a length of N samples. The assumption is that this block repeats in time endlessly.
22
CHAPTER 4. SIGNAL PROCESSING
1.2
1.2
1
1
Amplitude
Amplitude
The assumption behind Fourier transform is that any signal can be represented as a linear combination of sinusoidal signals with different frequencies. In spectrum, the amplitude and phase parameters of the sinusoids are shown depending on the frequency. In audio processing context, the amplitude is often more interesting as human hearing is more sensitive to amplitude than phase.
0.8 0.6
0.8 0.6
0.4
0.4
0.2
0.2
0
0
Frequency
Frequency
0 Amplitude (dB)
Amplitude
1.2 1 0.8 0.6 0.4
−40 −60
0.2 0
−20
Frequency
Frequency
Figure 4.4: Amplitude responses of a sinusoid (up-left), a square wave with a same fundamental frequency as the sinusoid (up-right) and the previous (Fig. 4.3) speech signal (down-left). Lower right figure contains the same speech signal but amplitude axis is logarithmic and thus the amplitude envelope is more clear to see. In Fig. 4.4 the amplitude spectra of the sinusoid, square wave (Fig. 4.1) and speech (Fig. 4.3) signals are presented. The amplitude spectrum is achieved by taking the absolute value from the complex spectrum. As it can be seen, the sinusoid signal has only one non-zero value in the figure as there is only one sinusoid from which the signal is constructed. Square wave, on the other hand, is constructed from multiple harmonic sinusoids with a frequency 23
CHAPTER 4. SIGNAL PROCESSING dependent amplitude and thus there are multiple non-zero values in the amplitude spectrum. The spectrum of the speech signal, however, is more complex. In this case, there is a large amount of sinusoids constructing the signal and individual parameters offers little information. Instead, the amplitude envelope is more interesting. It happens to be so that human hearing recognizes different vowels of speech based on the shape of the amplitude envelope. This envelope is even better seen when the amplitude scale is made logarithmic which is customary with certain signal types. Inverse transforms, which return the signal from frequency domain to time domain, are similarly defined with formulas 4.5 and 4.6.
x(t) = F
x(n) =
−1
1 {x(t)} = 2π
Fd−1 {x(n)}
Z
∞
X(ω)ejωt dt
(4.5)
−∞
N −1 n 1 X = X(k)ejk2π N dt N
(4.6)
n=0
Discrete versions of the Fourier transform are usually called discrete Fourier transform (DFT) and inverse discrete Fourier Transform (IDFT). These transforms are essential in digital signal processing and there exists an especially fast algorithm for calculating them called fast Fourier transform (FFT).
4.2.1
Aliasing
As it was previously mentioned in section 4.1.1, with digital signals, it is impossible to represent frequencies higher than the Nyquist frequency f2s . The problem is that some operations (especially the non-linear ones) produce new frequency components of which some would on higher frequencies than the Nyquist frequency if it was possible. The result is that frequencies larger than the Nyquist frequency will mirror around that border frequency producing an alias. This results in usually unwanted frequency components which are often quite audible. The pre-emptive solution is to ensure that no aliased components are created. However, this is not always possible and aliasing suppression methods have to be applied. These methods, however, are out of the context of this thesis.
24
CHAPTER 4. SIGNAL PROCESSING
4.2.2
Windowing
As it was mentioned in section 4.2, DFT is applied to a block of signal which it presumes to repeat periodically in time. The problem is that, the first and the last samples in the block do not necessarily have values close to each other. This difference or more precisely, discontinuity, can result in radical (and often incorrect) differences in frequency domain representation. To alleviate this problem a window function may be applied to the signal block. This window usually forces both ends of the block near zero and attenuates parts which are far from the center of the block. This removes discontinuities but at the same time, values in the frequency domain become less accurate as some of the frequency resolution is lost. Different window functions have been proposed for use with the DFT. One of the most used window functions is the raised cosine window. Two popular forms of it exist, the Hann window formed with equation �
�
w(n) = 0.5 1 − cos
2πn N −1
�� ,
(4.7)
.
(4.8)
and the Hamming window formed with equation � w(n) = 0.54 − 0.46 cos
2πn N −1
�
They have slightly different properties but essentially perform similarly. They also have useful properties when used in real-time signal processing (further explained in section 4.4.3).
4.3
Digital systems
Digital systems, like the name says, are systems which process digital signals. They can be thought as a black box2 which takes in an input signal x(n), processes it and outputs a processed signal y(n). Essentially, it is only needed to know how the system modifies the signal, not what it actually contains. 2
This theory applies similarly to continuous time analog signals but it will not be discussed here.
25
CHAPTER 4. SIGNAL PROCESSING It happens that there is a sequence of values which defines exactly what the system does. This is called the impulse response of the system and is usually denoted with h(n). It is produced in output of the system when input sequence contains a single value of one at one time moment and after that only zeroes. The Fourier transform of the impulse response is also a special case and called the frequency response of the system and often denoted with H(k). It shows how each frequency component of the input signal is affected when it passes through the system.
4.3.1
Convolution
The output signal of a system can be calculated from the input signal and the impulse response of the system with an operation called convolution. If x(n) is the input signal, y(n) is the output signal and h(n) is the impulse response of the system then
y(n) = x(n) ∗ h(n) =
∞ X
x(i)h(n − i)
(4.9)
i=−∞
is true. Note that formally it is stated that this operation is calculated with all values of the signals, thus the infinite boundaries for the sum. However, usually at least one of the terms is of finite length and thus the boundaries reduce to the values where the product is non-zero. The formula is quite simple but it might be hard to visualize what is really happening. In Fig. 4.5 it can be seen that in convolution one of the signals is inverted in time and then slid over the other one. Result is then achieved by multiplying together values which are at the same time spot and summing the multiplications together. This result is then stored to the spot where the rightmost value of the sliding signal is currently. With finite length digital signals the length of the result is exactly the sum of the lengths of the input signal and the filter impulse response minus one. Convolution in itself is quite complex operation as it requires many multiplications and additions. However, there happens to be a certain advantageous property between convolution and Fourier transform. That is called the convolution theorem and is formulated as
F{x(n) ∗ h(n)} = F{x(n)}F{h(n)}.
26
(4.10)
CHAPTER 4. SIGNAL PROCESSING
Figure 4.5: The calculation of convolution. Two signals (red and blue) are convolved with each other to produce the result signal (green). First one of the signals is inverted in time and then slid over the other signal. At each time moment, the values at same time moment are multiplied and then a sum of the multiplication results is calculated. The result is stored to the position where the first value of the sliding signal is moving.
This means that convolution turns into a multiplication operation in frequency domain. This is also true vice versa and convolution in frequency domain is equal to multiplication 27
CHAPTER 4. SIGNAL PROCESSING in time domain. There is an important note which has to be made here. This equation works exactly like this only with analog signals. With digital signals the corresponding operation is actually circular convolution which is caused by the assumption of DFT that the time domain signal is periodic from the block boundaries. To calculate linear convolution with circular convolution, it is necessary that zeroes are added to the end of the input signal and the filter impulse response before transforms so that their lengths are at least the same as the previously mentioned length of the convolution result.
4.3.2
Linearity and time-invariance
An important property often desired from a digital system is linearity and time-invariance. They are formally defined with Eq. 4.11 for linearity and Eq. 4.12 for time-invariance.
h{ax1 (t) + bx2 (t)} = ah{x1 (t)} + bh{x2 (t)}
(4.11)
y1 (t + t0 ) = x1 (t + t0 ) , when y1 (t) = x1 (t)
(4.12)
What these formulas actually mean is more easy to understand than it might seem. In linear system the impulse response does not change depending on the input signal. In timeinvariant system the impulse response does not change depending on time. When a system is both linear and time-invariant (LTI) then the system’s modifications to input signal are fully known and deterministic which is often desired.
4.3.3
Filters
Digital systems which are specifically designed to change frequency domain properties of the signal passed through them are called filters. They can be thought to work analogically to a real-life water or air filters. Air filters remove larger molecules from air but let the air pass through without effort. Similarly signal filters remove frequency components (like low frequencies) from the signal. As it was specified earlier in section 4.3, the impulse response specifies a system. Fourier transform of the system was called frequency response and is denoted as H(k). Formally, it is defined as a relation of input and output (Eq. 4.13).
28
CHAPTER 4. SIGNAL PROCESSING
H(k) =
Y (k) X(k)
(4.13)
When a transform called z-transform is applied to impulse response instead of Fourier transform then a form similar to the frequency response is received. This form is called the transfer function and can be seen in Eq. 4.14. This form also defines system perfectly and is really useful in digital signal processing. Without further proving3 , it is noted here that frequency response and transfer function are equal when z = ejω . ∞ P
Y (z) = H(z) = X(z)
bk z −k
k=−∞ ∞ P
1−
(4.14) ak
z −k
k=−∞ k6=0
Here bk and ak are the coefficients of the filter. Another form of defining a digital system is the difference equation which is in time domain. It specifies directly how the next output sample depends on the input samples and other output samples. The form of the difference equation can be seen in Eq. 4.15.
y(n) =
∞ X
bk x(n − k) +
∞ X
ak y(n − k)
(4.15)
k=−∞ k6=0
k=−∞
There is a clear relation between the difference equation and the transfer function and they can be calculated easily from each other.
Finite and infinite impulse responses With linear digital systems, there are basically two kinds of filters. The first one is called finite impulse response (FIR) filter. Like the name says, the length of their defining impulse response is finite. This means that with a finite length input signal the output signal is finite length and can be calculated in finite amount of time. Additionally, FIR filters are stable, that is their output does not go to infinity if the input does not contain an infinite value. Only 3
Proofs can be found in for example Mitra (2006)
29
CHAPTER 4. SIGNAL PROCESSING previously mentioned coefficients bk are non-zero in FIR filters and they contain exactly the same values as the impulse response h(k) of the filter. The second kind is called infinite impulse response (IIR) filter. Again, like the name says, the length of the impulse response is now infinite. This property is based on the fact that IIR filters apply recursive filtering. That is, their ak coefficients contain non-zero values which means that other output values affect the current output. The result is that IIR filters often require less coefficients to produce same effects than FIR filters. However, the flip-side is that IIR filters can be unstable as there is an infinite amount of values added together.
Causality One property of digital filters is their causality. Causality means that there cannot be any output from the system before there is an input to the system. Essentially this changes the previous general difference equation (Eq. 4.15) to a causal form
y(n) =
∞ X
bk x(n − k) +
k=0
∞ X
ak y(n − k).
(4.16)
k=1
Causality is a needed property when processing has to be done in real-time as there is no knowledge of future values. The result is that usually this causes also a delay to the system which can be significant with high order FIR filters. However, if the signal is fully known beforehand then it is often prudent to apply non-causal filtering which does not incur delay — also known as zero-phase filtering.
Combined filters If several filters are applied to the signal one after another or in parallel, the composite system has a certain behaviour. If all filters are linear then all normal implications of linearity apply to them. That is, the sequence in which they are applied can be changed and gain can be applied at any stage. Also the transfer functions (or difference equations) of two parallel filters can be added together to receive composite filter with the same end to end response. Cascaded filters combine a bit differently. Their composite filter is achieved when the transfer functions are multiplied together. This means, of course, that a convolution can be calculated between the impulse responses to receive the impulse response of the composite filter. Fig. 4.6 explains this even more clearly. 30
CHAPTER 4. SIGNAL PROCESSING
Figure 4.6: Combination of separate filters. Transfer functions of cascaded filters (upper figure) are multiplied together and parallel filters (lower figure) are added together
4.4
Real-time digital signal processing
Real-time digital signal processing produces some requirements for the digital systems used in the processing. First of all, the term real-time implies that the signal will constantly pass through the system. However, it does not require that there is no delay and no digital system is delay free. The allowed amount of delay is decided on a case to case basis. For example, the audio effects used in live performances produce only low delay for performers to be able to play in rhythm. The second requirement is that the used algorithm should be fast enough so that it can be calculated in the amount of time available. Simple filtering can be done in real-time quite easily with just implementing the difference equations of the filters. More complex systems, on the other hand, usually take advantage of the frequency domain where filtering is generally less tasking to do. However, the use of frequency responses restrict IIR filters out of the picture as their frequency response would also contain an infinite amount of values. Fourier transform in itself is not well suited for processing long (or infinite) signals as the transform takes the whole signal and transforms that. However, there exist methods which utilize both time and frequency domains and they are called time-frequency methods. One widely used and easily implementable method is called short-time Fourier transform and is described in the next section.
31
CHAPTER 4. SIGNAL PROCESSING
4.4.1
Short-time Fourier transform
Short-time Fourier transform functions just like the name says — it takes a short block of time which is then Fourier transformed to receive the frequency domain representation of that block. In this way even a long input signal can be modified quite easily by multiplication in frequency domain. However, there are few things which have to be taken in account so that this "block filtering" works well. Firstly, the input signal block and the filter impulse response should be zero-padded correctly like mentioned in the section 4.3.1. Secondly, the choice of correct time window size is vital. This is because there is a trade-off between time and frequency resolution. Better time resolution transforms to worse frequency resolution and vice versa. This limitation is called the uncertainty principle and is formally defined, for example, in a book by Pinsky (2002). In the context of this thesis it is only necessary to understand that the trade-off exists. Usually the window size is matched to the signal which is processed. Finally, to produce correct results the time domain block results have to be combined together correctly. This is further studied in the next section.
4.4.2
Overlap-add
There are two major ways of performing block convolution correctly: overlap-add and overlap-save. Both give the same results and actually only differ a little. In this thesis, the overlap-add method will be used and that is why only that method is described here. Overlap-add divides signal to smaller non-overlapping blocks and processes these blocks separately. After separate processing, the length of each block is larger than before. To receive the correct result, the current block is added to the position where it resided compared to the beginning of the previous block when it came in as input signal. This whole process is easier to understand from Fig. 4.7 where you can see the whole process done with the aid of frequency domain multiplication.
4.4.3
Windowing STFT
Windowing enhances time accuracy of the processing (and of course takes away some frequency accuracy). It is used for the previously mentioned reasons (see section 4.2.2). However, windowing also causes some restrictions related to the window type and amount of 32
CHAPTER 4. SIGNAL PROCESSING
Figure 4.7: The overlap-add algorithm. Done with the added frequency domain multiplication as it is usually done this way to increase efficiency. Note that also the filter is zero-padded to the correct length. Also, the separate block results are always added to the trail of the previous block.
33
CHAPTER 4. SIGNAL PROCESSING overlap so that overlap-add produces a constant value from the window functions of each block added together. For example with a Hann window, which is a raised cosine window, the correct amount of overlap to receive constant one at the output is 50%. 25% and other division by two cause only constant amplification but problem arises when the overlap is not one of these values. Then the result will vibrate through time and causes an audible tremolo-like effect. More information about different window functions and their correct overlap values can be found in Smith (2008b).
34
Chapter 5
Sound Reproduction This chapter describes the reproduction of sound. The focus will be especially on the spatial sound reproduction as the topic of this thesis, Directional Audio Coding, is also a method for that purpose. This chapter is divided to three sections. The first section explains the general idea in sound reproduction. The second section will describe classical systems which have been used already a long time but do not transmit spatial information that well. Finally, the third section will describe modern systems.
5.1
General idea
The general idea of sound reproduction is, as the name says, to reproduce a previously recorded sound (see Fig. 5.1). The aim and the method of reproduction might vary as there are different needs for a telephone conversation and for a concert recording. As this thesis is focused more on the high quality reproduction, it is prudent to approach sound reproduction from that perspective. The aim of high quality reproduction is to reproduce the recorded sound so that the timbre of the original sound is reproduced without distortion and the spatial information (sound source localization, reverberation and spatial impression) is preserved.
35
CHAPTER 5. SOUND REPRODUCTION
Figure 5.1: The general idea of sound reproduction. First, sound is recorded in a real situation. Then, it is processed with various means and finally sent to various amounts of loudspeakers around the listener. The result is a reproduction of the sound in recorded situation and differs in quality based on the used reproduction method.
5.2
Classical systems
The first sound reproduction system was the phonograph created by Thomas Alva Edison in 1887. It recorded sound on a cylinder which then could be played back. The quality was not that good in modern standards but it was ground breaking invention nonetheless. In terms of sound reproduction, it was a monophonic system producing one sound source to the listener. That means that there is a microphone recording the sound and one loudspeaker reproducing the recorded sound. With a monophonic system, the timbre of the recorded sound can be reproduced quite well. However, the spatial information is lost with the use of only a single channel. Thus, this is not high quality reproduction but is well suited for some applications like telephone. Later on, a better method of sound reproduction was invented. It is called stereophonic sound reproduction. The formal idea is to use stereographic projection for encoding the relative positions of the sound events recorded. This is done by placing two microphones in a certain positions relative to each other1 for recording two audio channels. Resulting twochannel signal can be reproduced with number of loudspeakers but the two-loudspeaker version is the most popular one and usually referred as stereo. First stereo transmissions were made already at the late 19th century and it is still the dominant choice of sound reproduction. In terms of quality, stereo also preserves the timbre of the recorded sound 1
There are different position setups which have their own advantages and disadvantages.
36
CHAPTER 5. SOUND REPRODUCTION quite well but additionally preserves some of the spatial information and thus is generally more pleasant to listen to. During technology development of loudspeakers, a lightweight portable version of them was created which is called headphones. Currently, different kinds of headphones are in popular use with portable players. Even though headphones can produce quality sound, they have a problem when compared to conventional loudspeaker systems. The stereo sound listened with headphones does not have the same spatial quality as with loudspeakers. Instead, the sound is perceived to come from inside of the head between the ears which can be annoying.
5.3
Modern systems
As monophonic systems already reproduced the timbre of the recorded sound quite well, modern systems tend to focus on providing a better reproduction of the spatial information of the recorded sound. This is achieved with quite varying methods.
5.3.1
Binaural recording
In binaural recording, the sound is recorded with two microphones placed to the ears of an artificial or a real head. This recording can then be reproduced with headphones so that the recorded left and right ear signals go to the corresponding speakers of the headphones. The advantage is that the head used for recording modifies the sound signals similarly as the listeners head would modify in the real situation. This means that the spatial information is "coded" to the two recorded sound signals. The results, however, vary. First of all, the quality of the reproduction depends greatly on that how well the head used in recording matches the head of the listener as otherwise the "coding" produced by the head is different and may produce weird results. Also, the quality is affected by the headphones used for reproduction. Finally, to reproduce the sound correctly, the sound pressure would have to measured on the tympanic membrane and the reproduced so that the sound pressure is exactly reproduced at the tympanic membrane. However, this is not yet possible. Still, when everything matches well, the reproduction can preserve the spatial information and timbre quite well. Still, there exists one problem with this system. The binaural record37
CHAPTER 5. SOUND REPRODUCTION ing is done with the head still in one position. This means that reproduction on works correctly if the listener also stays still as otherwise the conflict of moving head and the heard sound not positioning accordingly can reduce the perceived quality significantly.
5.3.2
Head-Related Transfer Function systems
Head-Related Transfer Function (HRTF) (Møller et al., 1995) systems are based on the same principle as the aforementioned binaural recording. The difference is that instead of recording using a head, the transfer functions of the head (artificial or real) are measured and used as filters to process recording of the original sound. The result can be exactly the as with binaural recording but using HRTFs has its advantages. As HRTFs are essentially just digital filters, it is possible to modify them or use them with different ways. One example is to track the head of the listener and use HRTFs accordingly so that the sound scene "stays still" even though the head is turned. This effectively removes the problem which was mentioned earlier in the binaural recording section.
5.3.3
Crosstalk cancelled stereo
Crosstalk cancelled stereo is a special application of binaural signals. Instead of using headphones for reproduction, two loudspeakers are used. The problem is that the two signals in binaural signals are meant to be divided strictly: one for the left ear and one for the right ear. However, with distant loudspeakers, these signals will mix and the result is not the intended one. This unwanted mixing of signals is called crosstalk. It is possible to remove it and this process is called crosstalk cancellation (Kirkeby et al., 1998). In this method, the crosstalk from the right loudspeaker to the left ear is cancelled by sending a inverted signal with a exact amount of delay from the left loudspeaker. Of course this inverted would then cause crosstalk to the right ear so it must be again cancelled. Using attenuating canceling signals, it is possible to dampen almost all crosstalk. Crosstalk from the left loudspeaker to the right ear is, of course, cancelled with the same scheme. The result is on par with aforementioned binaural technologies when the listener is at the sweet spot. The problem is that this reproduction scheme only works well at the small sweet spot.
38
CHAPTER 5. SOUND REPRODUCTION
5.3.4
Spatial sound reproduction with multichannel loudspeaker systems
Multichannel loudspeaker systems use, just like the name says, multiple loudspeakers to reproduce the sound. Generally, this term has been used for systems using more than two loudspeakers. The general advantage of using more loudspeakers is that it allows the spatial information to be reproduced more faithfully. Multiple loudspeakers are often used in a standardized layout. One of these (and the most popular in domestic use) is 5.1 which utilizes five surrounding loudspeakers and one (.1) low frequency loudspeaker. In this case three loudspeakers are at front with azimuths −30o , 0o and 30o and two "surround" loudspeakers are at the sides with azimuths of −110o and 110o . Other popular layouts include 6.1 (addition of center back loudspeaker), 7.1 (two back surround speakers more) and in movie theaters, 10.2.
Systems utilizing the standardized layouts Commercially most successful have been the surround sound systems which employ the aforementioned standardized loudspeaker layouts. Dolby, DTS and Sony are the most prominent developers in this area and provide proprietary (and widely used) formats for multichannel loudspeaker layouts. The general idea is to record or mix the sound so that it uses the surrounding loudspeakers to produce an enveloping reproduction of the recording. In terms of quality, the spatial information is transmitted much better when compared to the stereo. However, the loudspeakers have to be positioned correctly for the reproduction to work well.
Ambisonics Ambisonics (Gerzon, 1985) takes a bit different approach to the sound reproduction scheme. It aims to capture the complete sound field at a single position with a highly directional microphone array and then to reconstruct that sound field with a two- or three-dimensional array of loudspeakers. The theory of this method is based on the Huygens’ principle (Longhurst, 1967). The resulting reproduction is theoretically at the sweet spot high quality as the sound field is reproduced. However, the problem is that the signals for loudspeakers are coherent when compared to each other. This produces comb-filter effects and localization of sound to the nearest loudspeaker due to the precedence effect when listened to in off 39
CHAPTER 5. SOUND REPRODUCTION sweet spot. When combined with the fact that the sweet spot is relatively small, this can degrade the perceived quality of the reproduction.
Wavefield synthesis Wavefield synthesis (AES Staff, 2004) is another approach to reconstruct the sound field. Instead of a single position, which was the aim of Ambisonics, wavefield synthesis aims to reproduce the sound field for a larger area which is usually the whole listening room. This is again based on the Huygens’ principle (Longhurst, 1967) and done with large amount of carefully equalized loudspeakers in an array. The quality of the reproduction is theoretically good and offers an unique ability of creating virtual sound sources inside the room. The problem is that the loudspeakers need to be closely spaced for a good reproduction of high frequencies. Also, the recording and transmission of sound for wavefield synthesis is a complex task as there are quite a lot of separate sound channels used.
Vector Base Amplitude Panning Vector Base Amplitude Panning (VBAP) (Pulkki, 1997) is a method for positioning virtual sources. It is a generalization of panning for any two- or three-dimensional loudspeaker setups. This panning can be applied to synthetic sounds or recorded sounds and produces as sharp sound source localization as possible with current loudspeaker configuration and amplitude panning methods. If multiple virtual sources are produced with VBAP, then it is possible to simulate some recorded situation like for example a classical orchestra. Three-dimensional panning is done by presuming that all used loudspeakers are on a sphere centered at the listening point. If this is not the case, then delay and amplitude compensations have to be applied. This sphere is then divided to non-overlapping triangles with a loudspeaker in each corner of the triangle. The three loudspeakers in the triangle are then used to produce virtual sound sources which are located in the area of the triangle. This is done using equation
h i g1 p~ = L~g = ~l1 ~l2 ~l3 g2 . g3
(5.1)
Here, p~ is the unit vector pointing towards the virtual source, ~ln are the unit vectors pointing 40
CHAPTER 5. SOUND REPRODUCTION to the loudspeakers of the triangle and gn are the corresponding gains of the loudspeakers. To solve the gains for a virtual source positions, matrix L is inverted and equation
~g = L−1 p~
(5.2)
will be received. These gains are then normalized with equation
X
gi2 = 1
(5.3)
i
so that constant sum of energy is achieved independent of direction. The two-dimensional case differs in that instead of a sphere, the loudspeakers are on a circle and non-overlapping sets of two loudspeakers are used. These reduces the equation 5.1 to form " # h i g 1 p~ = L~g = ~l1 ~l2 . g2
41
(5.4)
Chapter 6
Directional Audio Coding Directional Audio Coding (DirAC) is a recently proposed method for spatial sound reproduction (Pulkki, 2007). It offers a method of analyzing and synthesizing spatial audio based on psychoacoustic assumptions. Basic theory was founded in the SIRR (Spatial Impulse Response Rendering) research (Merimaa and Pulkki, 2005) and Directional Audio Coding is essentially a further developed version of it which is capable of processing any audio signal instead of impulse responses. In this chapter, there will first be a basic explanation of the DirAC algorithm. Then, different parts will be explained separately. Finally, at the end of the chapter, new propositions to the algorithm will be presented.
6.1
Basic idea
Directional Audio Coding algorithm is divided to two parts, analysis and synthesis. Analysis part analyzes a B-format signal (or any other signal which can be converted to B-format) in frequency bands for the direction of arrival of the sound and the diffuseness of the sound. This information can then be transmitted as meta-data with the audio signal. In synthesis transmitted meta-data is used as parameters to synthesize separately the non-diffuse sound and the diffuse sound which are then combined to produce an image of the original spatial sound. This algorithm has been developed using a few fundamental psychoacoustic assumptions (Pulkki, 2007). 42
CHAPTER 6. DIRECTIONAL AUDIO CODING • The direction of arrival of the sound transforms into ILD, ITD and monaural localization cues. • The diffuseness of sound transforms into interaural coherence cues. • Timbre depends on the monaural spectrum and the ITD, ILD and interaural coherence cues. • The direction of arrival, diffuseness and spectrum of the sound measured in one position with the temporal and spectral resolution of human hearing determines the auditory spatial image the listener perceives
The algorithms described in this chapter are directly based on these assumptions. The key idea is that if the cues presented in the first three assumptions are reproduced faithfully with the temporal and spectral resolution of human hearing then the perceived spatial image is similar to the original scenario.
6.2
B-format signal
As the B-format signal is the chosen form for audio in DirAC, it is useful to describe it well. B-format is the natural signal format produced by a soundfield microphone and used extensively in Ambisonics (see chapter 5.3.4). There are different orders of B-format signals but the most common one (and the one used in DirAC) is the first order B-format constituting of four channels. These channels are produced with microphones which in order are: an omnidirectional microphone producing signal W and signals from three figure-of-eight microphones pointing towards front, left and up producing signals X, Y and Z correspondingly. Usually, the W signal is scaled with √12 .
6.3
Analysis
DirAC analysis is performed to estimate the direction of arrival and the diffuseness of a sound signal. These values can be estimated from the intensity and the energy of the sound signal. The estimation process can be performed equivalently in time domain or frequency domain. As this thesis concentrates on the STFT approach it is logical to present the frequency domain versions of the equations here.
43
CHAPTER 6. DIRECTIONAL AUDIO CODING
Frequency Domain B-format signal
W X Y
Short-time Fourier Transform
Direction of Arrival Estimation
Meta data θ(k,t) φ(k,t)
Calculate Intensity
Z Time Averaging Calculate Energy
Time Averaging
Diffuseness Estimation
ψ(k,t)
Figure 6.1: Block diagram of a STFT-based DirAC analysis.
A block diagram of the DirAC analysis can be seen in Fig. 6.1. This section will move through the diagram from left to right. STFT DirAC analysis begins with dividing the Bformat signal to time blocks and transforming them to frequency domain. After this, the actual analysis process begins. Direction of arrival and diffuseness are estimated based on energetic analysis. The theory was already established in Merimaa and Pulkki (2005) and Pulkki and Merimaa (2006) and finalized for DirAC in Pulkki (2007). To do the estimation, first, it is mandatory to estimate the instantaneous active intensity and energy. Like it was presented in chapter 2.1, intensity and energy can be calculated from sound pressure and particle velocity (equations 2.1 and 2.2). With B-format signal, the omnidirectional W signal can be used as a pressure estimate and the figure-of-eight signals X, Y and Z can be converted to directional particle velocity estimates. Formally, this can be put to equations (equations 6.1, 6.2 and 6.3).
P (k) = W (k)
(6.1)
~ 0 (k) = X(k)ˆ X ex + Y (k)ˆ ey + Z(k)ˆ ez
(6.2)
~ (k) = √ 1 X 0 (k) U 2Z0
(6.3)
Here eˆx denotes an unit vector to the corresponding direction. k is used to denote the ~ 0 to frequency band here. Signals X, Y and Z are combined to a single vector signal X 44
CHAPTER 6. DIRECTIONAL AUDIO CODING simplify further equations. If these equations are placed in the aforementioned intensity and energy equations we get equations 6.4 and 6.5. n o 1 ~ ~ 0 (k) I(k) =√ < W (k)∗ X 2Z0
(6.4)
" # ~ 0 (k)|2 ρ0 |X 2 E(k) = |W (k)| + 2 2Z02
(6.5)
Note that only the active intensity is desired and thus the real part is used. Now it is possible to do the estimation for the desired variables. The direction of arrival can be estimated from the active intensity vector. This is done by assuming that the sound comes from the exactly opposite direction compared to the active intensity vector. DirAC uses azimuth θ and elevation ϕ to define the direction of arrival so to estimate these angles from the active intensity vector, equations 6.6 and 6.7 will be used.
−1
θ(k) = tan
�
−Iy (k) −Ix (k)
�
−Iz (k)
(6.6)
ϕ(k) = tan−1 q Ix2 (k) + Iy2 (k)
(6.7)
Ix here is the magnitude of the x-component of the intensity vector which is formally the dot product Ix = I~ · eˆx . Other components are calculated similarly. Diffuseness can be estimated from the intensity and the energy of the signal like it was presented in Eq. 2.3. By substituting equations 6.4 and 6.5 to that, the diffuseness equation √ ψ(k) = 1 −
~ 0 (k)}k 2k