Multi stage attack Detection system for Network Administrators using Data Mining Rajeshwar Katipally, Wade Gasior
Xiaohui Cui
Li Yang
Applied Software Engineering Group
Dept.of Comp. Sci. and Eng., University of TN at Chattanooga
University of TN at Chattanooga
Computational Science and Engineering Division
735 Vine Street,
Oak Ridge National Laboratory
Chattanooga,TN 37403,USA
Chattanooga,TN 37403,USA
Oak Ridge, TN, USA
[email protected]
[email protected] [email protected]
[email protected]
Dept.of Comp. Sci. and Eng.,
ABSTRACT In this paper, we present a method to discover, visualize, and predict behavior pattern of attackers in a network based system. We proposed a system that is able to discover temporal pattern of intrusion which reveal behaviors of attackers using alerts generated by Intrusion Detection System (IDS). We use data mining techniques to find the patterns of generated alerts by generating Association rules. Our system is able to stream real-time Snort alerts and predict intrusions based on our learned rules. Therefore, we are able to automatically discover patterns in multistage attack, visualize patterns, and predict intrusions.
Categories and Subject Descriptors C.2.0 [computer-communication networks]: Security and protection.
General Terms Security.
Keywords: Multistage attacks, Intrusions, Visualization.
1. INTRODUCTION Over the years many IDSs have been developed to help network administrators to control the network traffic and detect bad hosts. Even after deploying these IDSs, network administrator’s job has not become easy due to the large amounts of alerts generated by them. Those alerts may have false detections, which makes the job harder [1]. Using the alerts generated by these systems, it is not possible to detect
735 Vine Street,
multistage attacks [6], by which many websites are being affected. To detect or stop potential attacks there is a necessity to detect anomalous behavior from existing patterns, so that we can predict the future actions by the attackers. To find the sequential patterns we need to analyze IDS alerts using data mining techniques. In this paper, we are going to present a technique including the visualization of multistage attacks that enables network security analysts to detect multistage attacks and stop them from being effective. Our system detects the multistage attacks by applying some data mining techniques on large number of alerts produced by Snort IDS [12]. As we have two methods, anomaly detection and misuse detection, to detect intrusions [8]. We have considered anomaly detection, due to its ability to detect novel attacks [10]. Our system aims to discover temporal pattern of attackers’ behaviors, which is profiled using a rule generation algorithm. Our system uses a simple interface to display the behaviors of attackers.
2. BACKGROUND AND WORK
RELATED
There have many researches been done to analyze large amounts of IDS alerts, detect multistage attacks and to visualize them. Mathew et al. [6] have developed a technique to understand multistage attacks using attacktrack based visualization of heterogeneous event streams. They have used event correlation to find the multistage attack, but event correlation considers every occurred event to find the relation between the alerts, which is sometimes not effective due to false detection by IDS. There are many techniques to reduce the large set of IDS alerts by considering only alerts, which generated frequently. In [1] Koike and Ohno have done exceptionally well to visualize the alerts in order to find the false detection. Though they have considered only essential data to visualize there is a need to analyze them further to make it more useful for network administrators in finding future attacks. Where as in [2], they have grouped alerts on temporal basis, as it is totally focused on archiving snort alerts, further analysis has to be done to detect multi stage attacks. The works in [3], [4] and [5] have done well to visualize essential events
from large set of alerts considering different information from each alert using different techniques such as trees and graphs. None of them concentrated on temporality, the flow of the alerts and source and destination at a time. In [8], [9] they have showed, by applying data mining techniques on these alerts, how can we generate patterns effectively with credibility for future use. We were motivated by [8][9][10] to use data mining techniques to find the rules and patterns by considering essential features from each alert. Lee and Stolfo [10] have used data mining techniques to find user behavior by considering system calls to develop Host based Intrusion Detection system (HIDS).
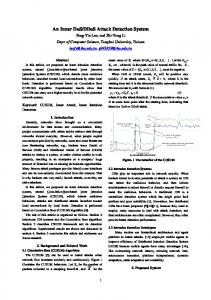
2. ARCHITECTURE Our multistage attack detection system, which is based on alerts generated by Snort, one of the widely used open source IDS, has a simple architecture shown in figure 1 with four steps as Generation of Snort alerts, clustering and Association rule generation, profiling attacker’s behavior and finally the prediction and visualization of multistage attacks. 1. Generating and parsing Snort alerts
4。Predicting and Visualizing of multistage attacks
2。 Clustering and rule generation
3。 Profiling attackers’ behaviors
Figure 1. Architecture of Multi stage attack detection system. Since Snort IDS generates thousands of alerts in small time period [12], it is hard to find which alerts lead to a serious attack in the future. The process of analyzing those generated alerts by applying data mining techniques to find multistage attacks is the key of our system. Our Intrusion Detection System is based on the alerts generated by snort and association rules created by the Apriori algorithm [11],[13]. The outcome from the third step is the basis for our system’s interface where we visualize potential multistage attack to make administrators’ job easier.
3. ALERT ANALYSIS We mine association rules from Snort [12] alerts, to discover behavior patterns of attackers which are useful to detect multi-step intrusions. The main aim to analyze Snort alerts further by extracting essential features is to find the patterns of attacks and eventually to record the behavior of each attacker. Alerts generated by Snort helps to profile behavior patterns based on the sequences of alerts. The knowledge base built from patterns of attacker behaviors help to detect and predict intrusions in real-time. We will use temporal association rules to learn sequences of a user behavior. This effort attempts to capture attackers who use one attack to prepare for another one. This would help us to predict future attacks. For simplicity and clarity, Alert analysis is divided into four steps.
3.1 Generalization of Snort Alerts Snort generates thousands of alerts in just a small amount
of time, with each alert having less significant information. It is very important to analyze them and convert them into a generalized form by considering only essential attributes such as source and destination IP address, source and destination port numbers, destination port number, time stamp of the alert and the type of the alert. The dataset we produced have generated to build our basic model consists of around 3GB of network traffic, out of those millions of packets we could generate 150K snort alerts of size 63MB . As we need to extract common details in each alert, less significant information details such as protocol information should be ignored. After extracting common and essential attributes, 150K alerts were reduced to 3K in number and 360KB in size. A sample alert is in the format (Attack type, timestamp, Source IP, Source port, Destination IP, Destination port) mentioned above. The following is an example of our Snort alert: (portscan)TCPPortscan , 07/17-10:03:27.114495, 192.168.101.66,3387, 192.168.101.54,4497.
3.2 Grouping of Similar Alerts We chose to group similar alerts together on temporal basis. We assume that alerts are similar if they share the same Source IP address alert type and occur in a specific and short time span. This approach is different from the one in [8], where he groups all the alerts with same source. Our approach is effective in eliminating false detections and also to find sequential pattern of attacks on temporal basis, which plays significant role in finding potential multistage attacks. After the grouping has been done, we have added two more columns to alerts one as count, the number of alerts grouped together, and the other one is the behavior code to help while visualizing the alerts. The behavior code indicates similarity of current alerts with other alerts, which help to cluster similar alerts. A sample alert after grouping looks like the one below. 192.168.101.56,192.168.72.1,07/1710:59:06,ETSCANNMAP,70,50 As we have taken one second as the time span to group alerts, we could keep essential alerts intact and reduce the number of alerts at the same time.
3.3 Association Rule Generation: Now that we have reduced the alert list by eliminating non essential information, our task is to find the sequential patterns. We still might have some false detection, which can mislead us to take some action, we need to eliminate them and find the sequential patterns. To find patterns Association algorithm is the most efficient and easy approach. The Apriori algorithm, we applied to generate association rules for each host, does some calculation based on the sequential events and gives us best of all rules. 1) PORTSCAN -> SNMPattack 2) PORTSCAN -> SNMPattack -> ETSCANNMAP 3) PORTSCAN -> ETSCANNMAP To describe how Association rules would help us in finding the potential future attacks, As we have three probabilities to predict from, once we encounter a PORTSCAN attack, in the next step the attacker can go for either SNMPattack or ETSCANNMAP. Based on available rules we can predict the future step of an attacker and stop it from being effective.
3.4 Calculation of Support and Confidence During real-time discovery, we utilize the learned rules in our knowledge base so that we can still discover and predict behaviors of attackers. We used support and confidence as our metrics to find how reliable and frequent a rule is. Support and confidence are two parameters for measuring the rule interestingness. The confidence value is a measure of or belief in the association rule which represents the certainty, reliability, or accuracy of the rule. Han [13] defines the support of an association pattern as the percentage of task-relevant data tuples for which the pattern is true. Support and Confidence can be calculated as follows. support(X -> Y) = p(X∪Y) confidence(X -> Y) = p(Y)/(X). The support and confidence values are compared against thresholds. A rule will be of interest if both is support and confidence values fall above minimum support and minimum confidence thresholds We set our own values for support and confidence to eliminate non essential rules, which would give us a set of rules to record attackers’ behavior. For example, we calculated support and confidence for the rules we listed above. 1) PORTSCAN -> SNMPattack support(0.29) confidence(0.40) 2) PORTSCAN -> SNMPattack -> WEBATTACK support(0.14) confidence(1.0) 3) PORTSCAN ->WEBATTACK support (0.14) confidence (0.20)
Each rule has different support and confidence value. If we set minimum support as 0.20 and confidence as 0.30 as thresholds, we can eliminate third rule and the remaining rules would be used as the behavior of the attacker.
4. IMPLEMENTATION Considering the sensitive details, the implementation is a quite challenging one. The data available to us contains various network attacks including multistage ones. This comprehensive dataset was provided to us by a research sponsor. The alerts that provided inputs to the system are Snort intrusion detection system. We have used Java technology to implement data mining algorithms, where as to visualize multistage attacks we have used Adobe flex along with Java script.
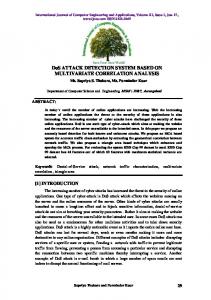
5. VISUALIZATION Multistage attack detection system, shown in figure 2 is the interface through which network administrator can detect multi stage attacks based on the behavior prediction. Our interface has an option to load required alert data to predict the behavior of each host in that list. Each host represented using a node, on the bottom left we have a field to show the predicted behavior of selected host based on the previous action. In Figure 2 for the host 192.168.101.68 on right hand side, alerts are displayed in upper part of the left side and predicted behavior of the host is displayed below them. We could also choose any alert file and any of filters.
Figure 2. Multistage attack detection system interface.
5. CONCLUSION AND FUTURE WORK Our system is efficient in predicting and visualizing potential multistage attacks. The experimentation results are quite outstanding in predicting the potential multistage attacks. Our stem is basic but effective, there is a room to improve the performance of the system by modifying the algorithms we applied. Now that we have developed a system that can predict multistage attacks, our aim is to improve the performance of the system, to add more features to find novel attacks.
6. ACKNOWLEDGEMENTS This work is partially supported by grants from Tennessee Higher Education Commission's Center of Excellence in Applied Computational Science and Engineering and Oak Ridge National Laboratory
7. REFERENCES [1]. Hideki Koike, Kazuhiro Ohno, SnortView: Visualization System of Snort Logs, Proceedings of the 2004 ACM workshop on Visualization and data mining for computer security, Washington DC, USA, 2004. [2]. Soleimani M., Khosrowshahi E., Doroud M., Damanafshan M., Behzadi A., Abbaspour M., A Reliable Analyzer and Archiver for Snort Intrusion Detection System, Proceedings of the 2007 ACM symposium on Applied computing, Korea, 2007. [3]. Patrick Hertzog, Visualizations to improve reactivity towards security incidents inside corporate networks, Proceedings of the 3rd international workshop on Visualization for computer security, Alexandria, Virginia, USA, 2006. [4]. Shabtai, Klimov, Shahar, Elovici, An intelligent, interactive tool for exploration and visualization of timeoriented security data, Proceedings of the 3rd international
workshop on Visualization for computer security, Alexandria, Virginia, USA, 2006 [5]. Mansmann, Fisher, Keim, North, Visual support for analyzing network traffic and intrusion detection events using TreeMap and graph representations, Proceedings of the Symposium on Computer Human Interaction for the Management of Information Technology, Maryland, USA, 2009. [6]. Mathew, Giomundo, Uoadhyaya, Sudit,Slotz, Understanding multistage attacks by attack-track based visualization of heterogeneous event streams, Proceedings of the 3rd international workshop on Visualization for computer security, Virginia, USA, 2006. [7]. Abdullah, Copeland, Tool update: high alarm count issues in IDS rainstorm, Proceedings of the 3rd international workshop on Visualization for computer security, Alexandria, Virginia, USA, 2006. [8]. Wenke Lee, Applying data mining to intrusion detection: the quest for automation, efficiency, and credibility, ACM SIGKDD Explorations Newsletter, December, 2002. [9]. Dokas, Kumar, Lazarevic, Srivastava, Tan, Data Mining for Network Intrusion Detection, USA, 2004. [10]. Anup K.Ghosh, Aaron Schwartzbard and Michael Schatz. Learning Program Behavior Profiles for Intrusion Detection. Proceedings of the 1st conference on Workshop on Intrusion Detection and Network Monitoring, Santa Clara, California, 2002. [11]. Pang-Ning Tan, Michael Stenbach, Vipin Kumar. Introduction to data mining. Pearson Addison Wesley. 2006. [12]. The snort. http://www.snort.org. [13].JiaweiHanand Micheline Kamber, Data mining concepts and techniques. Academic Press, San Diego, California, 2001