Highest Intra-Cluster Similarity. Shoban babu Sriramoju. Associate Professor, Department of CSE, Varadha Reddy Engineering College, Warangal, Andhra ...
ISSN(Online): 2320-9801 ISSN (Print): 2320-9798
International Journal of Innovative Research in Computer and Communication Engineering (An ISO 3297: 2007 Certified Organization)
Vol. 2, Issue 3, March 2014
Multi View Point Measure for Achieving Highest Intra-Cluster Similarity Shoban babu Sriramoju Associate Professor, Department of CSE, Varadha Reddy Engineering College, Warangal, Andhra Pradesh, India
Abstract- Clustering is one of the data mining techniques which has important utility in real time applications. Cluster is a group of objects with highest similarity. The result of clustering can be used further in many applications including query processing. Clustering can also be used in text mining. The clustering algorithms that are available in this domain uses single viewpoint to find the similarity between object. But, the singe view point similarity measure cannot have highly informative assessment of similarities. In this paper we propose to implement a novel measure known as multiviewpoint based similarity measure. It will consider multiple-viewpoints while measuring similarity which facilitates highly informative assessment of similarity. We built a prototype application to demonstrate the conceptual proof. The empirical results revealed that the measure is effective. Keywords – Multi viewpoint based similarity measure, Data mining, text mining, single viewpoint I.
INTRODUCTION
Data mining is the domain which deals with discovering knowledge from databases. One of the data mining techniques available is clustering. The clustering is used to group objects similar. Clustering is very popular algorithm that has utility in real time application development. Intelligent decision systems can be used to cluster the available data objects in order to make well informed decisions. Search engines like Google in the real world also use clustering mechanism to group documents so as to speed up query processing. Basically clustering is of two types namely partitional clustering and hierarchical clustering. In this paper the focus on the partitional clustering algorithm. With respect to clustering algorithms, the K-means is one of the algorithms that produce clusters [2]. K-means algorithm takes given dataset and number of clusters as input and generates clusters. It is used in many real world applications. For instance it is used in banking domain for credit card fraud detection. It takes all credit card transactions as input and generates three clusters such as low, medium and high. It does mean that it groups all transactions into the three types. It is known as making a model. Provided this mode, the new transactions are compared with low, medium and high. If they are nearer to one of the groups, the transactions is likely genuine. If the new transaction amount is beyond high with huge difference, then the algorithm suspects the transaction as fraud transaction an alerts banker and customer. Thus K-means is used in real applications. The quality of clusters made by a clustering algorithm depends on the quality of similarity measure. For instance K-means uses Euclidian distance [3], [4]. Clustering methods are of three types. They are hierarchical clustering, data partitioning and data grouping [5]. Hierarchical clustering focuses on making hierarchy of clusters. Partitioonal clustering focuses on making partitions while data grouping is used to make overlapping clusters. In all the above mentioned clustering approaches, the similarity measure is important. They use singleviewpoint for measuring similarity. However, multiple viewpoints can provide more qualitative assessment of similarity. This is the motivation in this project. We use multi-viewpoint measure to achieve highly accurate clusters. We aim at achieving lowest inter-cluster similarity and highest intracluster similarity. The remainder of the paper is structured as follows. Section II provides literary survey. Section III focuses on multi viewpoint similarity based measure. Section IV presents algorithms. Section V provides experimental evaluation. Section VI provides experimental results while section VII concludes the paper.
Copyright to IJIRCCE
www.ijircce.com
3265
ISSN(Online): 2320-9801 ISSN (Print): 2320-9798
International Journal of Innovative Research in Computer and Communication Engineering (An ISO 3297: 2007 Certified Organization)
Vol. 2, Issue 3, March 2014
II
RELATED WORK
In many real world applications clustering documents is very essential. For instance web search engines must use the technique in order to make clusters and improve query processing. For many years the technique is being used. In case of document clustering, a document is treated as an object and objects which are similar are grouped together. The words in document are treated as terms. Each term can have frequency in the document. The term frequency is used in measuring similarity. A vector is built using term frequency and documents. Weighting schemes such as TF-IDF (Term Frequency – Inverse Document Frequency) is used to denote document vectors. The document clustering is of many types as explored in literature. They include non-negative matrix factorization [7], probabilistic based methods [8], and information theoretic co-clustering. These approaches use different approaches to find similarity among documents. Euclidian distance is used by many techniques to find similaritymeasure. Dist (di,dj) = ||di – dj||
(1)
Due to its simplicity and ease of use K-means is widely used. K-means uses this measure for finding distance between objects. The cluster centroid is computed as follows. Min ∑k∑ ||di – Cr||2
(2)
r=1 di∈Sr
Cosine similarity measure is another kind of measure used for document clustering. As explored in [9] it is best used to work with high dimensional documents [9]. Spherical K-Means also can use this measure. There is difference between two similarity measures. The ED is based on cluster magnitudes while the cosine similarity is based on directions of a vector. Another technique used for clustering is graph partitioning which makes use of document corpus as graph. The algorithm used by this is min-max cut where centroid is represented as: Min ∑k Dtr D r=1
||Dr||
(3) 2
Average Weight [11] and Normalized Cut [10] are other graph partitioning methods meant for using clustering documents. Cosine similarity measure is used to achieve this in Average Weight. In Normalized Cut pair wise score is used. In [12] criterion functions are used for analyzing documents. The software package CLUTO [13] is also used to cluster documents. This software uses graph partitioning method. Its clustering process is based on the nearest neighbor graph and Jacquard coefficient that is calculated as: SimeJacc(u i,uj) = ||ui||2 + ||uj||2 – utiuj
utiuj (4)
Jacquard coefficients make use of direction and magnitude that is not used by cosine similarity and ED measures. When the documents are presented in unit vectors, it is same as cosine similarity. There is comparison explored between Pearson correlation and Jacquard techniques in [14]. In [17] tree similarity is sued while in [18] phrase based similarity is used. However, they both depend on a common method known as Hierarchical Agglomerative Clustering. The lower side of these techniques is that they incur heavy computational cost. There are measures found for clustering XML documents as well. One such measure is explored in [19] named “Structural Similarity” which make difference between document and text clustering. This paper focuses on a new multi-viewpoint based similarity measure.
Copyright to IJIRCCE
www.ijircce.com
3266
ISSN(Online): 2320-9801 ISSN (Print): 2320-9798
International Journal of Innovative Research in Computer and Communication Engineering (An ISO 3297: 2007 Certified Organization)
Vol. 2, Issue 3, March 2014
III
MULTI-VIEW POINT BASED SIMILARITY MEASURE
In this paper multi-viewpoint based similarity measure is explored. It makes use of multiple view points to determine similarity between documents. This will make more informative assessment of similarity while making clusters. It computes similarity between documents as follows. Sim (d i,dj)
= 1/n-nr ∑ Sim (di-dh, dj-dh)
dt,dj∈Srdh∈S\Sr(5) The approach used here is that di and dj are two points in a cluster Sr. The similarity between the documents is represented as dh. The assumption used here is that “dh is not same as that of dj and di. However, dh is into same cluster if similarity in terms of distance is same. The similaritymeasure used in this paper provides best clusters and do not provide negative results. IV
ALGORITHMS PROPOSED
Many algorithms have been proposed to work on multi-viewpoint similarity measure. The procedure for similarity matrix is as shown in Listing 1.
Algorithm 1 – Functionality for making similarity matrix
As per the procedure in Algorithm 1, it specifies that dl and di are closer and the dl is also closer to di as per the multiviewpoint similarity measure. The Algorithm 2 shows the validation procedure.
Algorithm 2 –Validation Procedure
Copyright to IJIRCCE
www.ijircce.com
3267
ISSN(Online): 2320-9801 ISSN (Print): 2320-9798
International Journal of Innovative Research in Computer and Communication Engineering (An ISO 3297: 2007 Certified Organization)
Vol. 2, Issue 3, March 2014
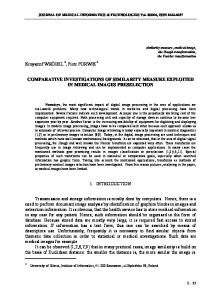
The final validity is calculated by averaging overall rows. It is as given in line 14, that when validation score is higher, then the similarity is higher and thus eligible for clustering. Fig. 1 shows the validity scores of multi-viewpoint similarity and cosine similarity.
Fig. 1 – Validity of Cosine Similarity and Multi-Viewpoint Based Similarity
As can be seen in fig. 1, Series 4 is related to klb-MVS, series 3 corresponds to klb-CS, and series 2 corresponds to reutors-7 while series 1 corresponds to reutors -7 CS. As shown in fig. 1 performance of MVS is higher when compared to that of CS.
Algorithm 3–Alg for incremental cluster
Algorithm 3 is shows algorithm with two phases. They are initialization and refinement. Selecting k documents as seeds are known as initialization which making initial positions while the refinement makes much iteration to form best clusters. Each iteration in refinement phase visits n number of documents in randomized fashion. After that verification is done for each document. If the document contains similarity, it is moved to the cluster. When no documents are there the iterations come to an end.
Copyright to IJIRCCE
www.ijircce.com
3268
ISSN(Online): 2320-9801 ISSN (Print): 2320-9798
International Journal of Innovative Research in Computer and Communication Engineering (An ISO 3297: 2007 Certified Organization)
Vol. 2, Issue 3, March 2014
V.
PERFORMANCE EVALUATION
For performance evaluation for two criterion functions such as Ir, and Iv associated to multiviewpoint similarity measure. Bench mark datasets have been used to test the efficiency of our approach. The results are shown in table 1.
Table 1 –Benchmark documents datasets
VI
EXPERIMENTAL SETUP AND EVALUATION
Our algorithm is compared with other algorithms for performing evaluation. They include M-means, Cut Algorithm, Min Max graph EJ which is nothing but CLUTO’s graph with graphCS , extended Jacquard which is nothing but CLUTOs graph with SpkMeans, Cosine Similarity which is nothing but Spherical K-Means with Cosine Similarity, MVSC Iv which is nothing but the proposed approach with Iv criterion function and MVSC Ir which is nothing but the proposed approach with Ir criterion. The results are presented in the next section. VII
RESULTS
The result of experiments are presented in fig. 2 and 3. It shows graphs with the results of all clustering algorithms for 20 benchmark datasets. The results are given in two different graphs. Each graph shows the experimental results of 10 datasets.
Fig. 2 (a) Results of Algorithms for first 10 datasets
Copyright to IJIRCCE
www.ijircce.com
3269
ISSN(Online): 2320-9801 ISSN (Print): 2320-9798
International Journal of Innovative Research in Computer and Communication Engineering (An ISO 3297: 2007 Certified Organization)
Vol. 2, Issue 3, March 2014
Fig. 2 (b): Results of Algorithms for next 10 datasets
As shown in fig. 2(a) and (b), the proposed approach performs better when compared with other algorithms. GraphEJ performed better only in some cases. Overall performance of MVSC Iv and MVSC Kr is far better than others. The effect of is also presented on the performance of MVSC Ir. VIII
THE EFFECT OF
ON THE PERFORMANCE OF MVSC IR
It is understood that the cluster size and balance have their impact on the methods of partitional clustering based on criterion functions. In terms of accuracy and NMI, FScore the assessment is done and the results are presented in fig. 3.
Fig. 3 - Performance of MVSC Ir with respect to
As shown in fig. 3, MVSR Ir’s performance is within 5% with regard to any evaluation metric for best case.
IX
CONCLUSION
In this paper we consider measuring similarity between two documents from multiple-view points. Similarity measures are used in document clustering. Clustering techniques depend on the similarity measure. All existing similarity measures are single viewpoint based. They cannot provide more informative assessment of similarity between objects. However, in this paper we explored the multi viewpoint based similarity measure which makes more informative assessment to group objects into different clusters. This new measure achieves highest level of similarity. The aim of the new measure is to achieve highest intra-cluster similarity and lowest inter-cluster similarity. We built a prototype application that shows the proof of concept. The results revealed that the proposed approach is capable of measuring similarity more accurately.
Copyright to IJIRCCE
www.ijircce.com
3270
ISSN(Online): 2320-9801 ISSN (Print): 2320-9798
International Journal of Innovative Research in Computer and Communication Engineering (An ISO 3297: 2007 Certified Organization)
Vol. 2, Issue 3, March 2014 REFERENCES
[1] A. Ahmad and L. Dey, “A method to compute distance between two categorical values of same attribute in unsupervised learning for categorical data set,” Pattern Recognit. Lett., vol. 28, no. 1, pp. 110 – 118, 2007. [2] A. Banerjee, I. Dhillon, J. Ghosh, and S. Sra, “Clustering on the unit hypersphere using von Mises-Fisher distributions,” J. Mach. Learn. Res., vol. 6, pp. 1345–1382, Sep 2005. [3] I. Dhillon and D. Modha, “Concept decompositions for large sparse text data using clustering,” Mach. Learn., vol. 42, no. 1-2, pp. 143–175, Jan 2001. [4] I. S. Dhillon, S. Mallela, and D. S. Modha, “Information-theoretic co-clustering,” in KDD, 2003, pp. 89–98. [5] S. Flesca, G. Manco, E. Masciari, L. Pontieri, and A. Pugliese, “Fast detection of xml structural similarity,” IEEE Trans. on Knowl. And Data Eng., vol. 17, no. 2, pp. 160–175, 2005. [6] I. Guyon, U. von Luxburg, and R. C. Williamson, “Clustering: Science or Art?” NIPS’09 Workshop on Clustering Theory, 2009. [7] D. Ienco, R. G. Pensa, and sR. Meo, “Context-based distance learning for categorical data clustering,” in Proc. of the 8th Int. Symp. IDA, 2009, pp. 83–94. [8] Leo Wanner (2004). “Introduction to Clustering Techniques”. Available online at: http://www.iula.upf.edu/materials/040701wanner.pdf [viewed: 16 August 2012] [9] C. D. Manning, P. Raghavan, and H. Sch ¨ utze, An Introduction to Information Retrieval. Press, Cambridge U., 2009. [10] on web-page clustering,” in Proc. of the 17th National Conf. on Artif. Intell.: Workshop of Artif. Intell.for Web Search. AAAI, Jul. 2000, pp. 58–64. [11] J. Shi and J. Malik, “Normalized cuts and image segmentation,” IEEE Trans. Pattern Anal. Mach. Intell., vol. 22, pp. 888–905, 2000. [12] A. Strehl, J. Ghosh, and R. Mooney, “Impact of similarity measures. [13] X. Wu, V. Kumar, J. Ross Quinlan, J. Ghosh, Q. Yang, H. Motoda, G. J. McLachlan, A. Ng, B. Liu, P. S. Yu, Z.-H. Zhou, M. Steinbach, D. J. Hand, and D. Steinberg, “Top 10 algorithms in data mining,” Knowl.Inf.Syst., vol. 14, no. 1, pp. 1–37, 2007. [14] W. Xu, X. Liu, and Y. Gong, “Document clustering based on nonnegative matrix factorization,” in SIGIR, 2003, pp. 267–273. [15] H. Zha, X. He, C. H. Q. Ding, M. Gu, and H. D. Simon, “Spectral relaxation for k-means clustering,” in NIPS, 2001, pp. 1057–1064. [16] Y. Zhao and G. Karypis, “Empirical and theoretical comparisons of selected criterion functions for document clustering,” Mach. Learn., vol. 55, no. 3, pp. 311–331, Jun 2004. [17] S. Zhong, “Efficient online spherical K-means clustering,” in IEEE IJCNN, 2005, pp. 3180–3185.
Copyright to IJIRCCE
www.ijircce.com
3271