Multicasting in Groupware? Sasa Junuzovic and Prasun Dewan Department of Computer Science University of North Carolina at Chapel Hill Chapel Hill, NC 27599, USA
[email protected] [email protected]
Abstract— While multicast has been studied extensively in many domains such as content streaming and file sharing, there is little research applying it to synchronous collaborations involving shared access to a distributed object. Based on several cases of real-world collaborations involving instant messaging, distributed lectures, and computationally-intensive collaborative game playing, we show that compared to traditional centralized and replicated collaboration architectures, a new bi-architecture collaboration system model with multicasting support can improve response, feedthrough, and task completion times. In addition, we show that to optimize performance, the set of traditionally considered factors, consisting of network delays and transmission costs, must be expanded to include several new factors, such as processing costs, scheduling policies, and think times. In one or more of the real-world collaborations we consider, we show that multicast (a) can increase feedthrough times if processing costs and scheduling policies are not considered and (b) may degrade or improve task completion times depending on the cost of computing the multicast overlay. Keywords- Multicast; Response, Feedthrough, and Task Completion Times
I.
INTRODUCTION
Multicasting has long been advocated as a more efficient data distribution scheme than unicasting – and justifiably so. In particular, it can better utilize network resources, such as routers and physical links, by reducing the degree of packet duplication. However, there has been little work done in applying this idea to distributed collaboration, by which we mean synchronous collaboration involving shared access to a distributed object (as opposed to audio/video conferencing). The T 120 protocol [4] advocated the use of a multicast tree to reduce the amount of data (audio, video, bitmaps) transmitted on the network. How such a tree was built or the improvement in network usage in different kinds of collaboration scenarios was not studied. RMX [2] and SRM [7] have studied the use of multicast to improve the packet loss handling and fault tolerance of shared whiteboards. In this paper, we extend this research by focusing on performance of the collaborative application rather than reliability or network usage. Like T 120, RMX, and SRM, we assume application-level multicast, that is, we assume that only end-host machines can participate in the multicast; in particular, network-level routers, firewalls, and all other nonend-host devices are abstracted away. The idea of multicast requires the construction, for each source of messages, a This research was funded in part by NSF grants ANI 0229998, EIA 0303590, IIS 0312328, and IIS 0712794.
multicast overlay that defines the paths a message takes to reach the destinations. Intuitively, such multicast overlays can degrade performance. They can increase feedthrough times (the time it takes for users’ actions to be seen by others) as data must pass through additional nodes to reach the collaborators. In addition, the cost of dynamically building the multicast overlay can increase task completion times. However, we show that because of the cost of transmitting messages to the network, it is possible to build a new multicast collaboration architecture that can actually improve response times, feedthrough times, and task completion times in several real-world collaborations involving instant messaging, distributed lectures, and computationally-intensive collaborative game playing. We also show that in many realistic cases, the multicast architecture can degrade one or more performance metrics, and identify several factors (such as processing costs and scheduling policies) that determine if unicast or multicast architectures should be used. The multicast architecture uses an existing algorithm to arrange the collaborators’ computers into a multicast tree – it does not assume the existence of other hosts for communicating. Like other works on multicasting, we use simulations to compare the two kinds of architectures. Our simulations are different from previous multicast simulations in two fundamental ways because they are focused on distributed collaboration. First, they consider several new parameters such as processing costs, scheduling policies, and think times. Second, all of the parameter values are based on actual collaboration logs we gathered. The rest of this paper is organized as follows. In the next section, we derive our multicast collaboration architecture by extending existing unicast architectures. Next, we present our experimental setup and results. Finally, we discuss the implications of these results on future multicast schemes in the collaboration domain and present brief conclusions and directions for future work. II.
COLLABORATION ARCHITECTURES
As mentioned above, our work focuses on the collaboration domain. In order to understand the role multicast can play in improving the performance of collaborative applications, we need to identify the distributed architectures of these applications and the performance metrics influenced by multicasting.
A. Unicast Collaboration Architectures In general, a collaborative application is logically broken up into a program and a user-interface component. The program component manages an object that is shared by all of the users. The user-interface component allows interaction with the shared object using state that is not shared with others. In other words, how an application is broken into a program and userinterface component depends on what is shared among the applications. For example, in the NetMeeting application/window sharing system, the set of windows created by the shared window clients forms the shared state. Therefore, the shared window clients form the program components, and the window server forms the user-interface component. On the other hand, in the NetMeeting whiteboard application, the shape objects, such as circles and squares, form the shared state. The module that defines these objects forms the program component, and the one that supports the display and editing of these objects forms the user-interface component. We will refer to messages sent by the user-interface component to the program component as input commands, and those sent by the program component to the user-interface component as output commands. As the state of the user-interface component is not shared, it executes on each user’s machine. The program component, which is logically shared, may be physically replicated or centralized on the users’ machines. In the centralized architecture, the program component executes on a computer belonging to one of the collaborators, receiving input from and sending output to all the (user-interface components of the) users. Because the computer running the program component acts as a computation server for the other computers in the session, the centralized architecture is sometimes called a client-server architecture. We refer to the computer which is (not) running the program component as master (slave) computer, and the corresponding user a master (slave) user. In the replicated architecture, a separate replica of the program component executes on the computer of each user, receiving input commands from all users and sending outputs to only the local user. As each computer is a master, this architecture is also known as a peer-to-peer architecture. The hybrid architecture, as its name implies, shares aspects with both centralized and replicated architectures. In this architecture, more than one but not all computers are masters. As in the replicated case, a master computer receives input commands from all master users and sends outputs to its local user, and as in the centralized case, it receives input commands from and sends outputs to (possibly) one or more slave users. In this paper, we do not directly evaluate the impact of multicasting on hybrid architectures; instead, we infer it from the results for centralized and replicated architectures. B. Bi-Architecture Collaboration Model As shown above, centralized and replicated architectures couple the input command processing and data distribution tasks. In other words, computers that process input commands must also perform all data distribution. For example, in the centralized architecture, the master computer must unicast output commands to all slave computers, while in the replicated architecture, a master computer must unicast all input
commands it receives from its local user to all other master computers. It is not possible for more than one computer to be involved in distributing data, which is inconsistent with the notion of multicast. To support multicast, we define a new bi-architecture collaborative systems model that decouples the processing and distribution tasks. The processing architecture governs the master-slave relationships and the communication architecture dictates how input (output) commands are distributed from one master computer to other master (slave) computers. By definition, when a unicast communication architecture is used, the bi-architecture model degenerates to that of traditional collaboration architectures. The main question of this work was whether a unicast or a multicast communication architecture should be used to optimize the performance of a given processing architecture. In particular, we consider multicasting of the input and output commands from the inputting master computer. To answer the question, we must first define all implementation aspects of the bi-architecture model. There are three important implementation-dependent aspects of unicast collaboration architectures that have carried over into the biarchitecture model. The first is whether or not a user-interface component can directly interact with files that represent some or all of the shared state. We do not place any restrictions on such accesses. For example, we allow a user interface on a master computer to directly interact with shared files on the local file system. The idea of different user-interface components implementing different algorithms is not new; for instance, it has been advocated to create different users of mobile and desktop computers [3]. A related question is whether each replicated program component in a replicated architecture has access to files needed to support the collaboration before the collaborative session begins. We do not make this assumption in order to accommodate realistic situations, such as a PowerPoint presentation that is continuously updated until the start of the lecture. Instead, we assume that the necessary files are sent from the master computer of the first inputting user to all other master computers as part of the first input command. The second important implementation-depended aspect of the bi-architecture model is the order in which a master computer carries out processing and transmission tasks. One issue is whether these tasks are carried out in a single thread or in separate threads. We assume that both processing and data distribution tasks are carried out by a single thread mainly because it is difficult to model multiple threads, especially without making some platform-specific assumptions about the scheduling of the threads. Multi-threaded implementations of program components, of course, have the potential of improving performance, especially on a multicore or a multiprocessor computer. We leave the nature and impact on performance of such implementations as future work. When all operations are carried out by a single thread, one must determine the order in which they are carried out. Two scheduling policies are 1) process-first, which favors response times by postponing the transmission task until the processing task completes and the output is displayed to the local user, and
Centralized Processing Architecture Process First Transmit First If (master computer) Wait for next input cmd Process input cmd Else Wait for next output cmd Process output cmd Unicast output cmd to (zero or more) slave users Repeat
If (master computer) Wait for next input cmd Process input command Else Wait for next output cmd Unicast output cmd to (zero or more) slave users Process output cmd Repeat
Replicated Processing Architecture Process First Transmit First Wait for next input cmd Process input cmd Process output cmd Unicast input cmd to (one or more) master users Repeat
Wait for next input cmd Unicast input cmd to (zero or more) master users Process input cmd Process output cmd Repeat
Figure 1. The order in which a computer carries out operations when process first or transmit first scheduling policies are used for the centralized and replicated processing architectures
2) transmit-first, which favors feedthrough times by first transmitting and then processing. In the unicast architectures, the scheduling policies are relevant only to master computers. The reason is that the slave computers do not participate in the data distribution task. When multicast is used, this is no longer true; in particular, a slave computer may be responsible for forwarding output commands that it receives to other computers. Therefore, the scheduling policies must distinguish between masters and slaves. Figure 1 shows multicast versions of these policies. The key difference between the unicast architecture and the bi-architecture model scheduling policies is as follows. In the unicast case, a master computer transmits an input (output) command to all other computers in the replicated (centralized) architecture, respectively. In the multicast case, on the other hand, the set of destinations to which the inputting user’s master computer transmits a command is determined by the multicast overlay. There must be at least one destination in the set; otherwise the system cannot be collaborative. Moreover, the multicast overlay determines the set of destinations to which a non-inputting user’s computer forwards received commands. Depending on the multicast overlay, the destination set is empty for some computers and non-empty for others. Hence, the scheduling policies allow a computer to forward to zero or more destinations. Another issue is handling of conflicting user actions. In general, to resolve conflicting operations, extra processing, extra communication, or both may be required. For each consistency management algorithm, it may be necessary to define a new scheduling policy. We leave this as important future work. Our model is consistent with operation transformations as they only add to the processing time of commands; in particular, no extra communication between computers is required. Therefore, by grouping the transformation task for a command together with the processing of the command, process-first and transmit-first scheduling policies explained above support operation transformations. However, in our applications and experiments, no consistency management was implemented, and social control was used to prevent inconsistency. C. Choice of Multicast Algorithm In this first-cut effort at investigating the bi-architecture model, we did not want to develop a new algorithm for creating a multicast tree. Instead, we wanted to analyze the performance of an existing algorithm. There are two classes of such algorithms, namely, IP layer multicast and application layer multicast. IP layer multicast assumes that network level routers support multicast and can be organized into multicasting
overlays. Hence, the source host sends only a single copy of a message and the routers make sure that the message reaches the desired destinations. In other words, the routers perform the actual packet duplication and forwarding of messages. In contrast, application layer multicast assumes no multicast support at the network layer and instead organizes the end-user hosts into multicast overlays. In such overlays, the hosts are connected by logical links, which map to physical paths in the underlying network. Unfortunately, even though multicasting is a mature field, because of a lack of a practical approach to upgrading legacy backbone routers to include multicast functionality, a lack of a scalable inter-domain routing protocol, and other deployment issues [6], IP layer multicast is not widely available. For this reason, we analyze an existing application layer multicast scheme. In general, there are many approaches to create application layer multicast overlays. Most of these approaches model the network as a graph in which the hosts are the vertices and the logical links between these hosts are the edges. Each host is assigned a set of constraints, which acts as knobs for controlling resource usage. For example, the degree constraints can specify the available bandwidth of each host. Each link is assigned a cost, which is incurred each time the link is traversed. For instance, these costs can specify the latency of a link. Using this network model, traditional multicast schemes focus on minimizing the diameter of the multicast overlay while satisfying the host constraints. The implicit assumption in this approach is that the diameter of the overlay determines the largest end-to-end delay. Recently, Brosh and Shavitt [1] argued that this assumption is valid for network-layer but not application-layer overlays because the cost of the transmitting data to multiple destinations can be significant at the application layer. In other words, the approach of optimizing diameters of applicationlayer overlays assumes network-layer data distribution capabilities at the application layer, even though the data distribution capabilities at the two layers are fundamentally different. As a result, Brosh and Shavitt define a new algorithm for creating application-layer multicast trees, which explicitly considers application-layer transmission times (What we call transmission times, they called processing times. We use a more specific term as there are other kinds of processing tasks in our domain, as we see below). As they showed that the optimal multicast problem is NP-Complete for their network model, Brosh and Shavitt developed a heuristic multicast algorithm, called HMDM. They compared its end-to-end delays with the end-to-end delays produced by Dijkstra’s Shortest Path Tree algorithm, which does not consider transmission times. Their simulations of these two algorithms
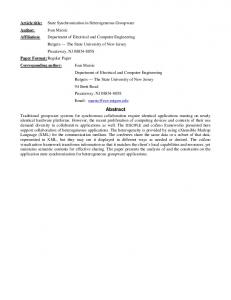
Figure 2. Illustrating the response and feedthrough time improvements of multicast (right) compared to unicast (left)
show that the HMDM scheme provides better end-to-end delays than Dijsktra’s scheme.
members can follow the presentation, the presenter starts talking only once they can all see the first slide on their screens.
In summary, HMDM is the only approach that considers the time end-hosts require for duplicating and transmitting messages on the network in the building of such a tree. As our motivation for applying multicast to collaboration was based on the assumption that transmission costs are significant, we decided to use HMDM as the basis for our multicast architecture.
The speaker, user1, and one of the team-members, user2, have PDAs while the remaining two team-members, user3 and user4, have powerful P4 laptops. They have created an ad-hoc network with their devices using a replicated processing architecture. As the devices are collocated, the network latencies between them are low (i.e. 0ms) and do not affect performance. Suppose that the users can choose either a unicast (Figure 2 left) or a multicast (Figure 2 right) communication architecture. In the unicast case, user1 sends commands to each of the three users, while in the multicast case, user1’s PDA sends commands only to user3’s laptop, and user3’s laptop forwards these commands to the remaining users’ devices. Suppose that in the unicast case, user1 sends commands to user4 last. Also, suppose that in the multicast case, user3 forwards to user4 last. Suppose that the transmit-first scheduling policy is used. At last, recall our assumption that, in the replicated processing architecture, the necessary files are sent from the master computer of the first inputting user to all master computers as part of the first input command.
III.
EVALUATION
Three important performance metrics for collaborative applications are response, feedthrough, and task-completion times. The response time for an input command entered by useri is defined as the time that elapses from the moment the command is entered by useri to the moment useri sees the output. The feedthrough time to userj of an input command entered by useri is defined as the time that elapses from the moment the command is entered by useri to the moment userj sees the output. It is similar to the end-to-end delay metric mentioned earlier. Both include network latencies along the path from a source computer to a destination computer. They are not exactly the same because the feedthrough time also contains the time the destination computer requires to process the input and/or output command once it arrives. Finally, the task-completion time for useri is the time that elapses from the moment the collaboration starts to the moment useri sees the output for the last input command in the session. It is a function of both response and feedthrough times. A. Why Multicast is an Issue As mentioned above, multicast can degrade performance. In particular, it can increase feedthrough time as data must pass through intermediate nodes to reach the collaborators. In addition, the cost of dynamically building a multicast tree can increase task completion times. So why consider multicast? The main reason is that the transmission costs incurred by master computers to deliver messages to the network can be substantial if the computer is slow and/or the number of messages is large. To illustrate, consider a scenario in which a company team of four people is at an airport waiting for their flight home. When they return, they will be giving a companywide PowerPoint presentation on whether or not to buy out a small firm they just visited. While they are waiting at the airport, the presenter is practicing the talk and the remaining users are providing feedback. To make sure all the team-
In the unicast case (Figure 2 left), when the presenter, user1, enters an input command to start the presentation, the PDA transmits the entire presentation file to user2’s, then user3’s, and finally user4’s device. User4’s laptop then processes first the input command, which includes saving the presentation file locally, and then the corresponding output command, which includes displaying the first slide to user4. Suppose that the time the PDA requires to transmit a single copy of the file is 3T, the time the laptop requires to process the input command containing the presentation file is 2T, and the time the laptop requires to process the output command is T. Therefore, the amount of time that elapses from the moment user1 starts the presentation to the moment user4 sees the first slide is 9T+2T+T=12T. In the multicast case (Figure 2 right), when user1 enters an input command to start the presentation, the PDA transmits a single copy of the file to user3’s laptop, which then forwards the command to the remaining users, first to user2 and then to user4. User4’s device then processes the input command and the corresponding output command. Suppose that the time the laptop requires to transmit the start presentation input command to a single destination is T. In this case, the amount of time that elapses from the moment user1 enters the start presentation command to the moment user4 sees the first slide is 3T+T+2T+T=7T. Hence, the multicast communication
architecture reduces the feedthrough time of the start presentation input command to user4 from 12T to 7T. For the same reason, the task completion time is reduced; in particular, because user4 sees the first slide earlier in the multicast case than in the unicast case, the presenter could start the presentation earlier in the multicast case. Finally, regardless of whether unicast or multicast is used, once the presenter’s PDA completes transmitting the start presentation input command, the PDA processes the input command and the corresponding output command locally. Because the PDA’s total transmission time of the command is 9T in the unicast case and 3T in the multicast case, the response time of the command is also improved by multicast. To summarize, based on the qualitative analysis, there exist scenarios, at least in theory, in which the multicast based communication architecture provides better response, feedthrough, and task completion times than the unicast communication architecture. Of course, experiments are needed to determine if, in realistic situations, offloading the communication task to another node offsets the cost of transmitting the message through another link. In particular, the HMDM-scheme we use in our bi-architecture model was evaluated using random values for its parameters. More importantly, the evaluation was not targeted at collaboration. Therefore, it is important to evaluate the use of our HMDMbased multicast architecture in different collaboration scenarios. B. Experimental Results In general, to evaluate the performance of a system, one must first identify the parameters relevant to performance. Thus, to compare unicast and HMDM-based multicast, we must determine the factors that influence the comparison. We refer to these as performance parameters. We must also consider a second set of parameters. These are the parameters needed by HMDM to construct the multicast overlay. We refer to these as overlay parameters. The overlay parameters must first be assigned values to construct the multicast tree, and then the performance parameters must be assigned values to evaluate the overlay under various conditions. Ideally, the parameters must be assigned values that reflect reality. Next, we explain how we followed this procedure to evaluate the impact of our HMDM-based bi-architecture model on feedthrough, response, and task-completion times, respectively. 1) Performance and Overlay Parameters From the qualitative arguments in the above example, we can extract the parameters relevant to the performance of the bi-architecture model. The parameters are the number of collaborators, the network latencies between the collaborators’ computers, the processing and transmission times for a command of each user’s computer, and scheduling policy. Two of these factors, namely, the number of collaborators and network latencies are self-defining. Moreover, scheduling policies have already been defined earlier. Finally, the processing and transmission times of a command for a computer are defined as the amount of time the computer required to process the command and transmit it to a single destination, respectively.
It turns out that Brosh and Shavitt use number of collaborators, network latencies, and the transmission times as parameters for constructing the overlay. Therefore, all of the HMDM-scheme overlay parameters are covered by the performance parameters. 2) Gathering Values of HMDM Parameters There are a number of ways of assigning values to these parameters. One approach is to generate values using some mathematical distribution, which is the approach Brosh and Shavitt took. The danger with random assignment of parameter values is that they may not necessarily reflect reality. Therefore, we tried to be more realistic in choosing parameter values. Based on pings done to remote computers, we use 0ms and 72ms to simulate half the round-trip time from a U.S. East Coast LAN-connected computer to another computer connected on this LAN and a German LAN, respectively. These two values defined the minimum and maximum network latencies in our evaluation. Determining realistic values of transmission times was more complicated. Recall that the transmission time of a command for a computer is defined as the amount of time the computer requires to transmit the command to a single destination. Therefore, to obtain realistic transmission times, we need realistic computers and commands. Ideally, we should be able to use publicly available sequences of input commands representative of one or more collaborative applications involving shared access to a distributed object, but our search revealed no such data. An alternative approach, which is the one we used, is to extract parameter values from actual collaboration logs. We recorded logs of actual collaborations and then extracted the values of all performance factors from these logs. One issue with this approach is that the parameter values obtained from the recorded collaborations may not be representative of the values of these parameters in other collaborations. In general, applications used in synchronous collaborations involving shared access to a distributed object can be divided into four categories: 1) logic-centric, which process computationally expensive input commands; 2) datacentric, which distribute large amounts of data; 3) logic-anddata-centric, which both process computationally expensive input commands and distribute large amounts of data; and 4) stateless, which do neither. We reduce the problem of log generality by analyzing collaborations involving applications belonging to three of these categories: a Checkers game, which is logic-centric; PowerPoint, which is data-centric; and a chat application, which is stateless. The checkers game fostered collaboration rather the competition: multiple users formed a team that played against the application, which used a computationally expensive algorithm to calculate its next move. The algorithm optimized the computer’s move by analyzing scenarios five moves ahead. The users used an audio channel and a telepointer to determine their next move. Any of the users could then make the actual move. This application was created by extending an existing single-user checkers program. We analyzed recordings of two PowerPoint presentations that were given by one presenter to thirty and sixty audience
members, respectively. In addition, we recorded two chat-room sessions consisting of eighty participants of which as many as eight posted messages. Finally, we recorded a collaborative checkers game in which the team consisted of two users. Thus, in these applications, not only did the nature of the application engine vary (logic-centric, data-centric, stateless) but also the number of actors and observers. None of the applications had concurrency control – the PowerPoint and chat applications did not require such control and users of the checker’s program used social protocol to decide who made a move. These recordings contain actual data and users’ actions – PowerPoint commands and slides, checkers moves, and chat messages. The checkers engine used in the actual tasks was transformed into a collaborative program using an infrastructure that has facilities for logging and replaying commands. Therefore, extracting input and output commands from the generated checker logs was relatively simple. The chat programs we logged were the ones implemented by the chat rooms we observed. We ran them under Microsoft Live Meeting 2005 and used its screen-recording capabilities. As a result, we had to use a tedious manual process to extract the input command messages in the sessions – analyzing one tenminute recording required two hours of work! In addition to being three qualitatively different applications, IM, Checkers, and PowerPoint turned out to be a good choice of applications for which to analyze actual logs for two reasons: 1) the parameters values we measured in these logs were fairly wide spread, and 2) they represent the kind of tasks users do on a daily basis. To obtain the transmission time parameter values, we replayed these logs using a Java-based infrastructure that has facilities for logging and replaying commands. The checkers program used in the actual tasks was already transformed into a collaborative program using this infrastructure. Hence, the checker logs were replayed directly to the program used in the actual task. To replay the chat commands, we used the replaysupporting infrastructure to create our own version of the chat application. To replay the PowerPoint commands, we had to bridge the gap between our Java-based replay-supporting infrastructure and the PowerPoint application. We used the JIntegra library to create this bridge and relay the replayed commands to the PowerPoint application. This library required us to assume that slave computers could directly access file systems because the information about a slide contained in an output command from the master had to be saved in a file before it could be displayed by the slave. We measured the transmission times for a P2 266MHz laptop, a P3 866MHz desktop, and a P4 2.4 GHz desktop. All the computers were running Windows XP except the laptop, which was running Windows 98. The P2 laptop and the P3 desktop are used to simulate next generation cell-phones and PDAs, respectively. We recorded the average amortized input and output command transmission times of each machine for checkers, PowerPoint, and chat applications. We removed any “outlier” entries from the average calculation, caused for instance, by operating system process scheduling issues. To reduce these issues, we removed as many active processes on each system as possible. Ideally, while we replay the recordings, we should run a set of applications users typically
execute on their systems. However, the typical working set of applications is not publicly available so we would have to guess which applications to run. For fear of incorrectly affecting transmission times by running random applications, we used a working set of size zero, a common assumption in experiments comparing alternatives. In order to control network-related variability, we ran our experiments on our local 100Mbit LAN. In addition, we assumed that the data and users’ actions in the logs are independent of the number of collaborators, the processing powers of the collaborators’ computers, and network latencies. While the process of obtaining transmission times was fairly complicated, it did have a nice side effect that it provided the values of the processing parameters. In particular, during the experiments, we measured not only the transmission times of the input and output commands for each computer, but also the processing times of these commands. As for transmission times, we recorded the average amortized input and output command processing times of each computer for checkers, PowerPoint, and chat applications. Finally, we had to assign the values of the number of collaborators and the processing powers of their machines. As mentioned above, in the collaboration recordings that we analyzed, the number of users ranged from as few as two in Checkers, between thirty and sixty in PowerPoint, and as many as eighty in the chat application. Unfortunately, this is not a wide enough range of values; in particular, the maximum value of the parameter needs to be much bigger to be representative of large collaborations, such as a company-wide PowerPoint presentation. We used the following as the number of collaborators in a session: 5, 10, 15, 20, 25, 30, 40, 50, 100, 250, 500, 750, 1000, 1500, and 2000. The maximum value of 2000 is much larger than the maximum value we observed in any of the recordings. To cover the values we did observe, we use many values less than 100. We are not unaware of any public data about and our logs did not record the distribution of processing powers of the collaborators’ computers during a collaborative session. Therefore, we randomly assigned the type of computer of each user to be a P2 laptop, P3 desktop, or a P4 desktop. 3) Simulating the Performance Using these values of the transmission time, network latency, and number of users parameters, we can use the HMDM algorithm to build a multicast overlay for any collaboration session in which the users are using P2 laptops, P3 desktops, and P4 desktops like the ones for which we measured transmission times. In our simulations, we consider only scenarios in which all computers can (logically) communicate directly. Recall from above that by using application layer overlays, we abstracted away firewalls between the computers. We include any firewall-related delays a message suffers as it travels between two users in the network latency assigned to the logical link between the two users. Once the overlay is created for a particular scenario, there are two ways to compare the performances of unicast and multicast communication architectures: experiments and simulation. Using the experimental approach, we could replay the same collaboration log for both the unicast and multicast
communication architectures. During each experiment, we could measure the response, feedthrough, and task completion times. One issue with such experiments is that the performance of a distributed system is affected by extraneous factors such as operating system process scheduling. As these noise factors are not accounted for in either collaboration systems or the HMDM scheme, they can skew the measurements. The alternative to performing experiments is running simulations. In the networking field, NS has made this a popular choice mainly because it allows an experimenter to control all the extraneous factors. The simulation is done purely by mathematical analysis, so noise factors can be assigned a zero value. In our case, the benefit of this approach comes at a cost – we must now assign suitable values to all parameters affecting performance, in particular, processing costs. Each simulation was defined by the set of computers used in the collaboration, application (which sets the processing and transmission times of these computers), network latencies between these computers, processing and communication architectures, scheduling policy, and source computer type. Given this information, as the analysis of Figure 2 showed, we can mathematically calculate the response and feedthrough times, and therefore the task completion time difference, for the unicast and multicast communication architecture cases. The above discussion identifies the steps we need to take to compare the traditional centralized/replicated architectures with the bi-architecture model. For each scenario, we ran 40 simulations, for which we report the average results along with a 95% confidence interval. In most cases, it is difficult to see the interval in the graph because the interval is two or three orders of magnitudes less than the average, in which case we did not graph the interval. C. Feedthrough Time Results As mentioned above, from a performance perspective, multicast has been used to reduce end-to-end delays. Also as mentioned above, in collaboration systems, end-to-end delays are related to feedthrough times; therefore, we expect that in at least some scenarios, the feedthrough times are lower for the multicast communication architecture case than for the unicast case. To see how much multicast can improve feedthrough times compared to unicast, we simulated the feedthrough times in realistic collaboration scenarios involving all three applications whose recordings we analyzed. For each application, we compare the feedthrough times when unicast and multicast communication architectures are used alongside the centralized and replicated processing architectures. Figure 3 contains the results for the transmit-first policy. It shows only three of the eighteen simulations because of limited space and the fact that the remaining results are similar. Figure 3 (top-left) shows the replicated architecture IM results assuming LAN (i.e. 0ms) network latencies and the P2 laptop as the inputting computer. Figure 3 (top-right) shows the centralized architecture results for the Next Slide PowerPoint command assuming random network latencies between 0ms and 72ms and a P4 desktop as the inputting computer. Finally, Figure 3 (bottom) shows the replicated architecture results for the Next Slide PowerPoint command assuming uniform
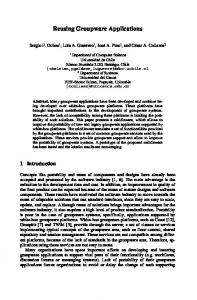
Figure 3. unicast and multicast feedthrough times assuming transmit-first scheduling: (top-left) replicated IM results with LAN (i.e. 0ms) network latencies and the P2 laptop as the source; (top-right) centralized Next Slide PowerPoint command results with random latencies between 0ms and 72ms and a P4 desktop as the source; (bottom) replicated Next Slide PowerPoint command results with 72ms network latencies and a P3 desktop as the source.
network latencies of 72ms and a P3 desktop as the inputting computer. The figure shows that when the transmit-first scheduling policy is used, maximum feedthrough times can indeed be lower with multicast than with unicast for both centralized and replicated processing architectures. In fact, as shown by Figure 3 (top-right), when there are 100 users in a centralized PPT scenario, the improvement can be as high as 650ms for the Next Slide commands, and when there are 1000 users, it can be as high as 6.8 seconds. In the replicated PPT scenario, the improvement is much smaller: with 1000 users in the session, the feedthrough is only 180ms better with multicast than with unicast. The reason the feedthrough improvement is much greater for the centralized case compared to the replicated case is because the PowerPoint transmission times of the P4 desktop in the centralized architecture for the Next Slide command are higher than those of the P3 desktop in the replicated architecture. As mentioned above, we assume that in the replicated case, the presenter’s computer sends the entire PowerPoint file (7.6Mb in our scenario) to all other users when the presenter enters the Start Presentation command, while in the centralized case, we assume that the presenter’s computer sends only the first slide to all other computers. Therefore, when the presenter enters a Next Slide command, the input command transmitted to other users in the replicated case contains only the number of the next slide to show, while in the centralized case, the output to the input command is sent and contains the actual binary representation of the next slide, which the slave computer must load and display. Interesting, these results did not generalize to the processfirst scheduling policy case. Figure 4 contains the results of repeating the above experiments using the process-first scheduling policy instead of the transmit-first scheduling policy. In particular, the feedthrough times provided by the unicast communication architecture can be as much as 2 seconds better (Figure 4 top-right). The reason is that with the process-first scheduling policy, every additional end-host on
Consider now the case in which the process-first scheduling policy is used. Somewhat counter intuitively, it can also improve response times, only not for the first input command after the system reaches a quiescent state (i.e. state in which all computers are up-to-date and no user has entered another input command), but the one after. When the first command out of the quiescent state is entered, it is first processed by the inputting user’s computer and then transmitted to other machines. Thus, the transmission time does not affect the response time of this command. However, if the user’s think time before the next input command is small, that is, less than the source computer’s total transmission time, then when the user enters the next input command, the user’s computer will still be busy transmitting the previous input command (or its corresponding output command). Figure 4. unicast and multicast feedthrough times assuming process-first scheduling: (top-left) replicated IM results with LAN (i.e. 0ms) network latencies and the P2 laptop as the source; (top-right) centralized Next Slide PowerPoint command results with random latencies between 0ms and 72ms and a P4 desktop as the source; (bottom) replicated Next Slide PowerPoint command results with 72ms network latencies and a P3 desktop as the source.
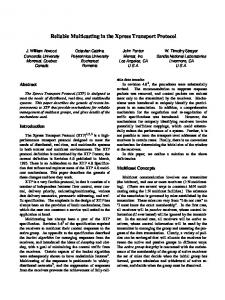
the path from the source to a destination contributes its processing cost to the feedthrough time to the destination. Since the length of the path from the source to any destination in the traditional collaboration architectures is one, this cost is incurred only once. With multicasting, the paths can be longer than length one, in which case this cost is incurred multiple times. Nevertheless, as the number of users increases, eventually it pays to use the multicast scheme as the increasing transmission time of the source begins to dominate the constant processing costs. In some cases, the number of users has to be quite high (1000 in Figure 4 bottom). In traditional collaboration architectures, the process-first policy degrades feedthrough times (in comparison to the transmit-first policy) as remote users must wait for the master to process the input. As shown by the above results, in the biarchitecture model, this policy can further degrade feedthrough times because a destination must wait for each computer on the path to it from the source to finish processing input. D. Response Time Results Intuitively, multicast can improve feedthrough times because it distributes the data transmission task among multiple computers. In other words, it relieves the source computer from the task of sending data to all destinations. Because of this, multicast also improves response times for both transmit-first and process-first scheduling policies. Consider first the transmit-first scheduling policy. Recall that when this is the case, an end-host must first complete the transmit task before starting the process task. Therefore, the quicker the end-host can complete the transmit task, the quicker it will be able to show the output to its local user, thereby improving the response time. To verify this prediction, we measured the total transmission times of the source computer in the above feedthrough time simulations of the transmit-first scheduling policy scenarios. Figure 5 (left), which shows how much multicast reduces the total transmission times of the source computer compared to unicast, confirms our prediction.
In this case, the processing of the previous command delays the time at which the computer begins to process the next input command, which in turn, increases the response time of the command. Thus, by reducing the source computer’s transmission time, multicasting increases the chances that when the user at the source computer enters consecutive input commands, the user’s computer can begin processing each one as soon as it is entered. Figure 5 (right) shows that the response time of the second input command out of a quiescent state can be improved by as much as 6.8 seconds. The reason the two graphs in Figure 5 look very similar is because other than the scheduling policy setting, the parameters used in their simulations were identical. As HMDM does not take into account scheduling policies, the results of the two simulations must be similar. We also have results that show that by reducing the source computer’s total transmission time, multicast also improves response and feedthrough time degradation. In particular, when think times are low (i.e. zero), such as when a user is telepointing, multicast reduces the increase in response and feedthrough times of each consecutive telepointer command. Due to lack of space, we do not present these results here. E. Task Completion Time Results The discussion so far has outlined two benefits of using multicast, namely, improved response and feedthrough times. However, these benefits do not come for free; in particular, processing time must be spent building the multicast tree (we assume that cost of arranging end-hosts into the tree is low). Table 1 gives the cost of building the multicast tree for different number of collaborators. It shows that when the number of collaborators is less than fifty, this cost is negligible. On the other hand, for collaborations with more than 1000
Figure 5. Response time improvements with multicast for transmit-first (left) and process-first scheduling policy (right).
Table 1. HMDM build time in seconds # Users Build Time (s)
50 0
100 0.03
500 3.32
1000 30.61
1500 178.9
2000 573.1
order for the task completion time to be improved by using the multicast communication architecture. Regardless of whether or not multicast is used, the task completion time is at least the amount of “talk time” the lecturer has. Because it is the same in all cases, we ignore it from now on. Instead, we focus on the component of the task completion time caused by the lecturer waiting for all the observers to see outputs for the lecturer’s input commands. Consider the unicast case first. The task completion time equals the Start Presentation feedthrough time, start (unicast), plus the Next Slide feedthrough time, slide(unicast), multiplied by the number of slides, Z(unicast). Therefore, the unicast task completion time is taskCompTime(unicast) = start(unicast) + Z(unicast)*slide(unicast)
Figure 6. (top-left) “Start Presentation,” (top-right) “Next Slide” feedthrough improvement for multicast compared to unicast communication architectures, and (bottom) task completion times for the centralized processing architecture as the number of PPT slides increases. Table 2. Selected absolute values from Figure 6 (seconds) # Users 50 100 500 1000 1500 Cent “Start” 0.14 0.29 1.59 3.22 4.85 Rep “Start” 35.2 75.6 403.3 814.5 1226 Cent “Slide” 0.28 0.61 3.35 6.78 10.2 Rep “Slide” 0 0 0.02 0.05 0.07
2000 6.48 1638 13.63 0.1
Table 3. The number of PPT slides that must be presented in order to gain an advantage in the task completion time # Users 50 100 500 1000 1500 2000 # Slides 0 0 1 5 18 42
participants such as presentations to a company division, the cost can be very high. Can it make sense to use multicasting when the cost of creating a multicast tree is high? To answer this question, consider a PPT scenario in which the source computer is a P4 desktop and the network latencies are set to 0ms between all computers. Assume that all computers are running the transmit-first scheduling policy and the lecturer does not begin talking about a slide until all observers can see the slide. In order to reduce the feedthrough times of PowerPoint input commands, the lecturer chooses to wait for the multicast tree to complete before starting the lecture. One issue is selecting for which PowerPoint command to create the multicast overlay, Start Presentation or Next Slide. Whichever command the tree is not created for may not experience as good of performance as when a tree specifically built for it is used. Suppose that because the transmission cost of the Start Presentation command dominates that of the Next Slide command in the replicated case, while they are similar in the centralized case, the tree for the Start Presentation command is used. Figure 6 shows the maximum feedthrough time improvement when multicast is used instead of unicast for Start Presentation (top-left) and Next Slide (top-right) commands. Table 1 contains the multicast overlay build times for select numbers of users. Given these results, we can calculate the least number of slides the lecturer must present in
Now consider multicast case. The task completion time consists of the time required to build the multicast overlay, build(multicast), plus the Start Presentation feedthrough time, start(multicast), plus the Next Slide feedthrough time, slide(multicast) multiplied by the number of slides, Z(multicast). Therefore, the multicast task completion time is taskCompTime(multicast) = build(multicast) + start(multicast) + Z(multicast)*slide(multicast)
To find the number of slides at which it pays to wait for the multicast tree to build, we set Z(unicast) = Z(multicast) = Z. Then, solving the equations, we get Z = (build(multicast) + start(multicast) – start(unicast))/(slide(unicast) slide(multicast))
Using data from Table 2, we can calculate the number of slides the lecturer needs to present in order for the task completion time to be reduced by using multicast (Table 3). Figure 6 (bottom) illustrates the task completion times for the centralized processing architecture when there are 2000 collaborators. As Figure 6 (bottom) shows, the initial wait of 573.1 seconds to build the multicast overlay reduces the task completion time for presentations with 42 or more slides. Interestingly, we have found that in the replicated processing architecture case, it pays off to wait for the multicast tree to be created and deployed even when there are 2000 collaborators. Using the same mathematical setup used to show the centralized processing architecture results, it turns out that unless the presentation has more than 10514 slides, it pays wait for the multicast tree to be built. The reason is that when a user enters the Start Presentation command and the source computer must transmit copies of the PowerPoint file (7.6Mb) to the 1999 observers. In this case, we can calculate using data in Table 1 and Table 2 that the feedthrough time is over 17 minutes longer than the total time required to build the multicast overlay and transmit the Start Presentation command using it. Nevertheless, the maximum feedthrough time function is linear with respect to the number of users while the HMDM runtime is cubic. Thus, as the number of users increases, eventually, it is better to use the unicast for the Start Presentation command, even though the feedthrough times of the Next Slide may not be optimized. The question of whether the users will prefer to wait to start the presentation to obtain feedthrough benefits is a user study issue.
IV.
DISCUSSION AND CONCLUSIONS
The contributions of our work can be described at various levels of detail. The most abstract message is that multicast must be considered as an alternative to unicast in distributed synchronous collaborations as it can significantly improve the performance of such collaborations. This is important because lack of tolerable performance in a given scenario may result in users turning to the more expensive alternative of face-to-face collaboration. Even worse, it may result in first-time users never trying collaboration technology again. We show that multicast can improve feedthrough and response times by multiple seconds and task completion times by multiple minutes. Results by Shneiderman [9] show that users can notice 50ms response times, which seems to imply that they can also notice 50ms increments (or conversely, decrements) in response and feedthrough times. Hence the improvement of response and feedthrough times is important. Though less crucial, task completion times are also important, especially in tightly-scheduled meetings. One of the PowerPoint presentations whose log we recorded was allocated a five minute time-slot. Therefore, a one-minute delay in the task completion time in this scenario forces the presenter to skip over a significant portion of the talk. Our next-level message is that the traditional set of multicast performance factors, consisting of network latencies and transmission times, is insufficient for providing optimal multicast overlays in our domain. In particular, the set of parameters must be expanded to include processing times, scheduling policies, and think times. Finally, we introduce the bi-architecture collaboration systems model which augments traditional collaboration architectures by adding to them support for multicast. Our work also presents two implementation guidelines for future collaboration systems. The first guideline stems from the result that the time required to build a multicast tree, regardless of whether or not it degrades task completion times, delays the start of the collaboration session. It would be useful to support dynamic creation and deployment of the multicast overlay. In particular, collaborations can begin with a unicast communication architecture when multicast overlay build times are large. Then, once the overlay is created, it can be deployed dynamically to improve the feedthrough times of commands from that point on. In this case, however, the feedthrough times of the commands entered before the overlay is deployed can be (significantly) higher than if they were entered after the overlay is deployed. The second guideline is regarding scheduling policies. We have seen above that multicast overlays created by HMDM can improve feedthrough times when a transmit-first scheduling policy is used and can degrade them when the process-first scheduling policy is used. Therefore, transmit-first should be used with the current implementation of the HMDM algorithm. On the other hand, process-first scheduling policies favor response times. There may be occasions where it is necessary to optimize response times. In this case, a mix of the processfirst and transmit-first scheduling policies can be used. The
source computer can use the process-first policy, which optimizes response times, and others can use the transmit-first policy, which enables HMDM to create multicast overlays that significantly improve feedthrough times. The logs we used had limited interactivity. The PowerPoint log had unidirectional data flow, and the checkers and chat logs had very low bandwidth requirements. It would be useful to determine if these results apply to collaboration such as multiplayer online games [8] that have more interactivity and symmetric participation. The response and feedthrough time benefits of multicast should be particularly relevant to architectures used by these games. For instance, in some such centralized architectures, the server must both process the input commands of all users and distribute the shared state it computes. In this case, server performance is critical to the interactivity of the game. A multicast overlay built using the server and the players’ computers can reduce the server’s transmission burden, and hence, allow more processor time to be scheduled for the computation of shared state. Experiments are needed to evaluate if the feedthrough times will be improved, as extra computers on the path from the server to a destination can degrade them, as shown above. An issue that must be addressed is overlay maintenance, as players dynamically join and leave. Another issue is our assumption about single-threading, as implementations of these games use different threads for processing and transmitting. As mentioned above, we did not directly evaluate the hybrid version of the bi-architecture model. However, the results for replicated and centralized architectures can be applied to the replicated and centralized aspects of hybrid architectures. For example, the centralized architecture results apply when a master computer and its slaves are organized into a multicast tree in which output commands from the master computer are transmitted. Similarly, the replicated architecture results apply when master computers are organized in a multicast tree along which input commands are transmitted. REFERENCES [1] [2] [3] [4] [5] [6]
[7]
[8]
[9]
Brosh, E. and Shavitt, Y., “Approximation and heuristic algorithms for minimum delay application-layer multicast trees,” INFOCOM 2004. Chawathe, Y., McCanne, S., and Brewer, E. A., “RMX: reliable multicast for heterogeneous networks,” INFOCOM 2000. Correa, C. D. and Marsic, I., “Software framework for managing heterogeneity in mobile collaborative systems,” CSCW, 14, 5-6 (2004). DataBeam, www.imtc.org/t120body.htm. Dewan, P.. “Architectures for collaborative applications. Trends in software,” special issue on Collaborative Systems. Diot, C., Levine, B., Lyles, J., Kassem, H., and Balensiefen, D., “Deployment issues for the IP multicast service and architecture,” IEEE Network, 14(1), Jan-Feb 2000. Floyd, S., Jacobson, V., Liu, C.G., McCanne, S., and Zhang, L., “A reliable multicast framework for light-weight sessions and application level framing,” IEEE Trans on Networking, 5(6), Dec 97. Graham, T.C.N., Phillips, W.G., and Wolfe, C., “Quality analysis of distribution architectures for synchronous groupware,” CollaborateCom 2006. Shneiderman, B., “Response Time and Display Rate. Designing the User Interface: Strategies for Effective Human-Computer Interaction,” 4th edition,. Addison-Wesley Longman