Hindawi Publishing Corporation Computational and Mathematical Methods in Medicine Volume 2014, Article ID 181245, 12 pages http://dx.doi.org/10.1155/2014/181245
Research Article Multiple Adaptive Neuro-Fuzzy Inference System with Automatic Features Extraction Algorithm for Cervical Cancer Recognition Mohammad Subhi Al-batah,1 Nor Ashidi Mat Isa,2 Mohammad Fadel Klaib,3 and Mohammed Azmi Al-Betar4,5 1
Department of Computer Science and Software Engineering, Faculty of Science and Information Technology, Jadara University, P.O. Box 733, Irbid, Jordan 2 Imaging and Computational Intelligence (ICI) Group, School of Electrical & Electronic Engineering, Universiti Sains Malaysia, Engineering Campus, 14300 Nibong Tebal, Penang, Malaysia 3 Software Engineering Department, College of Computer Science & Engineering, Taibah University P.O. Box 344, Madinah 30001, Saudi Arabia 4 Department of Information Technology, Al-Huson University College, Al-Balqa Applied University, P.O. Box 50, Jordan 5 School of Computer Sciences, Universiti Sains Malaysia, 11800 Penang, Malaysia Correspondence should be addressed to Mohammad Subhi Al-batah;
[email protected] Received 18 September 2013; Revised 13 December 2013; Accepted 17 December 2013; Published 23 February 2014 Academic Editor: Chris Bauch Copyright © 2014 Mohammad Subhi Al-batah et al. This is an open access article distributed under the Creative Commons Attribution License, which permits unrestricted use, distribution, and reproduction in any medium, provided the original work is properly cited. To date, cancer of uterine cervix is still a leading cause of cancer-related deaths in women worldwide. The current methods (i.e., Pap smear and liquid-based cytology (LBC)) to screen for cervical cancer are time-consuming and dependent on the skill of the cytopathologist and thus are rather subjective. Therefore, this paper presents an intelligent computer vision system to assist pathologists in overcoming these problems and, consequently, produce more accurate results. The developed system consists of two stages. In the first stage, the automatic features extraction (AFE) algorithm is performed. In the second stage, a neuro-fuzzy model called multiple adaptive neuro-fuzzy inference system (MANFIS) is proposed for recognition process. The MANFIS contains a set of ANFIS models which are arranged in parallel combination to produce a model with multi-input-multioutput structure. The system is capable of classifying cervical cell image into three groups, namely, normal, low-grade squamous intraepithelial lesion (LSIL) and high-grade squamous intraepithelial lesion (HSIL). The experimental results prove the capability of the AFE algorithm to be as effective as the manual extraction by human experts, while the proposed MANFIS produces a good classification performance with 94.2% accuracy.
1. Introduction Cervical cancer is a malignant disease that develops in the cells of the cervix or the neck of the uterus [1]. It is considered as the second most common form of cancer in women worldwide, ranked after breast cancer [2]. It causes loss of productive life in women both due to early death as well as prolonged disability. The primary reason is lack of awareness of the disease and access to screening and health services [3]. According to survey, one woman dies every seven minutes
of cervical cancer and by the year 2025, it is estimated to be one death in every five minutes [4]. However, in most cases, cervical cancer takes many years to develop from normal to advanced stage [5, 6]. Hence, the incidence and mortality related to this disease can be significantly reduced through early detection and proper treatment [7, 8]. There are wide varieties of screening techniques for cervical cancer [9–13]. Papanicolau smear test is a well-known screening method for detecting abnormalities of the cervix cells [14]. Due to scarce number of skilled and experienced
2
Computational and Mathematical Methods in Medicine
Cervical cancer image
Threshold value finding (clustering technique)
Centroid location finding (invariant moment technique)
Segmentation and features extraction (region growing technique)
Classification (MANFIS)
AFE algorithm
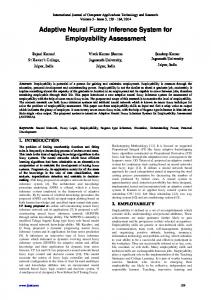
Figure 1: Cervical cancer computer vision system stages.
cytologists, the screening procedure becomes time consuming and highly prone to human errors that leads to inaccurate and inconsistent diagnosis [15]. This condition increases the risk that patients who get human papillomavirus (HPV) infection will not be detected and become HPV carriers. These factors can hide and obscure the important cervical cells morphologies, thus increasing the rate of false diagnosis rate [16]. Nowadays, computer-aided screening or diagnostic system based on artificial intelligence (AI) could be a promising tool to produce a more accurate and faster screening and/or diagnostic result for cancer patients. A considerable number of researches were carried out specifically with the attempts to automate both the Pap smear and the LBC classification based on AI [17–20]. The classification requires cervical cell features to be extracted manually by human expert from the Pap smear and the LBC image as the input data [21, 22]. The automated classification system may not only reduce the time required for sample classification, but also reduce the misclassification of sample due to eye fatigue or human error [23, 24]. Therefore, this work presents automatic recognition method for cervical cancer images that contains single cervical cell. The proposed method comprises feature extraction and classification. The feature extraction is a three-step process with clustering, centroid computation, and segmentation. The classification is based on neuro-fuzzy inference.
2. The Proposed System An intelligent computer-vision system is proposed to enable automatic recognition of the cancerous cells. Firstly, the images are captured from the slides by using the AutoCapture system [25]. A total of 500 single cell images were selected from images captured for this study. Then, the automatic features extraction (AFE) algorithm is implemented to extract the features from the images [26]. The AFE algorithm involves moving 𝑘-mean (MKM) algorithm as clustering algorithm, seed-based region growing (SBRG) algorithm for the segmentation, and modified SBRG algorithm for features extraction process. The classification is developed using multiple adaptive neuro-fuzzy inference system (MANFIS). Figure 1 summarizes the flow of process of the proposed system.
3. Automatic Features Extraction Algorithm 3.1. Threshold Value Finding. The 𝑘-means and fuzzy 𝑐-means clustering algorithms are commonly used in medical image segmentation [27, 28]. Many researchers have proved that
moving 𝑘-means (MKM) algorithm produces better features extraction performance of cervical cancer image as compared to 𝑘-means and fuzzy c-means clustering algorithms [29, 30]. In this study, MKM clustering algorithm is used to segment the image into three regions; that is, nucleus, cytoplasm, and background. Thus, the number of clusters is set to three (𝑛𝑐 = 3). The features extraction process begins with segmentation process that partitions the cervical cell into three main regions: nucleus, cytoplasm, and background of the cell (Figure 2). Grey level histogram of the cervical cell image is analyzed to obtain the initial centre of each region: 𝐶𝑁𝑜 , 𝐶𝐶𝑜 , and 𝐶𝐵𝑜 , for nucleus, cytoplasm, and background, respectively, as illustrated in Figure 2. Each region has a different range of grey level that starts with nucleus which has the lowest value, followed by cytoplasm and background. The MKM clustering algorithm is then used to determine the final value of each centre that is referred to as 𝐶𝑁, 𝐶𝐶, and 𝐶𝐵 for nucleus, cytoplasm, and background, respectively. Based on the Euclidean distance concept, the threshold value, 𝛽𝑁𝐶 and 𝛽𝐶𝐵 , is calculated based on 𝛽𝑁𝐶 =
(𝐶𝑁 + 𝐶𝐶) , 2
𝛽𝐶𝐵 =
(𝐶𝐶 + 𝐶𝐵 ) , 2
(1)
where 𝛽𝑁𝐶 is the threshold value to differentiate the nucleuscytoplasm area and 𝛽𝐶𝐵 is the threshold value to differentiate the cytoplasm-background area. To discuss the MKM algorithm, consider 𝑃(𝑥, 𝑦), pixels of one digital image with resolution of 𝑀 × 𝑁, where 𝑥 = 0, 1, 2, 3, . . . , 𝑀 − 1 and 𝑦 = 0, 1, 2, 3, . . . , 𝑁 − 1. The image is clustered into 𝑛𝑐 clusters (here, 𝑛𝑐 = 3 to represent nucleus, cytoplasm, and background areas) and has 𝐶𝑗 centres (the centres are 𝐶𝑁, 𝐶𝐶, and 𝐶𝐵 for nucleus, cytoplasm, and background of the cervical cell, resp.). The MKM algorithm that is used for threshold values finding on cervical cell image is described and flowcharted in Figure 3. 3.2. Centroid Location Finding. The centroid, or usually known as seed of the cervical cell image, is located by using the invariant moment technique [31]. The seed is used as a starting point for segmentation and features extraction process [32]. The centroid of cervical cell image is located inside the nucleus of the cell. Thus, a process to eliminate the cytoplasm and the background region is needed before the process of obtaining the centroid is applied. This process is called subclustering process [33]. The subclustering process of the nucleus region is based on the conventional seed-based region growing (SBRG) algorithm. A minor modification is implemented to the SBRG
Background CBo
Cytoplasm CCo
CNo
139 144 149 154 159 164 169 174 179 184 189 194 199 204 209 214 219 224 229 234 239 244 249 254
Cytoplasm
Nucleus
Threshold2
Nucleus
900 800 700 600 500 400 300 200 100 0
3
Threshold1
Background
Number of pixels
Computational and Mathematical Methods in Medicine
Intensity (grey level) (a)
(b)
Figure 2: An example of image histogram; divided into 3 regions, nucleus, cytoplasm, and cell background.
algorithm, as compared to the original SBRG algorithm where the seed location for the region growing process is located at the background of the cervical cell, that is, at coordinate (0, 0). The flowchart of subclustering process using SBRG algorithm is shown in Figure 4.
(6) Calculate average grey level value, 𝑥, and standard deviation, 𝜎, of the seed pixel(s) grown so far using 𝑥=
∑𝑛𝑖=1 𝑥𝑖 , 𝑛 2
3.3. Segmentation and Features Extraction. There are several approaches that can be used to perform segmentation by using the region growing method. In this study, the modified SBRG algorithm is adopted [30]. The algorithm is used to segment the cervical cell image into three main regions: nucleus, cytoplasm, and background. Simultaneously, all the features needed from the image are extracted. The features are size, average grey level value, and perimeter for both the nucleus and cytoplasm, respectively. These features are usually used by pathologist for screening cervix cancer disease. The modified SBRG algorithm can be implemented as follows.
∑𝑛 (𝑥 − 𝑥) 𝜎 = √ 𝑖=1 𝑖 . 𝑛−1
(2)
(7) Compare the seed pixel with one of the neighbour pixels. The neighbour pixel is selected to become member of the growing area if one of the following conditions is fulfilled:
(4) Select 𝑁 × 𝑁 array of pixels, where 𝑁 is an odd number.
(a) if the gradient between the original grey level value and the grey level value after histogram equalization process is less than 95% AND the original grey level value is equal or greater than the 𝛽𝑁𝐶 value (𝛽𝐶𝐵 value for Step 12); (b) if the gradient between the original grey level value and the grey level value after histogram equalization process is same or larger than 95% AND the original grey level value is same or larger than the difference between the 𝑥 and the 𝜎; that is, (𝑥 − 𝜎). If one of the conditions is fulfilled, (i) increase the variable nucleus size by 1 (for Step 12, increase the variable cytoplasm size by 1), (ii) perform summation of grey level value of the selected pixel with grey level value of previous selected pixels, ∑𝑥 ∑𝑦 𝐺𝐿𝑁(𝑥, 𝑦). Assign the result to variable total grey level nucleus (for Step 12, perform summation of grey level value of the selected pixel with grey level value of previous selected pixels, ∑𝑥 ∑𝑦 𝐺𝐿𝐶(𝑥, 𝑦). Assign the result to variable total grey level cytoplasm).
(5) Establish initial seed pixel location at coordinate ̃ 𝑦). ̃ (𝑥,
(8) Choose the neighbour pixel that has fulfilled the growing conditions as the new seed pixel.
(1) Obtain the nucleus-cytoplasm threshold value, 𝛽𝑁𝐶, cytoplasm-background threshold value, 𝛽𝐶𝐵 , and ceñ 𝑦), ̃ from the techniques discussed troid location, (𝑥, in Sections 3.1 and 3.2. The centroid is used as a starting point for the algorithm to execute. (2) Set the following variables: (a) 𝑛𝑢𝑐𝑙𝑒𝑢𝑠 𝑠𝑖𝑧𝑒 = 1, 𝑐𝑦𝑡𝑜𝑝𝑙𝑎𝑠𝑚 𝑠𝑖𝑧𝑒 = 1, (b) total grey level nucleus = grey level value for seed pixel, 𝐺𝐿 𝑁(𝑥, 𝑦), total grey level cytoplasm = grey level value for seed pixel, 𝐺𝐿 𝐶(𝑥, 𝑦). (3) Apply median filter and histogram equalization process on the image.
4
Computational and Mathematical Methods in Medicine Step 1 Choose an image with a single cervical cell
Step 8
Step 2 Initialize CNo , CCo , and CBo Set 𝛼a = 𝛼b = 𝛼o
Calculate the centre 1 ∑ ∑ P(x, y) nj y∈C x∈C
Cj =
𝑗
Step 3
Step 9
Calculate the centre (Cj ) 1 Cj = ∑ ∑ P(x, y) nj y∈C x∈C 𝑗
𝑗
𝛼a = 𝛼o 𝛼b = 𝛼b − 𝛼b /nC
𝑗
Step 10
Step 4 Check the fitness f(Cj ) of each centre
f(Cj ) = ∑ ∑ (‖P(x, y) − (Cj )‖)
Yes
2
f(CS ) ≥ 𝛼b f(CL )
Sort the centres in ascending order
No
Step 11
y∈C𝑗 x∈C𝑗
Step 5
Calculate 𝛽NC and 𝛽CB 𝛽NC =(CN + CC )/2
Find smallest CS and largest CL of f(Cj )
𝛽CB =(CC + CB )/2
Stop
Step 6.1
Step 6
CS = CL
Yes
Yes
P(x, y) < CL
f(CS ) < 𝛼a f(CL ) No
No Step 6.2 Step 7
Recalculate CS and CL 1 CS = ∑ ∑ P(x, y) nS y∈C x∈C 𝑆 𝑆 1 ∑ ∑ P(x, y) CL = nL y𝜖C x𝜖C 𝐿
𝛼a = 𝛼a − 𝛼a /nC
𝐿
Yes
f(CS ) ≥ 𝛼a f(CL ) No
Figure 3: Flowchart summarising the method used by moving 𝑘-means clustering.
(9) Mark the pixel as Checked. (10) Assign the pixel with value 0 (black). (11) Repeat Steps 5 to 9 by taking the neighbour pixel that has fulfilled the growing conditions as the new seed pixel until the entire image has been checked or cannot be grown. Mark the border pixel as nucleus border.
(12) Take 𝛽𝐶𝐵 , and repeat Steps 5 to 7 for cytoplasm region ̃ 𝑦) ̃ as seed pixel. by using the same centroid pixel, (𝑥, (13) Assign the pixel that fulfilled the growing conditions and has not yet being marked as Checked with value 127 (grey). (14) Repeat Steps 12 and 13 until the entire image has been examined or cannot be grown. Mark the border pixel as cytoplasm border.
Computational and Mathematical Methods in Medicine
5
Obtain 𝛽NC
Establish the seed location at coordinate P(0, 0)
Gradient (original histogram) < 95% and original ≥ 𝛽NC
No
Apply median filter and histogram equalization process Select N × N array of pixels
where N is an odd number
x= 𝜎=√
Gradient (original histogram) ≥ 95% and original ≥ (x − 𝜎)
Yes
∑ ni=1 xi n
∑ in=1 (xi − x)2 n−1
No
Neighbour pixel is a member of growing area
Compare the seed pixel with one of the neighbour pixels
Choose the neighbour pixel with value 255 (white)
No
Whole image checked?
Apply median filter algorithm
Yes
on the resulting image (nucleus region)
Implement the following equations m00 = ∑ ∑ axy x
Stop
y
m10 = ∑ ∑ xaxy x
y
m01 = ∑ ∑ yaxy x
̃= x
y
m10 m ̃ = 01 y m00 m00
Figure 4: Flowchart summarising the steps of SBRG algorithm.
(15) Mark all other pixels that are not involved in the growing process with value 255 (white). (16) Count the pixel that has been marked as nucleus border and cytoplasm border. The perimeter of nucleus, 𝑃𝑁, is equal to total amount of pixel marked with nucleus border, and the perimeter of cytoplasm, 𝑃𝐶, is equal to total amount of pixel marked with cytoplasm border.
(17) The size of nucleus, 𝑛, is equal to value of nucleus size. For cytoplasm, the actual size, 𝑐, is equal to 𝑐 = cytoplasm size − 𝑛.
(3)
(18) Calculate the average grey level value for the nucleus, 𝐺𝐿𝑁, using 𝐺𝐿𝑁 =
∑𝑥 ∑𝑦 𝐺𝐿𝑁 (𝑥, 𝑦) 𝑛
.
(4)
6
Computational and Mathematical Methods in Medicine
Calculate the average grey level value for the cytoplasm, 𝐺𝐿𝐶, using 𝐺𝐿𝐶 =
∑𝑥 ∑𝑦 𝐺𝐿𝐶 (𝑥, 𝑦) − ∑𝑥 ∑𝑦 𝐺𝐿𝑁 (𝑥, 𝑦) 𝐶
.
(5)
A few modifications have been applied on the conventional SBRG algorithm so that the modified SBRG algorithm is capable of automatically extract the features from the cervical cell image. Processes to obtain the threshold values and the initial seed location are carried out automatically. The threshold values, 𝛽𝑁𝐶 and 𝛽𝐶𝐵 , are obtained from MKM clustering algorithm whereas the initial seed location is acquired from the invariant moment technique. The modified SBRG algorithm is simultaneously used for segmentation and features extraction. Steps 10, 13, and 15 segment the image so that the nucleus, cytoplasm, and background region will be marked as black, grey, and white, respectively. Thus, the background region will be easily eliminated from the image. The extraction process begins at Step 2 where the centroid is automatically accepted as nucleus region member. This is because the determination process for the centroid location is basically done using clustering technique in nucleus region. The neighbour pixels will then be examined and will be accepted as nucleus region member if the growing condition is fulfilled. It will then increase the number of pixels grown by one, according to Step 7. At the same time, the grey level value of the new member will be extracted and summed with total of grey level value of accepted members. After completing the growing process, the total number of nucleus region members will represent the size of nucleus, 𝑛, as shown in Step 17. Pixels that formed the border of nucleus will be calculated as perimeter of the nucleus, 𝑃𝑁. The average grey level value for nucleus region is given by (4). Region growing process for extracting cytoplasm features started at Step 12. By using the same methods, only pixels that fulfilled the conditions are accepted to become cytoplasm region members. The region growing process for the cytoplasm starts at the same seed location of the nucleus. Thus, the features extracted will contain the same features obtained from the extraction process of nucleus region, except for perimeter. Therefore, after completing the region growing process for the cytoplasm region, the number of pixels grown will be deducted with size of nucleus, 𝑛, to get the actual size of cytoplasm, 𝑐, as shown in (3). For the average grey level value, the summation of grey level for cytoplasm will be deducted with the summation of grey level for nucleus before dividing the result with the actual size of cytoplasm, 𝑐, as shown in (5).The flowchart of modified SBRG algorithm is presented in Figure 5.
4. Discussion of AFE Algorithm The AFE algorithm is used to perform the extraction process of the cervical cell images. From 500 single cell images, 3 images (normal, LSIL, and HSIL) were selected arbitrarily for analysis in this section. For fair comparison, the resolution of every single image is saved as 160×120. Figures 6(a), 6(b), and
Table 1: Final centres and threshold values for normal, LSIL, and HSIL. Image Normal LSIL HSIL
Final centres
Threshold values
𝐶𝑁
𝐶𝐶
𝐶𝐵
𝛽𝑁𝐶
𝛽𝐶𝐵
153 161 152
190 194 187
227 234 235
171 177 169
208 214 211
6(c) represent the normal, LSIL, and HSIL images with their grey level histogram, respectively. In the grey level histogram figure, the 𝑥-axis represents the grey level value, and the 𝑦axis represents the number of pixels. 4.1. Threshold Values, 𝛽𝑁𝐶, and 𝛽𝐶𝐵 . The first process that needs to be carried out is clustering process. The clustering process starts with histogram analysis to obtain the initial centres, 𝐶𝑁𝑜 , 𝐶𝐶𝑜 , and 𝐶𝐵𝑜 for nucleus, cytoplasm, and background region, respectively. The MKM clustering algorithm is then used to determine the final value of each centre that is referred to as 𝐶𝑁, 𝐶𝐶, and 𝐶𝐵 . The final centres values for each cervical cell image as tabulated in Table 1 are located at the correct location according to the grey level histogram in Figures 6(a), 6(b), and 6(c). The 𝐶𝑁, 𝐶𝐶, and 𝐶𝐵 final centres are located at the centre of nucleus, cytoplasm, and background of their grey level histogram region, respectively. The final centre values were used to calculate the threshold values for nucleus-cytoplasm and cytoplasm-background region. To find all the members for each centre, the Euclidean distance concept was adopted. From the concept, to find the threshold value between nucleus and cytoplasm, 𝛽𝑁𝐶, and the threshold value between cytoplasm and background, 𝛽𝐶𝐵 , the average value between 𝐶𝑁 and 𝐶𝐶 and the average value between 𝐶𝐶 and 𝐶𝐵 have been calculated, respectively. The results of final centre and threshold values for normal, LSIL, and HSIL image are presented in Table 1. From the table and its corresponding grey level histogram, the 𝛽𝑁𝐶 and 𝛽𝐶𝐵 are the grey level values which limit the group of pixels inside the nucleus and cytoplasm clusters, respectively. From the results, the threshold values have been successfully determined by using the MKM clustering algorithm. ̃ 𝑦). ̃ Centroid location finding is 4.2. Centroid Location, (𝑥, the second process after obtaining the threshold values, for the segmentation and features extraction process could start. The centroid is located inside the nucleus of the cervical cell and needs to be determined automatically. Thus, a process called subclustering is needed to distinguish the cytoplasm and background region of the cell. The 𝛽𝐶𝐵 values from the clustering process are used to subcluster the images. The nucleus area is used to find the centroid location by using the invariant moment technique. As shown in Figure 7, the centroid location is 𝑥 = 72, 𝑦 = 51 for normal cell, 𝑥 = 71, 𝑦 = 65 for LSIL, and 𝑥 = 68, 𝑦 = 56 for HSIL. From the observation, it can be noted that the centroid location for each image is located at the centre of the nucleus area. From the results, it can be stated that the process of finding the
Computational and Mathematical Methods in Medicine
7
Obtain 𝛽NC , 𝛽CB , and centroid location (x, y) Nucleus size = 1 Cytoplasm size = 1 Total grey level nucleus = GL N (x, y) Total grey level cytoplasm = GL C (x, y) Gradient (original histogram) < 95% and original ≥ 𝛽NC
Apply median filter and histogram equalization process Select N × N array of pixels where N is an odd number
No
Flag 𝛽NC = 1 Flag 𝛽CB = 0 Establish initial seed pixel location at coordinate (x, y)
Yes
∑ ni=1 xi n n 2 ∑ (x i − x) i =1 𝜎=√ n−1
Gradient (original histogram) ≥ 95% and original ≥ (x − 𝜎)
x=
No
Nucleus size+ = 1
Find summation of GL N (x, y)
Compare the seed pixel with one of the neighbour pixels Yes
Flag 𝛽NC == 1 Neighbour pixel = 255
No
Neighbour pixel = 127
Neighbour pixel = 0
No
Whole image checked?
Yes
Flag 𝛽NC = 0 Flag 𝛽CB = 1
Whole image checked?
Yes
No
Stop
n = nucleussize c = cytoplasm − n ∑ x ∑ y GL N (x, y) GLN = n GLC =
Pc = cytoplasm border PN = nucleus border
∑ x ∑ y GL C (x, y) − ∑ x ∑ y GL N (x, y) C
Figure 5: Flowchart summarising the steps of modified SBRG algorithm.
8
Computational and Mathematical Methods in Medicine
1,200
1400
600
1,000
12000
500
800
1000
400
600
700
300
800 600
400
200
400
200
100
0
50
100
150
200
250
0
200
0
50
100
(a)
150
200
250
0
0
50
(b)
100
150
200
250
(c)
Figure 6: Cervical cancer image and grey level histogram.
centroid location has been successfully achieved by using the subclustering and the invariant moment technique. 4.3. Segmentation. After getting the threshold values and the centroid location of the cervical cell image, segmentation process is executed. The algorithm involved is modified SBRG algorithm that starts at centroid location determined earlier and grows towards the image border. Pixels values that are equal to or smaller than the 𝛽𝑁𝐶 value (and some other conditions described in growing condition, Section 3.3) are marked with value 0 indicating the nucleus region. For the cytoplasm region, pixels values that are equal to or smaller than the 𝛽𝐶𝐵 value (and some other conditions described in growing condition, Section 3.3) are marked with value 127. The remaining pixels values are assigned with value 255 for the background of the cervical cells. The results shown in Figure 8 proved that the modified SBRG algorithm has successfully segmented the cervical cell images. 4.4. Features Extraction. The final step in order to extract the features of the cervical cells is features extraction process. The process is executed simultaneously with the segmentation process presented in the previous section. Thus, the algorithm involved is modified SBRG algorithm that read the pixels value at the same time when the segmentation process is executed. The size and grey level value for nucleus and cytoplasm were updated each time a new pixel that belongs to nucleus and cytoplasm clusters was examined. Pixels that form a border between nucleus-cytoplasm and cytoplasmbackground were marked and updated during the extraction process. The details about features extraction process were discussed in Section 3.3. The features that were extracted are shown in Table 2. The results showed that the normal
Table 2: Features extracted from normal, LSIL, and HSIL. Image
Normal LSIL HSIL
Cells’ Nucleus Cytoplasm Nucleus Cytoplasm Nucleus Cytoplasm
Size (pixels2 ) 337 8859 1155 6239 1327 3675
Features Perimeter (pixels) 89 1282 307 550 320 373
Gray level (0–255) 145.875 187.512 160.565 186.131 151.455 173.084
cell has smaller nucleus area and a very large cytoplasmic area, whereas abnormal cell has increased nucleus area but shrinking cytoplasmic area.
5. Classification The artificial neural network (ANN), fuzzy inference system (FIS), and neuro-fuzzy [34–47] are promising techniques which have proven to be very reliable in recent years. Neuro-fuzzy hybrid systems integrate the advantages of fuzzy systems for dealing with explicit knowledge which can be explained and understood and neural networks for dealing with implicit knowledge which can be acquired by learning. Therefore, combination of fuzzy system and neural networks handles limitations of both methods and offers an excellent data-mining opportunity to solve the critical and complex problem in pattern recognition [48]. One of most common tools is ANFIS which combined both fuzzy logic and neural network [49, 50].
Computational and Mathematical Methods in Medicine
(a)
9
(b)
(c)
Figure 7: (a) Centroid location for normal, (b) LSIL, and (c) HSIL.
(a)
(b)
(c)
Figure 8: (a) Segmentation result for normal, (b) LSIL, and (c) HSIL.
Table 3: The original number of the cervical cell images classes for the fivefold method.
Fold 1 Fold 2 Fold 3 Fold 4 Fold 5
Training samples (80%) Normal LSIL HSIL 300 64 36 310 62 28 308 58 34 317 52 31 309 62 29
Testing samples (20%) Normal LSIL HSIL 76 15 9 66 17 17 68 21 11 59 27 14 67 17 16
x1
x2 x3
ANFIS
f1
ANFIS
f2
ANFIS
f3
x4
x5
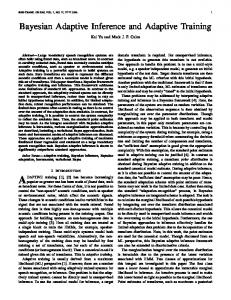
The acronym ANFIS stands for adaptive neuro-fuzzy inference system which is a multi-input, single-output model [51]. However, A multioutput model can be designed by connecting few single output models. Thus, a multiple adaptive neuro-fuzzy inference system (MANFIS) is proposed in the presented study. The MANFIS contains a number of ANFIS models which are arranged in parallel combination to produce a model with multiple outputs. Figure 9 shows an example of MANFIS with six inputs, 𝑥1 , 𝑥2 , 𝑥3 , 𝑥4 , 𝑥5 , and 𝑥6 , and three outputs, 𝑓1 , 𝑓2 , and 𝑓3 . A hybrid learning algorithm which combines least squares estimation and back propagation is used for membership function parameter estimation. The advantage of hybrid method is that it uses back propagation for parameter associated with input membership function and least square estimation for parameters associated with output membership. A total of 500 single cell images have been used in the classification process (376 normal, 79 LSIL, and 45 HSIL),
x6
Figure 9: The architecture of the MANFIS with 6 inputs and 3 outputs.
where 80% of the cells (400 images) have been used for training and 20% of the cells (100 images) have been used for the MANFIS testing. Based on the analysis method which is proposed by Hoang [52], the fivefold analysis method is chosen. The accuracy percentage of each class is calculated by dividing the summation of the predicted number of cells over the summation of the original number of samples in each
10
Computational and Mathematical Methods in Medicine
Table 4: The predicted number of the cervical cell images classes for the fivefold method and the accuracy produced for each category and the overall accuracy of the training and test phases.
Normal 294 304 298 306 300 97.3
Fold 1 Fold 2 Fold 3 Fold 4 Fold 5 Average accuracy
Training LSIL 62 56 51 48 59 92.6
HSIL 35 25 32 29 27 93.7
Normal 73 61 65 54 66 94.9
class in all folds. The results obtained from the five tests are then averaged [53]: Accuracy = [
Number of correctly classified samples ] Total cell samples
∗ 100%. (6) Table 3 shows the number of samples of each cell category randomly selected for each fold. The results that have been yielded by the MANFIS in each fold are illustrated in Table 4. The table presents the number of predicted samples for each category of cell class (i.e., the normal, LSIL, and HSIL). The normal cells attain highest accuracy (97.3%) as compared to the LSIL (92.6%) and HSIL (93.7%) because the HSIL is almost similar to the LSIL. The average accuracy is measured based upon (6), and the produced results for overall classification process are 96.3% and 94.2% for training and testing phases, respectively. Thus, with the high accuracy obtained from the classification process, the system is concluded to be reliable and suitable to be applied for cervical cancer classification.
6. Conclusion An intelligent computer vision system has been developed for the classification of cervical cancer based on its morphological cell characteristics. The developed system is able to categorize the cervical cells into three groups, namely, normal, LSIL, and HSIL. The system consists of AFE algorithm and MANFIS classifier. The AFE algorithm is started with clustering technique using moving 𝑘-mean algorithm to find the threshold value to differentiate nucleus, cytoplasm, and background area of the cervical cell image. Invariant moment technique is performed to get the centroid or seed location for features extraction process. Segmentation and features extraction are then executed using modified SBRG technique. The AFE algorithm is capable to extract 6 features from the images (size, perimeter, and average grey level for both nucleus and cytoplasm). Finally, the features are used as inputs to the MANFIS for classification of the type of cervical cells. The training accuracy produced by MANFIS was 96.3% and the testing accuracy was 94.2% based on the fivefold analysis method. The system is proven to be very efficient and also helpful to be used by medical lab technicians and biologists.
Testing LSIL 13 15 20 26 16 92.8
HSIL 8 16 10 13 15 92.5
Accuracy Acc. train Acc. test 97.8 94.0 96.3 92.0 95.3 95.0 95.8 93.0 96.5 97.0 96.3 94.2
As it is desired to have high performance, improvement can be made by including other parameters for classification like nucleus to cytoplasm ratio, saturation, intensity, and so forth.
Conflict of Interests The authors declare that there is no conflict of interests regarding the publication of this paper.
Acknowledgment The authors gratefully acknowledge Dr. Fuad Subhi Al-Battah who is working at Orthopedic Surgery Department, Royal Rehabilitation Center in King Hussein Medical Center, for the valuable knowledge about cervical cancer and writing assistance of the paper.
References [1] N. H. Othman, “Cancer of the cervix—from bleak past to bright future: a review, with an emphasis on cancer of the cervix in Malaysia,” The Malaysian Journal of Medical Sciences, vol. 9, no. 2, pp. 13–26, 2002. [2] M. T. Sreedevi, B. S. Usha, and S. Sandya, “Papsmear image based detection of cervical cancer,” International Journal of Computer Applications, vol. 45, no. 20, pp. 35–40, 2012. [3] E. J. Domingo, R. Noviani, M. R. M. Noor et al., “Epidemiology and prevention of cervical cancer in Indonesia, Malaysia, The Philippines, Thailand and Vietnam,” Vaccine, vol. 26, no. 12, pp. M71–M79, 2008. [4] A. Hamid, U. S. Dwivedi, T. N. Singh, K. M. Gopi, V. Tondon, and P. B. Singh, “Artificial neural networks in predicting optimum renal stone fragmentation by extracorporeal shock wave lithotripsy: a preliminary study,” BJU International, vol. 91, no. 9, pp. 821–824, 2003. [5] H. S. Cronj´e, “Screening for cervical cancer in the developing world,” Best Practice & Research Clinical Obstetrics & Gynaecology, vol. 19, no. 4, pp. 517–529, 2005. [6] M. J. Walsh, M. J. German, M. Singh et al., “IR microspectroscopy: potential applications in cervical cancer screening,” Cancer Letters, vol. 246, no. 1-2, pp. 1–11, 2007. [7] M. J. Romeo, B. R. Wood, M. A. Quinn, and D. McNaughton, “Removal of blood components from cervical smears: implications for cancer diagnosis using FTIR spectroscopy,” Biopolymers, vol. 72, no. 1, pp. 69–76, 2003.
Computational and Mathematical Methods in Medicine [8] R. Lozano, “Comparison of computer-assisted and manual screening of cervical cytology,” Gynecologic Oncology, vol. 104, no. 1, pp. 134–138, 2007. [9] N. H. Othman, M. C. Ayub, W. A. A. Aziz, M. Muda, R. Wahid, and S. Selvarajan, “Is it an effective screening methods for cervical cancer neoplasia? An experience with 2289 cases,” The Malaysian Journal of Medical Science, vol. 4, no. 1, pp. 45–50, 1997. [10] D. V. Coleman, “Evaluation of automated systems for the primary screening of cervical smears,” Current Diagnostic Pathology, vol. 5, no. 2, pp. 57–64, 1998. [11] J. Karnon, J. Peters, J. Platt, J. Chilcott, E. McGoogan, and N. Brewer, “Liquid-based cytology in cervical screening: an updated rapid and systematic review and economic anlysis,” Health Technology Assessment, vol. 8, no. 20, pp. 1–78, 2004. [12] E. Lerma, L. Colomo, A. Carreras, E. Esteva, M. Quilez, and J. Prat, “Rescreening of atypical cervicovaginal smears using PAPNET,” Cancer Cytopathology, vol. 84, no. 6, pp. 361–365, 1998. [13] R. Ashfaq, B. Solares, and M. H. Saboorian, “Detection of endocervical component by PAPNET system on negative cervical smears,” Diagnostic Cytopathololgy, vol. 15, no. 2, pp. 121–123, 1996. [14] N. A. Mat-Isa, M. Y. Mashor, K. Z. Zamli, N. R. Mat-Noor, and N. H. Othman, “Supplementary and alternative techniques to interpret Pap smear: a review,” International Journal of Factory Automation, Robotics and Soft Computing, vol. 2, pp. 27–34, 2006. [15] B. K. Ane and D. Roller, “Adaptive intelligent systems for recognition of cancerous cervical cells based on 2D cervical cytological digital images,” in Machine Learning Algorithms for Problem Solving in Computational Applications: Intelligent Techniques, chapter 18, pp. 292–331, IGI Global, 2012. [16] N. Mustafa, N. A. Mat-Isa, U. K. Ngah, M. Y. Mashor, and K. Z. Zamli, “Linear contrast enhancement processing on preselected cervical cell of Pap smear images,” Technical Journal School of Electrical & Electronic Engineering, vol. 10, pp. 30–34, 2004. [17] N. K. Goyal, A. Kumar, S. Trivedi, U. S. Dwivedi, T. N. Singh, and P. B. Singh, “A comparative study of artificial neural network and multivariate regression analysis to analyze optimum renal stone fragmentation by extracorporeal shock wave lithotripsy,” Saudi Journal of Kidney Diseases and Transplantation, vol. 21, no. 6, pp. 1073–1080, 2010. [18] K. Turner, N. Ramanujam, J. Ghosh, and R. Richards-Kortum, “Ensembles of radial basis function networks for spectroscopic detection of cervical precancer,” IEEE Transactions on Biomedical Engineering, vol. 45, no. 8, pp. 953–961, 1998. [19] L. Zhong and K. Najarian, “Automated classification of Pap smear tests using neural networks,” in Proceedings of the International Joint Conference on Neural Networks (IJCNN ’01), vol. 4, pp. 2899–2901, Washington, DC, USA, July 2001. [20] Y. Jusman, N. A. Mat-Isa, R. Adnan, and N. H. Othman, “Intelligent classification of cervical pre-cancerous cells based on the FTIR spectra,” Ain Shams Engineering Journal, vol. 3, no. 1, pp. 61–70, 2012. [21] N. Mustafa, N. A. Mat-Isa, M. Y. Mashor, and N. H. Othman, “New features of cervical cells for cervical cancer diagnostic system using neural network,” in Proceedings of the MalaysiaJapan International Symposium on Advanced Technology, pp. 12– 15, Kuala Lumpur, Malaysia, 2007. [22] N. Mustafa, N. A. Mat-Isa, M. Y. Mashor, and N. H. Othman, “Capability of new features of cervical cells for cervical cancer
11
[23]
[24]
[25]
[26]
[27]
[28]
[29]
[30]
[31] [32]
[33]
[34]
[35]
[36]
[37]
diagnostic system using hierarchical neural network,” International Journal of Simulation Systems, Science & Security, vol. 9, no. 2, pp. 56–64, 2008. N. A. Mat-Isa, M. Y. Mashor, and N. H. Othman, “An automated cervical pre-cancerous diagnostic system,” Artificial Intelligence in Medicine, vol. 42, no. 1, pp. 1–11, 2008. N. A. Mat-Isa, M. Y. Mashor, and N. H. Othman, “Classification of cervical cancer cells using HMLP network with confidence percentage and confidence level analysis,” International Journal of the Computer, vol. 11, no. 1, pp. 17–29, 2003. N. R. Mat-Noor, N. A. Mat-Isa, M. Y. Mashor, N. H. Othman, K. Z. Zamli, and M. S. Al-Batah, “Automatic glass-slide capturing system for cervical cancer pre-screening program,” American Journal of Applied Sciences, vol. 5, no. 5, pp. 461–467, 2008. N. Mustafa, Features extraction of cervical cell based on ThinPrep images for cervical cancer diagnostic system [M.S. thesis], School of Electrical and Electronic Engineering, Universiti Sains Malaysia, Penang, Malaysia, 2007. W.-L. Hung, M.-S. Yang, and D.-H. Chen, “Parameter selection for suppressed fuzzy c-means with an application to MRI segmentation,” Pattern Recognition Letters, vol. 27, no. 5, pp. 424–438, 2006. J. K. Sing, D. K. Basu, M. Nasipuri, and M. Kundu, “Self-adaptive RBF neural network-based segmentation of medical images of the brain,” in Proceedings of the IEEE International Conference on Intelligent Sensing and Information, pp. 447–452, Calcutta, India, January 2005. M. Y. Mashor, “Hybrid training algorithm for RBF network,” International Journal of the Computer, the Internet and Management, vol. 8, no. 2, pp. 50–65, 2000. N. Mustafa, N. A. Mat-Isa, and M. Y. Mashor, “Automated multicells segmentation of thinprep image using modified seed based region growing algorithm,” Biomedical Soft Computing and Human Sciences, vol. 14, no. 2, pp. 41–47, 2009. G. J. Awcock and R. Thomas, Applied Image Processing, McGraw-Hill, New York, NY, USA, 1996. S. Paschalakis and M. Bober, “Real-time face detection and tracking for mobile videoconferencing,” Real-Time Imaging, vol. 10, no. 2, pp. 81–94, 2004. S. Ibrahim, N. E. A. Khalid, and M. Manaf, “Seed-Based Region Growing (SBRG) vs Adaptive Network-Based Inference System (ANFIS) vs Fuzzy c-Means (FCM): brain abnormalities segmentation,” World Academy of Science, Engineering and Technology, vol. 68, pp. 425–435, 2010. T. N. Singh, V. K. Singh, and S. Sinha, “Prediction of cadmium removal using an artificial neural network and a neuro-fuzzy technique,” Mine Water and the Environment, vol. 25, no. 4, pp. 214–219, 2006. S. Sinha, T. N. Singh, V. K. Singh, and A. K. Verma, “Epoch determination for neural network by self-organized map (SOM),” Computational Geosciences, vol. 14, no. 1, pp. 199–206, 2010. N. A. Mat-Isa, Z. M. Sani, and M. S. Al-Batah, “Automated Intelligent real-time system for aggregate classification,” International Journal of Mineral Processing, vol. 100, no. 1-2, pp. 41– 50, 2011. M. S. Al-Batah, N. A. Mat-Isa, K. Z. Zamli, and K. A. Azizli, “Modified recursive least squares algorithm to train the Hybrid Multilayered Perceptron (HMLP) network,” Applied Soft Computing Journal, vol. 10, no. 1, pp. 236–244, 2010.
12 [38] M. S. Al-Batah, N. A. Mat-Isa, K. Z. Zamli, Z. M. Sani, and K. A. Azizli, “A novel aggregate classification technique using moment invariants and cascaded multilayered perceptron network,” International Journal of Mineral Processing, vol. 92, no. 1-2, pp. 92–102, 2009. [39] N. A. Mat-Isa, M. S. Al-Batah, K. Z. Zamli, K. A. Azizli, A. Joret, and N. R. M. Noor, “Suitable features selection for the HMLP and MLP networks to identify the shape of aggregate,” Construction and Building Materials, vol. 22, no. 3, pp. 402–410, 2008. ¨ [40] B. Tas¸delen, S. Helvaci, H. Kalea˘gasi, and A. Ozge, “Artificial neural network analysis for prediction of headache prognosis in elderly patients,” Turkish Journal of Medical Sciences, vol. 39, no. 1, pp. 5–12, 2009. [41] Z. M. Sani, N. A. Mat-Isa, S. A. Suandi, M. S. Al-Batah, K. Z. Zamli, and K. A. Azizli, “Intelligent rock vertical shaft impact crusher local database system,” International Journal of Computer Science and Network Security, vol. 7, no. 6, pp. 57–62, 2007. [42] N. A. Mat-Isa, A. Joret, M. S. Al-Batah, A. N. Ali, K. Z. Zamli, and K. A. Azizli, “Microcontroller based HMLP realization for aggregate classification system,” International Journal of Factory Automation, Robotics and Soft Computing, vol. 2, pp. 19–26, 2006. [43] O. M. Alia, M. A. Al-Betar, M. Rajeswari, and A. T. Khader, “Data clustering using harmony search algorithm,” in Swarm, Evolutionary, and Memetic Computing, vol. 7077 of Lecture Notes in Computer Science, pp. 79–88, 2011. [44] N. S¨ut and Y. C ¸ elik, “Prediction of mortality in stroke patients using multilayer perceptron neural networks,” Turkish Journal of Medical Sciences, vol. 42, no. 5, pp. 886–893, 2012. [45] M. S. Al-Batah, A. Zabian, and M. Abdel-Wahed, “Suitable features selection for the HMLP network using circle segments method,” European Journal of Scientific Research, vol. 67, no. 1, pp. 52–65, 2011. [46] Y. A. Z. A. Alkareem, I. Venkat, M. A. Al-Betar, and A. T. Khader, “Edge preserving image enhancement via harmony search algorithm,” in Proceedings of the 4th Conference on Data Mining and Optimization (DMO ’12), pp. 47–52, Langkawi, Malaysia, 2012. [47] A. K. Baareh, A. F. Sheta, and M. S. Al-Batah, “Feature based 3D object recognition using artificial neural networks,” International Journal of Computer Applications, vol. 44, no. 5, pp. 1– 7, 2012. [48] Y. O˘guz and ˙I. G¨uney, “Adaptive neuro-fuzzy inference system to improve the power quality of variable-speed wind power generation system,” Turkish Journal of Electrical Engineering & Computer Sciences, vol. 18, pp. 625–646, 2010. [49] R. Singh, A. Kainthola, and T. N. Singh, “Estimation of elastic constant of rocks using an ANFIS approach,” Applied Soft Computing Journal, vol. 12, no. 1, pp. 40–45, 2012. [50] T. E. Dalkilic¸, B. Y. Hanci, and A. Apaydin, “Fuzzy adaptive neural network approach to path loss prediction in urban areas at GSM-900 band,” Turkish Journal of Electrical Engineering and Computer Sciences, vol. 18, no. 6, pp. 1077–1094, 2010. [51] J.-S. R. Jang, “ANFIS: adaptive-network-based fuzzy inference system,” IEEE Transactions on Systems, Man and Cybernetics, vol. 23, no. 3, pp. 665–685, 1993. [52] A. Hoang, Supervised classifier performance on the UCI database [M.S. thesis], Department of Computer Science, University of Adelaide, South Australia, Australia, 1997.
Computational and Mathematical Methods in Medicine [53] P. Eklund and A. Hoang, “A comparative study of public supervised classifier performance on the UCI database,” Australian Journal of Intelligent Information Processing Systems, vol. 9, no. 1, pp. 1–39, 2006.