current course to 250º with 20m/s). â¢. Level 2. Instruct .... CORBA [OMG, 1998; Siegel, 1996] is an architecture ..... [Roehl, 1995] Bernie Roehl, âSome Thoughtson.
Multiple Display Viewing Architecture for Virtual Environments over Heterogeneous Networks ALEXANDRE G. FERREIRA RENATO F. G. CERQUEIRA WALDEMAR CELES MARCELO GATTASS TeCGraf – Grupo de Tecnologia em Computação Gráfica, Departamento de Informática Pontifícia Universidade Católica do Rio de Janeiro – PUC-Rio Rua Marquês de São Vicente 255 – 22453-900 – Rio de Janeiro, RJ, Brazil {alexgf,rcerq,celes,gattass}@tecgraf.puc-rio.br Abstract. Visualization systems that support multiple-display viewing can greatly enhance user perception. The common approach to provide multiple synchronized views uses a powerful centralized processing unit to support the rendering process on all screens. As an alternative approach, we propose a distributed architecture that supports a flexible and reliable visualization system that, while giving the users a sensation of immersion, uses heterogeneous network of low-end graphics workstations. The proposed system ensures portability and synchronization of all displayed views. Keywords: Virtual Reality, 3D Visualization, Distributed Systems, Immersion.
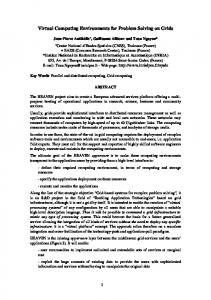
1 Introduction Nowadays, a large number of applications require a visualization system capable of providing multiple views of an animated virtual environment. Multiple display devices are arranged around the user composing a panoramic view of the scene, as illustrated by Figure 1. The rendering is accomplished by simultaneously projecting the scene onto multiple displays. We can think that each display represents a window in the virtual environment, and the user sees the virtual world through such windows, proving her immersion sensation. Several researches have been conducted on this subject and different applications could benefit from using this technology, e.g. education, architecture design, scientific visualization, medicine, military simulation, arts, and entertainment.
Figure 1 Multiple viewing environment.
Our motivation to develop a multiple display visualization system came from a naval simulation game developed by the Brazilian Navy. The game was designed for training a group of ship commanders, and our goal was to develop a visualization system capable of providing synchronized views from the commander’s bridge using multiple displays. One straightforward solution to accomplish such a task would be the use of sophisticated, and expensive, hardware that supports multiple displays. However, we propose a distributed architecture that provides a flexible and reliable visualization system that, while giving the users a sensation of immersion, uses heterogeneous network of low-end graphics workstations. The proposed architecture is capable of supporting the development of applications that demand high frame-rates, synchronization and a consistent simulation feedback to users. The main requirement of such applications consists in having all events in the simulated world occurring at the same perception time in all visualization surfaces. We do not address here either the game’s physical simulation phase, or the input interactions from the players; we are concerned only with the sensorial visual feedback given to the users. The game simulator running somewhere in the network provides all input data needed for visualization. This paper is organized as follows. The next two sections present some concepts related to virtual environ-
ment visualization. Section 4 discusses issues related to a distributed visualization approach. Section 5 presents a detailed analysis of the proposed system architecture. Finally, in Section 6, some concluding remarks are drawn. 2 Virtual Environment Description We consider virtual environment as the theater where the simulated world runs. Every element that exists in this simulated world is considered an entity of this virtual environment. Since the goal is to provide the user with a visual feedback of the existing entities inside the virtual environment, each entity may have an associated shape description and appearance. These attributes feed the rendering engine partially and are responsible for providing realistic images. Realistic and high-quality images are necessary to reinforce immersion sensation in the virtual world. In general, the use of detailed 3D models with appropriate color materials and texture images gives good results. In this way, the entity shape is any form of geometry description that can be processed to represent the entity image. It can be given by an implicit equation, or a polygon mesh, among others. The entity appearance, like the shape, can be set in several ways: it goes from simple flat colors, to material definition and highly detailed textures that are applied over the entity shape. A rough geometry description can be counterbalanced by a rich set of texture images, still aiming realistic results. Illumination is also an important concept in the virtual environment. The use of well-modeled illumination is most important when the virtual world mimics the human visible world. For example, accurate lighting computation adds realism for simulating a group of individuals in a room, but not for simulating molecule reactions. Usually, for good visual results, the visualization system should provide several ways for modeling light sources (spot, ambient, positional, directional, and distributed), as well as for describing their attributes (color, intensity, etc). Entity behavior is another important concept in the virtual world. Sometimes, a poorly rendered animated sequence offers more realism than high-quality static images. That is where the entity behavior plays its role: to mimic the real world dynamics. Since a virtual entity has a collection of attributes, its behavior could be defined as the ever-changing state of all these attributes. Beyond shape and appearance, spatial attributes (location, velocity, acceleration, etc.) complete the entity description in the virtual worlds. The entity behavior
governs the changing of these attributes in time, thus creating animation. Entity behavior can be classified into two categories: deterministic and non-deterministic. Deterministic entities have their state determined by a function of time. So it is possible to run forward and backward in time, knowing precisely the state of an entity at any instant. On the other hand, non-deterministic entities are unpredictable, generally reflecting human actions. In this case, it is impossible to predict its state in the future and not practical to restore its state at any instant in the past [Roehl, 1995]. Roehl classifies behavior in different levels, according to the way it governs how entity attributes change over time. • Level 0. Set the attribute value at each frame (e.g., set current location to {x,y,z}). •
Level 1. Set the way the attributes change attributes over time (e.g., set current location to {x,y,z} and current course to 250º with 20m/s).
•
Level 2. Instruct the entity to accomplish tasks, generally performed by a series of level 1 behaviors (e.g., go to the nearest harbor).
•
Level 3. Instruct the entity to take a top-level decision, generally performed by choosing a level 2 behavior (e.g., decide whether to attack the enemy or to retract to the nearest harbor).
General-purpose visualization systems usually support level 0 and level 1, since level 2 and level 3 demand greater knowledge of the world under simulation. 3
Virtual Environment Visualization
As previously mentioned, our goal is to provide a visual feedback of the simulated world. The user of a visualization system generally stands in front of some viewing devices, like monitors, screen projections, or wears it, like when using head-mounted displays. Regardless of which viewing device is being used, a virtual observer is always associated with the user. An observer represents the mapping of the user into the virtual environment. In certain simulated worlds, the observer needs to be attached to an entity, in order to inherit its characteristics as shape or behavior. In such a case, the observer acts as an entity that could be seen by other observers in the virtual environment. Bound to this virtual observer we have a virtual viewing surface that we call canvas. Each canvas corresponds to a viewing device and is placed around the observer acting as actual windows to the virtual environ-
ment. With a multiple display viewing system, the disposal of display devices in relation to the user (real observer) maps the disposal of canvases in relation to the observer. In this way, the user sees, on each display that surrounds her, the view of the virtual world that the observer would see through each canvas, providing an immersion sensation. Mapping each viewing device that surrounds the user into the observer’s surrounding canvases is a very important task. Good visual results rely on the perfect matching between the real and the virtual visualization surfaces. To provide the user immersion, a system should induce him to focus on a specific problem or experience without distractions. Immersion happens when the user’s perception is removed from the real world and replaced by a virtual one. Immersive environments are often associated with head-mounted displays (HMD), engaging graphics, realistic sound, motion and force feedback, used in order to block out the real world allowing the user to focus their senses on the virtual one. However, immersive environments can also be created without head-mounted displays, since video projection and visual displays alone may engage the user. Elements like appropriate resolution and suitable update rates for a particular task or experience can become interesting to watch and invite the user’s participation. This way, to create an immersive environment would require its design to be enough technically realistic to convey recognition in the user. It must also be relevant to the task domain, and must be interesting enough to engage the user's attention and participation. Designers of immersive environments must be able to effectively integrate technology and task requirements with human factors, minimizing distractions and maximizing features that enhance the user's focus [Barreau and McGoff, 1993]. 4
Distributed Visualization
In this paper, we propose an architecture for the development of a visualization system capable of fulfilling most of the requirements addressed in the previous sections. Our choice was to design a distributed multiple display visualization system that could run on heterogeneous networks composed by low-end workstations. Among the reasons that led us to favor a distributed approach are scalability, portability, and system costs. The key idea behind any distributed architecture is the absence of a central server. The process is distributed over several computers that are connected by a network (possibly even the Internet). A distributed solution introduces two new issues to the visualization problem
that must be addressed: synchronization, because distributed systems have to tolerate certain amount of communication latency; and portability, because it should accept the use of different computers with different hardware and software. A naive approach for designing distributed visualization systems would be to simply have each entity attributes broadcasted to all workstations at each frame to be rendered. This solution could work well in small, dedicated networks, but certainly it does not scale. Distributed systems for military simulations frequently use a protocol named DIS – Distributed Interactive Simulation [IEEE, 1993]. DIS uses a technique called dead reckoning to deal with limited bandwidth and network latency. Using this technique, instead of broadcasting Level 0 behavior at each frame fully describing the entity attributes, Level 1 instructions are sent over the network. The visualizers then project new states in time, without the need for additional information. With this approach, the visualizer must have partial knowledge about the simulation that is running, being able to foresee new entity attributes, during the period of time that the behavior stays unchanged. This simple technique produces good results because updates are generated only when necessary, minimizing network traffic [Macedonia et al., 1994]. Dead reckoning is not capable of dealing with nondeterministic behaviors, because they are difficult to be handled in all computers composing the system. Unpredictable behaviors would imply in frequent updating, causing excessive network traffic. In that case, a centralized one-processor approach would be a better choice. However, if human decisions, reflecting nondeterministic behaviors, have a slow impact in the simulation, like changing the course of a ship, the behavior of the entity being simulated could be treated as deterministic during certain time intervals. Since the dead reckoning fulfills our requirements for distributed visualization, we adopt this technique in our system to reduce network traffic and to solve problems related to synchronization. On a centralized visualization system, where all processing occurs once, without data replication and without processing being held on different computers, there is no concern about synchronizing the events shown on the multiple visualization surfaces, since all devices are directly connected to the central processor. The distribution timing through a local bus is negligible when compared with a distribution over a network. Two synchronization problems arise with the use of a distributed visualization approach. The first problem is
having different computers composing the system: the computer clocks are probably not synchronized within the precision we need for visualization. Our system spends some effort during initialization phase to achieve such synchronization, as will be detailed in the following section. The second synchronization problem is related to the network latency. Considering the use of the dead reckoning technique, imagine that one module signalizes an entity behavior change (e.g., changing a ship course). Certainly, each visualizer will receive such a message at a different instant of time, and, if no further information were sent, the entity would assume its new course at the time the message arrives, resulting in a different simulation on each process. To solve this problem, all messages are sent with an enclosed timestamp. Thus, no matter what time it arrives, the visualizer would be able to step back in time and reset the new state at the correct simulation instant. Of course, this method will only guarantee synchronization if the first synchronization problem is solved, and if no message is lost. In a visualization system using this step-back technique, the entities could change their attributes abruptly, reflecting the fact that such a changing message was lately received. However, considering a network with low latency, such changes are imperceptible to human visual sense. This perceptual issue in fact limits the scalability of our approach. It is worth mentioning that if the system presents flaws, like desynchronized events happening at different
screens, the user would be distracted, and immersion sensation would be lost. Therefore, synchronization should be carefully considered in distributed visualization systems. 5
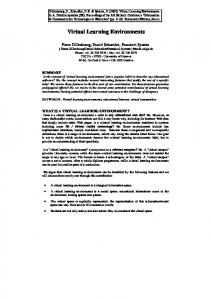
This section details the distributed scheme we used to develop a multiple display visualization system. The proposed approach was originally to implement a naval simulation game; however, its modular configuration facilitates customization, allowing its use in other applications. Figure 2 shows an overview of the whole system architecture The external world represents the module where the world simulation takes place. It is also responsible for handling external input. The client application translates messages from the external world and distributes them to all registered server applications. It plays the role of a coordinator, thus being called coordinator application. The server applications represent visualization units and are responsible for rendering the updated scene. Both world-client and client-server communications happen over a distribution infrastructure, based on CORBA [OMG, 1998]. The last module represents the world model, describing the virtual environment. It is worth noting that the system kernel, as illustrated in Figure 2, is composed by the visualization units and the client-server distribution infrastructure. The coordinator and the world model vary with external
Client Aplications : Coordinator Applications
External World
System architecture
Server Aplications : Visualization Units
World Model
Exclusive:
VU
Oneway data from external application
Mediates interactions from external application to the System Kernel
World Model
VU
Canvas
Shared:
Display #2
...
Observer
Commom: Scene
Shapes
VU Display #n
Distribution Infrastructure
System Kernel
List of Entitys
Responsable for I/O and complete world simulation.
Coordinator
CORBA Layer
External Application
CORBA Layer
Display #1
Behavior
Appearance
List of Lights
World Model pre-configuration
Figure 2 Overview of system architecture.
application, and their implementations should appropriately reflect the world being modeled. The migration of such architecture to support another application would require changes in both coordinator and model, but would reuse the system kernel. In the subsections that follow, each module is detailed described.
also have to provide some mechanism to synchronize the simulation time over all Visualization Units. In order to satisfy this requirement, we adopt a solution based on the Simple Network Time Protocol (SNTP) [Mills, 1996], which is an adaptation of the Network Time Protocol (NTP) [Mills, 1992] used to synchronize computer clocks in the Internet. Process A - Host 1
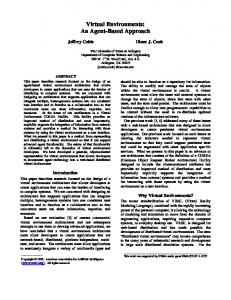
5.1 Distribution Infrastructure The proposed distributed visualization system requires an infrastructure that supports heterogeneous platforms. From this point of view, the socket API [Stevens, 1990] could provide a high level of portability and interoperability in a TCP/IP environment. However, the socket API is based on a programming paradigm with a low level of abstraction. Since our system adopts an object-oriented approach, a distribution infrastructure with a better support to object-oriented programming would be a more suitable choice. CORBA [OMG, 1998; Siegel, 1996] is an architecture specification to support distributed applications that meets both requirements. CORBA provides platform-independent programming interfaces and models for portable, distributed, object-oriented applications. Its independence from programming languages, computing platforms, and networking protocols makes it highly suitable for the development of applications for heterogeneous networks. CORBA is strongly based on the concept of object interfaces. An object interface is the set of operations that an object provides. To describe object interfaces, CORBA adopts an Interface Definition Language (IDL). Unlike C++ and Java, IDL is not a programming language, so objects and applications cannot be implemented in IDL. The unique purpose of the IDL is to define object interfaces in a manner that is independent of any particular programming language. This mechanism allows applications in different programming languages to inter-operate. From IDL definitions, an IDL compiler generates stubs that client applications can use to access the remote objects. The generated stub can be in a programming language different of the one used to implement the server object. A client stub behaves like a proxy of the remote object: It delegates to the remote object any operation performed over itself. Figure 3 exemplifies the interaction between a client application and a CORBA object server. Since we are interested in distributed synchronous views of the virtual environment, where entities have deterministic behaviors, our distribution infrastructure
Process B - Host 2
Client Module
Proxy
Object Server
CORBA
CORBA CORBA Protocol (IIOP)
Figura 3 Client-sever interaction with CORBA. NTP is a sophisticated protocol for synchronizing clocks across a WAN or a LAN, and can often achieve millisecond accuracy. SNTP can be used when the ultimate performance of the full NTP implementation is not needed or justified. SNTP satisfies our synchronization requirements (110 ms of accuracy) since all hosts that support our virtual environment are in the same local network. With this solution, the time synchronization can be performed outside the application. 5.2 External World: The Naval Simulation System The visualization system works integrated with another distributed simulation system that was developed by the Brazilian Navy for training warship commanders. This system performs all physics simulation tasks and processes the user interactions. More specifically, the naval system is composed by several CORBA objects that represent the vehicles (ships, aircraft, and submarines), their sensors (sonar, radar, etc.), and the user consoles. Besides these components that represent real entities, there are some control components, such as the collision detection module. The users interact with the system through graphical consoles where they have navigation instruments and the sensor displays. The navigation instruments allow changes in the vehicle’s course and velocity. A sensor display shows the signal generated by a sensor, such as a radar or sonar. The vehicle objects have all information about their relevant mechanical characteristics: position, velocity,
course, turning ratio, etc. With these characteristics, the vehicle acts as a deterministic entity, whose position is a function of the time. This system adopts the same dead reckoning approach of our visualization system. For instance, a sensor object extrapolates the vehicles’ positions in function of the time. When a specific vehicle has its kinetic state changed, all sensors must be updated. To perform this update, the observer design pattern [Gamma et al., 1995] is used: A vehicle has a collection with objects interested in listening the changes in its state and, when any change occurs, all objects in the collection (listeners) are notified. Figure 4 illustrates the pattern behavior. In fact, this pattern is used in many other situations that require a notification mechanism.
To integrate our visualization system with other simulators, we only need change the mediator component. The following paragraphs describe how the mediator component works. Radar Process Listener of Vehicle A
notify
Listener of Vehicle B
Radar Object
Process List of Listeners notify
...
proxy 1 proxy 2
change state
proxy 3
Vehicle A
proxy 4
notify
proxy5
Sonar Process notify
Listener of Vehicle A
5.3 Client Application: Coordinator There is a specific application to coordinate the Visualization Units (VU). This application, called Coordinator, has two main components: the synchronizer and the mediator components. The synchronizer component is responsible for setting the simulation time over all VUs. Each VU has a simulated clock that determines the local simulation time. When a VU starts, it registers with the coordinator. Then, the synchronizer sets the VU’s simulated clock in accordance with the clock of a reference host (probably, the same host where the synchronizer is running). The synchronization task is based on the SNTP protocol [Mills, 1996]. Although the coordinator only performs the synchronization when a VU registers with it, this process could be repeated for long simulations, in order to avoid synchronization deviations. Once the simulation starts, the coordinator performs the integration between our system visualization and the naval simulator. The mediator component is responsible for this task. It notifies all VUs that the kinetic state of a vehicle has changed. Each VU has an entity that represents a virtual vehicle in the naval simulation. These entities must be notified when the state of the related vehicles changes. The same notification mechanism used in the naval simulator could be sufficient to solve this problem: The entities could be registered with their related vehicles as listeners of their state changes. However, we have decided to use a mediator component in order to promote loose coupling between our VUs and the simulation system. Therefore, the mediator translates all notification messages sent from the virtual vehicles to the entities. The motivation to adopt this solution was to improve the system reusability:
Listener of Vehicle B
Sonar Object
...
Figure 4 The basic observer pattern. For each virtual vehicle in the simulated world, the mediator creates an object adapter, which is registered with its related vehicle to listen to state changes. Then, the VUs’ entities that are related to the same virtual vehicle are registered with the respective adapter. The object adapter translates the relevant notification messages received from the virtual vehicle, to a message compatible with the entity interface. The object adapters act as vehicles’ listeners, while the entities act as object adapters’ listeners. Figure 5 illustrates this interaction pattern. Besides the observer pattern, the mediator component is based on the adapter and mediator design patterns presented in [Gamma et al., 1995]. 5.4 Server Application: Visualization Units The visualization units (VUs) are server applications that are running on several computers over the network. Each VU has to separately render, from a certain point of view, the image of the simulated world and display it on the corresponding viewing device. The system architecture was conceived with no communication among different VUs. That means they run independently and, most importantly, they cannot send synchronization signals among them. As mentioned, the coordinator is the module responsible for establishing VUs clock synchronization at system initialization. Afterwards, the system synchronization relies only on the
assumption that the computer clocks will be precise enough. This assumption is reasonable for a certain period of time if the computers are working in normal conditions. For simulation that runs for long periods of time, the coordinator should once a while reestablish clock synchronization. The important point here is that each VU can trust its own clock to compute entity attributes varying in time. During initialization phase, each VU creates a CORBA interface that is registered in the interface repository. Then a CORBA clock object is created to allow the coordinator to access and set the local simulation time. The next step is to load the world model. (Details on how it is carried out will be presented in the following subsection.) By the time each world element (canvas, observer, entity, behavior, etc) is loaded into the VU, an equivalent CORBA object is created and registered, providing an interface for remote access to all exported element attributes and methods. The set of appearances and the drawing of shapes together demand most of CPU processing time in a VU. The faster these tasks are fulfilled, greater is the frame rate obtained. Therefore, during initialization phase, the entity shapes and appearance are processed to allow faster rendering. Texture images are arranged by a technique known as mipmapping [Williams, 1983], and the geometric shapes are processed to create a (simplified) view dependent progressive mesh [Hugues, 1996; Melax, 1998a]. These constructions have largely improved the VU overall performance, because they allow the image to Vehicle Process
be rendered with different levels of details (LOD). Only after finishing all these initialization tasks are the VUs ready to listen to external commands and to render updated views of the virtual world. That is when the external application might start sending simulation messages. Internally, each VU performs a simple algorithm. It keeps listening to external commands while maintaining an updated view of the virtual world. Each VU stores a copy of the world model, and traverses such data to render the appropriated image. Whenever an external commands arrives, probably signalizing a change in entity behavior, the VU internally performs all necessary changes in its current state, so that the next rendering will display the updated world. To ensure portability the VU uses the OpenGL graphics system [Neider et al., 1993; Thompson, 1996]. To ensure synchronization, each external command brings a timestamp corresponding to the simulation time the event has happened. The VU uses this timestamp to properly update the entity attributes. If, due to network latency, the VU receives the command lately, it uses the timestamp to back up so that the changes take place at the correct instant. The VUs are designed to run in simulation real-time, that is, the frame being displayed will always reflect the VU state at the rendering time. If, for some reason, the VU cannot accomplish the rendering in time, we decrease its frame rate. This strategy allows the use of heterogeneous hardware composing the system, while
Mediator Component
notify notify
List of Listeners
List of Listeners
proxy 1
proxy 1
proxy 2
proxy 2
Listener Adapter
Visualizer Units
notify Display #1
proxy 3
proxy 3
Vehicle
notify
proxy 4 proxy5
Display #2 List of Listeners proxy 1
Listener Adapter
proxy 2 proxy 3
notify
Display #3
Figure 5 The communication through the Mediator.
preserving synchronization. The following pseudo-code outlines the VU working algorithm: initialize CORBA interface load world model start listening to external calls loop if (external call) process external calls end if update entity state render scene end loop
5.5 World Model No matter what kind of world is being simulated, we need a structured model that describes it. This model should also provide efficient way to modify and retrieve its component information. Besides that, if we aim to design a reusable piece of code, such a model should be appropriately design to handle the visualization of different virtual environments. Therefore, we based our model structure on Virtual Reality systems, once they face, in a larger scale, the same challenge. We opt to describe the world using easily editable text files through the use of Lua [Ierusalimschy et al., 1996], an interpreted language that combines data description facilities and conventional procedural features, using a clear and simple syntax. In addition, Lua supports all the conventional control structures, including expressions, loops, conditional statements, and function calls, and all of them can be combined in defining the world components. We limited the space domain where the virtual world is defined to be the 3D Cartesian coordinate system (x,y,z). The components that describe the virtual world are subdivided in three different groups, according to their use by the Visualization Units: exclusive, shared and common. In the exclusive group, there is a component description for each VU. For instance, each VU has its own associated canvas. On the other hand, all the VUs render the same scene, though from different points of view. Thus scene components (entities, lights, etc.) are unique and must be common to all VUs. Finally, there is the intermediate group formed by components that may be shared among different VUs. The observer is an example of such a component: in a multi-users
visualization system, we may have several observers, each one being mapped to its corresponding set of VUs. A brief description of the main components is presented below, with a few examples illustrating the component description in Lua. In general, position and direction are given by a {x,y,z} vector, and rotation is given by a {θ,x,y,z} quadruple, where θ indicates the rotation angle around the {x,y,z} vector. To perform internal computation, each VU converts such quadruples to corresponding quaternions. Canvas: the canvas component contains information about the physical display device it is mapped to. Such information consist in providing the device physical dimensions and placement related to the user. The Lua code below illustrates its description. Canvas{ name = "LeftCanvas", width = 0.30, height = 0.25, xresoluion = 800, yresolution = 600 } normal = Vector{0,0,1} direction = Vector{0,0,-0.07} }
Observer: each observer is attached to an entity in order to inherit its positional attributes. Moreover, we can displace the observer within its entity coordinate system. Observer{ name = "Commander", entity = Ship, position = Vector{0.0, 0.1, 1.0}, rotation = Quadruple{ 0,0,1,0} }
Entity: the entity represents any visible objects in the virtual environment. When describing an entity, we specify its appearance, shape and behavior. The behavior establishes the entity mechanics. Currently, we are dealing with static, kinematic, and oscillatory behavior. In order to allow the composition of hierarchical models, an entity shape can be defined by a group of others entities. Hierarchy is important for building complex objects and allows us to model sophisticated behavior, like a person walking on a ship deck or the propeller of a flying helicopter. Visualizer: the visualizer component represents the display surface composing the system. It is described by mapping a observer–canvas association. Each VU must have its corresponding visualizer. 6 Results and Conclusion Instead of using a sophisticated hardware to provide multiple synchronized views of a virtual world, we proposed the use of a distributed visualization system.
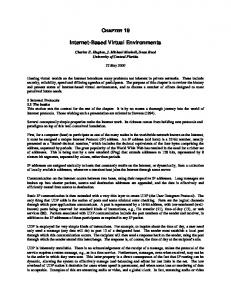
The proposal brings some immediate benefits like its scalability and the possibility of using heterogeneous networks composed by low-end, cheaper workstations. The proposed architecture can be used in a variety of applications since its system kernel was designed to deal with different world models and simulations. The system is also scalable to support multiple users, where each user sees the virtual world through a set of viewing devices. The distributed approach also brought new problems to be addressed. We need portability to deal with heterogeneous networks, and we have to ensure synchronization among all the views. Portability was achieved by basing the distribution infrastructure on CORBA and using OpenGL as the graphical system. Synchronization, in a local area network, is ensured by using the Simple Network Time Protocol (SNTP) for clock synchronization. Moreover, the coordinator encloses a timestamp in each message sent to the visualization units, allowing them to periodically adjust their own simulation time. A prototype of the proposed system was implemented using ship and aircraft models (composed by 5-6 thousand triangles each) obtained at [Melax 1998b]. The photograph shown in Figure 6 illustrates this system in use with a network composed by three PCs running Windows. Finally, results based on this prototype have shown that all requirements needed for providing multiple views
of a virtual environment are achieved. Acknowledgments The first author is supported by the Brazilian Army. The second author is supported by a research grant from the Brazilian Council for Scientific and Technological Development (CNPq). TeCGraf is a laboratory mainly funded by PETROBRAS. We thank Paulo Mattos for the implementation of the LOD algorithm. References [Barreau and McGoff, 1993] Deborah Barreau, and Kim McGoff, “Immersion”, http://www.hitl.washington.edu/ scivw/EVE/III.C.1.Immersion.html, Department of Computer Science, Human Interface Technology Laboratory, University of Maryland, 1993. [Gamma et al., 1995] Erich Gamma, Richard Helm, Ralph Johnson, and John Vlissides, Design Patterns: Elements of Reusable Object-Oriented Software, Addison Wesley, 1995. [Hugues, 1996] Hoppe Hugues, “Progressive meshes”, Computer Graphics (SIGGRAPH 96 Proceedings), pp. 99-108, 1996. [IEEE, 1993] Institute of Electrical and Electronics Engineers, International Standard, ANSI/IEEE Std 1278, Standard for Information Technology, Protocols
Figure 6 Visualization system snapshot.
for Distributed Interactive Simulation, March 1993. [Ierusalimschy et al., 1996] R. Ierusalimschy, L. H. de Figueiredo, and W. Celes, "Lua: an extensible extension language", Software: Practice & Experience, 26 (6), pp. 635-652, 1996. [Macedonia et al., 1994] Michael Macedonia, Michael Zyda, David Pratt, Paul Barham, and Seven Zeswitz, “NPSNET: A Network Software Architecture for Large Scale Virtual Environments”, Presence, 3 (4), Fall 1994. [Melax, 1998a] S. Melax, "A Simple, Fast, and Effective Polygon Reduction Algorithm", Game Developer Magazine, November 1998. [Melax, 1998b] S. Melax, “Simple Polygon Reduction”, http://www.cs.ualberta.ca/~melax/polychop/, 1998. [Mills, 1992] D. Mills, Network Time Protocol (Version 3): Specification, Implementation, and Analysis, RFC 1305, March 1992. [Mills, 1996] D. Mills, Simple Network Time Protocol (SNTP) Version 4 for IPv4, IPv6 and OSI, RFC 2030, October 1996. [Neider et al., 1993] Jackie Neider, Tom Davis, and Mason Woo, OpenGL Programming Guide, AddisonWesley, 1993. [OMG, 1998] The Common Object Request Broker Architecture and Specification; Revision 2.2, OMG, Framingham, MA, February 1998. [Roehl, 1995] Bernie Roehl, “Some Thoughtson Behaviour in VR Systems”, http://ece.uwaterloo.ca/~broehl /behav.html, University of Waterloo, 1995. [Siegel, 1996] Jon Siegel, CORBA Fundamentals and Programming, John Wiley & Sons", 1996.