AC4. 0.070. 0.172. 0.093. 0.536. AC3. 0.067. 0.137. 0.087. 0.523. Table 3. MIREX note tracking results based on onset and pitch. Precision, recall, average ...
MULTIPLE FUNDAMENTAL FREQUENCY ESTIMATION USING GAUSSIAN SMOOTHNESS Antonio Pertusa, Jos´e M. I˜nesta University of Alicante Departamento de Lenguajes y Sistemas Inform´aticos P.O. Box 99 E-03080 Alicante Spain ABSTRACT The goal of a polyphonic music transcription system is to extract a score from an audio signal. A multiple fundamental frequency estimator is the main piece of these systems, whereas tempo detection and key estimation complement them to correctly extract the score. In this work, in order to detect the fundamental frequencies that are present in a signal, a set of candidates are selected from the spectrum, and all their possible combinations are generated. The best combination is chosen in a frame by frame analysis by applying a set of rules, taking into account the harmonic amplitudes and the spectral smoothness measure described in this work. The system was evaluated and compared to other works, yielding competitive results and performance. Index Terms— Acoustic signal processing, acoustic signal analysis, spectral analysis, Gaussian distributions, acoustic applications 1. INTRODUCTION Detecting multiple pitches that are present in a acoustic signal is a very complex task, and currently is far from being completely solved, despite the state of the art contains several approaches that have addressed this problem. Some authors, like Tolonen [1] or Klapuri [2], proposed models of the human auditory system. Parametric signal models have been used by Goto [3], and Yeh [4] used a generative spectral model. Other approaches like [5] include machine learning techniques. A number of models or patterns have been previously used for spectral matching, and they are usually independent from the analyzed timbres. In [6], spectral whitening is performed trying to suppress timbral information before subtracting a constant pattern previously learned. In the proposed approach, a pattern for each fundamental frequency is inferred from the spectrum, by taking into account the amplitudes of the harmonic partials and their This work is supported by the Spanish PROSEMUS project with code TIN2006-14932-C02 and the Spanish research programme Consolider Ingenio 2010: MIPRCV (CSD2007-00018).
smoothness. The principle of this work is based on the expectation that the spectral envelopes of real sounds tend to vary smoothly as a function of frequency [7], and we can use this property to separate sources, maximizing the probabilities of spectral envelopes with high smoothness and high harmonic amplitude values. The spectral smoothness principle has been previously used by Yeh [4], combined with other principles as a criterion to select spectral harmonics. In a former work, Klapuri [7] smoothed the spectra of the detected sounds before subtracting them from the mixture. To do this, a moving average was computed over the amplitudes of the harmonic partials of a sound, and an octave wide triangular window centered at each harmonic partial was calculated to obtain the weighted mean of the amplitudes. Then, the amplitude values were replaced by the minimum of the original and weighted mean values. Basically, the scheme of the proposed approach consists of identifying a set of candidates (pitches), generate all their possible combinations (chords) and finding the best combination. This is the combination of candidates that maximizes the sum of their harmonic amplitudes and their smoothness. Therefore, the harmonics of each candidate are identified and the smoothness of their amplitudes contributes to score it. To do this, the spectrum is neither smoothed nor preprocessed. 2. METHODOLOGY The multiple pitch estimator converts a mono audio file into a sequence of MIDI notes. To detect the pitches in a signal, the Short Time Fourier Transform (STFT) is computed using a 93 ms Hanning windowed frame (4096 samples for a signal sampled at 44.1 kHz rate), with a 46 ms hop. This window size may seem long, but for chord identification pitch margin is wide [7]. This is the frame size selected in many previous approaches, like [6]. Zero padding has been used, multiplying the original size of the window by 4 and adding zeroes to complete it before the STFT is computed. This technique does not increase resolution, but the estimated amplitudes and frequencies of the new spectral bins are usually more accurate than applying interpolation, being useful for a better fre-
quency location of the lower pitches. The proposed algorithm performs a frame by frame analysis. For each frame, the spectral peaks with an amplitude higher than a given threshold µ are extracted, while the rest of spectral information is discarded. Then, a set of fundamental frequency (f 0 ) candidates are selected from the spectral peaks. A spectral peak is considered as a f 0 candidate if it is within the range [f min , fmax ], which corresponds to the pitches of interest. Another restriction for a spectral peak to be a candidate is that at least η of its harmonics must be found. As the f 0 candidates are spectral peaks, the timbres with missing fundamental are not considered. To search for the harmonics of a candidate, a constant margin hf0 ± fr around each harmonic frequency hf 0 for h = 2, 3, ... is considered, to allow harmonic deviations. The closest peak to the center of this margin is set as a harmonic partial and, if no peak is found within this margin, the harmonic is considered as missing. Candidates are ordered decreasingly by the sum of their harmonic amplitudes and, at most, only the first F candidates of this list are considered, to improve the performance of the system. Then, all the possible candidate combinations are calculated, and the combination with best salience (see below) is selected. As the combinations consist on different number of pitches, no estimation of the number of concurrent sounds is performed before estimating the pitches, like in other works [7]. The combination with best salience will be selected instead. The salience of a combination is calculated as the sum of the saliences of its candidates. A candidate salience is computed by considering the loudness and smoothness of its harmonic amplitudes. The first stage to compute these values is to estimate a spectral pattern p for each candidate c. This spectral pattern (see eq. 1) is a vector of amplitudes: pc = {pc,1, pc,2 , ..., pc,h , ..., pc,H }
pattern are linearly interpolated using the values of the nonshared harmonic amplitudes, in a similar way than in [4]. If an interpolated value is greater than the amplitude of the shared harmonic, then the harmonic amplitude in the spectral pattern of the candidate will remain the same and the spectral peak will be removed (amplitude set to zero) for the candidates that share this harmonic. If the interpolated value is smaller than the shared harmonic amplitude, this interpolated value is assigned to the harmonic of the spectral pattern and it is subtracted from the corresponding spectral peak. When this process is done for all the candidates in a combination, each candidate loudness l(c) is computed by summing all the values of its spectral pattern. l(c) =
pc,h
(2)
h=1
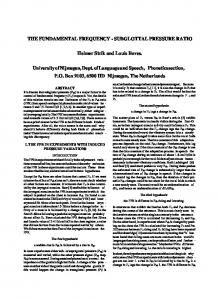
Smoothness (σ) is also computed for each spectral pattern by using Gaussian smoothing; the principle is that a smooth spectral pattern should be more probable than a sharper one. To compute the smoothness of a spectral pattern, p, the vector is low-pass filtered using a truncated normalized Gaussian window with three components N σ=1.0 = {0.21, 0.58, 0.21}, ˜: that is convolved with p obtaining the smooth version p ˜ = N1.0 ∗ p p
(3)
Only three components were chosen for the Gaussian window due to the small size of the spectral pattern (H = 10). Then, a sharpness measure s(c) is computed by summing the absolute differences between the smoothed values and the spectral pattern amplitudes: s(c) =
H !
(|˜ pc,h − pc,h |)
C !
[l(c) · σ(c)]
(4)
h=1
(1)
where pc,h is the amplitude of the h harmonic of a f 0 candidate. These harmonics are searched within the margin hf 0 ± fr , as described before. The maximum size of the spectral pattern was set to H = 10, because usually the first harmonics contain most of the energy of the sound and a higher value of H causes that low pitches can cancel higher frequencies. Then, an iterative algorithm is performed for each combination. Given a combination (a set of candidates), the harmonics of all its candidates are found and they are labeled with the candidate they belong to. After this process, there will be harmonics that only belong to one candidate, i.e. nonshared harmonics, and harmonics that belong to more than one candidate, i.e. shared harmonics. Once the spectral pattern for each candidate has been computed and the spectral peaks that correspond to harmonics have been labeled, the candidates, ordered by ascending frequency, are processed to get their salience. For each candidate, the shared harmonic amplitudes stored in its spectral
H !
The sharpness s(c) is normalized, s¯(c), and the smoothness of a spectral pattern is computed as σ(c) = 1 − s¯(c). Once the smoothness and the loudness of each candidate have been calculated, the salience S of a combination is: S=
c=1
2
(5)
being C the number of candidates in the combination. The combination with best salience is the winner chord in the analyzed frame. Combinations that have at least one candidate with l(c) < γL are discarded, being L = max ∀c {l(c)} the highest candidate loudness. After selecting the best combination in a frame, a last stage is applied to avoid local errors. If a given pitch was not detected in a target frame but it was found in the previous and next frames, it is considered to be detected in the current frame too, avoiding discontinuities in the detection. Finally,
1
p ~ p
0.8 0.6 0.4 0.2
1
2
3
4
5
6
7
8
9
1
10
h
10
h
p ~ p
0.8 0.6 0.4
id RK CY ZR PI1 EV2 CC1 SR EV1 PE1 PL CC2 KE2 KE1 AC2 AC1 VE
Acc. 0.605 0.589 0.582 0.580 0.543 0.510 0.484 0.466 0.444 0.394 0.359 0.336 0.327 0.311 0.277 0.145
Pr 0.690 0.765 0.710 0.827 0.687 0.567 0.614 0.659 0.734 0.689 0.359 0.348 0.335 0.373 0.298 0.530
Re 0.709 0.655 0.661 0.608 0.625 0.671 0.595 0.513 0.505 0.417 0.767 0.546 0.618 0.431 0.530 0.157
Etot 0.474 0.460 0.498 0.445 0.538 0.685 0.670 0.594 0.639 0.639 1.678 1.188 1.427 0.990 1.444 0.957
Esubs 0.158 0.108 0.141 0.094 0.135 0.200 0.185 0.171 0.120 0.151 0.232 0.401 0.339 0.348 0.332 0.070
Emiss 0.133 0.238 0.197 0.298 0.240 0.128 0.219 0.371 0.375 0.432 0.001 0.052 0.046 0.221 0.138 0.767
Ef a 0.183 0.115 0.160 0.053 0.163 0.356 0.265 0.107 0.144 0.055 1.445 0.734 1.042 0.421 0.974 0.120
0.2
1
2
3
4
5
6
7
8
9
Fig. 1. Gaussian smoothing example. The normalized harmonic vectors p and smooth versions p ˜ of two candidates (c 1 , c2 ) are shown. Sharpness is s(c 1 ) = 0.13, and s(c2 ) = 1.23. very short notes (less than 6 frames, i.e. 55.68 ms) are removed, and the sequences of consecutive detected fundamental frequencies are converted to MIDI notes. 3. EVALUATION First experiments were done using a data set to test the system and set up the parameters. These data were generated with random mixtures of different music samples, and they were used to evaluate previous works [6]. It consists of 4000 chords1 with polyphony 1,2,4, and 6 (1000 each). Only one frame of each mixture was analyzed to yield the fundamental frequencies. After these experiments, the best results were obtained using µ = 0.1, η = 2, f min =38 Hz, fmax = 2100 Hz, F = 10, f r =10 Hz, and γ = 0.1. A standard error metrics was used for evaluation; a false positive is a detected pitch that was not in the original mixture, a false negative is a pitch that was not detected but it was present in the signal, and the accuracy corresponds to the standard f-measure. Taken into account the 13000 pitches in the data set, there were 9052 correctly detected pitches, 3103 false positives and 3948 false negatives, yielding an accuracy acc = 56.21. This value cannot be directly compared to the results obtained by Klapuri [6] using the same data set, because in that work polyphony estimation and f 0 estimation were evaluated separately, and the number of concurrent sounds was given as a parameter for the pitch estimator. This is not the case for the present work, where these two stages are calculated simultaneously. To compare the system with other approaches, it was submitted and evaluated in the MIREX 2007 [8] multi-f 0 estima1 Thanks
to Anssi P. Klapuri for providing the data set of mixtures
Table 1. MIREX frame by frame evaluation results. Accuracy, precision, recall, and the error metrics proposed by Poliner (total, substitution, miss and false alarm errors) are shown. tion contest. The evaluation was done at two different levels; frame by frame pitch estimation and note tracking. In order to adapt the system to the MIREX frame by frame evaluation requirements, the hop size was changed to get a temporal resolution of 9.28 ms. The data set used in MIREX consisted of 20 real and 8 synthesized recordings. The results are shown in Tab. 1, and the corresponding runtimes in table 3. The current work is labeled as PI1, among the 16 multi-f 0 estimators presented. The accuracy of the system was close to the highest accuracy of the tested systems, being the one with the highest precision and the lowest E tot error [9]. This error metrics was proposed as an alternative to avoid double error counting: if a detected pitch is shifted, e.g., one semitone with respect to the actual pitch, then the standard accuracy would consider two errors (a false positive and a false negative). The difference between precision and recall shows that the system performs under-detection that may be corrected by changing the note removal thresholds to get a better recall. It can be seen in the performance table 2 that the system is fast compared to the other systems analyzed. The system was also evaluated for the note tracking contest. This task takes into account the onset and pitch of the notes. Despite it was not designed for this task because the analysis is performed without information from neighboring frames but converting consecutive frame detections into notes, the results were satisfactory, as shown in table 3. The analyzed system is labeled as PI2. Table 4 shows that it was the fastest system in this contest. 4. CONCLUSIONS AND FUTURE WORK A simple approach for multiple fundamental frequency estimation was presented in this work, yielding competitive results and performance. Using the amplitude spectrum, a set
id CC1 CC2 KE1 KE2 VE RK CY PL ZR SR PI1 EV1 EV2 PE1 AC1 AC2
Runtime (sec) 2513 2520 38640 19320 364560 3540 132300 14700 271 41160 364 2366 2233 4564 840 840
Machine ALE Nodes ALE Nodes ALE Nodes ALE Nodes ALE Nodes SANDBOX ALE Nodes ALE Nodes BLACK ALE Nodes ALE Nodes ALE Nodes ALE Nodes ALE Nodes MAC MAC
Participant AC3 AC4 RK EV3 EV4 KE3 KE4 PE2 PI2 PI3 VE
Table 2. MIREX frame by frame runtimes. The first column shows the participant, the second is the runtime and the third column is the machine where the evaluation was performed. The fastest machine was ALE Nodes.
Runtime (sec) 900 900 3285 2535 2475 4140 20700 4890 165 165 390600
Machine MAC MAC SANDBOX ALE Nodes ALE Nodes ALE Nodes ALE Nodes ALE Nodes ALE Nodes ALE Nodes ALE Nodes
Table 4. MIREX note tracking runtimes. Participant, running time (in seconds) and machine where the evaluation was performed are shown. 5. REFERENCES [1] T. Tolonen and M. Karjalainen, “A computationally efficient multipitch analysis model,” IEEE Trans. Speech and Audio Processing, vol. 8, no. 6, 2003.
id RK EV4 PE2 EV3 PI2 KE4 KE3 PI3 VE2 AC4 AC3
Precision 0.578 0.447 0.533 0.412 0.371 0.263 0.216 0.203 0.338 0.070 0.067
Recall 0.678 0.692 0.485 0.554 0.474 0.301 0.323 0.296 0.171 0.172 0.137
Avg. F-measure 0.614 0.527 0.485 0.453 0.408 0.268 0.246 0.219 0.202 0.093 0.087
Avg. Overlap 0.699 0.636 0.740 0.622 0.665 0.557 0.610 0.628 0.486 0.536 0.523
Table 3. MIREX note tracking results based on onset and pitch. Precision, recall, average f-measure and average overlap are shown.
of f0 candidates were chosen and all their possible combinations were generated. The combination of spectral patterns that maximizes a criterion based on the sum of harmonic amplitudes and spectral envelope smoothness was chosen. The system does not make any assumption about the number of sounds in the mixture, and no estimation of the number of concurrent sounds is required. The proposed scheme may also be extended to other problems (e.g., source separation) where a mixture of signals need to be decomposed and the spectral envelope of the different sources tends to be smooth. Future works include to balance precision and recall by adjusting parameters, and adding a spectrum preprocessing stage. Many estimation errors are produced by the inharmonicity of the sounds and the overlapped partials. To overcome this problem, a better approach for harmonic selection or partial tracking may be considered. A postprocessing stage to perform a pitch selection, based on musical probabilities, in order to remove false positives is also planned.
[2] A.P. Klapuri, “A perceptually motivated multiple-f0 estimation method for polyphonic music analysis,” in IEEE workshop on Applications of Signal Processing to Audio and Acoustics, New Paltz, NY, 2005. [3] M. Goto, “A real-time music scene description system: Predominant f0 estimation for detecting melody and bass lines in real-world audio signals,” Speech Communication, vol. 43, no. 4, pp. 311–329, 2004. [4] C. Yeh, A. R¨obel, and X. Rodet, “Multiple fundamental frequency estimation of polyphonic music signals,” in IEEE, Int. Conf. on Acoustics, Speech and Signal Processing (ICASSP), Philadelphia, USA, 2005. [5] A. Pertusa and J.M. I˜nesta, “Polyphonic monotimbral music transcription using dynamic networks,” Pattern Recognition Letters, vol. 26, no. 12, pp. 1809–1818, 2005. [6] A.P. Klapuri, “Multiple fundamental frequency estimation by summing harmonic amplitudes,” in Proc. ISMIR, Victoria, Canada, 2006, pp. 216–221. [7] A.P. Klapuri, “Multiple fundamental frequency estimation based on harmonicity and spectral smoothness,” IEEE Trans. on Speech and Audio Processing, vol. 11, no. 6, pp. 804–816, 2003. [8] “Mirex 2007: Music information retrieval evaluation exchange,” http://www.music-ir.org/mirex2007. [9] G.E. Poliner and D.P.W. Ellis, “A discriminative model for polyphonic piano transcription,” EURASIP Journal on Advances in Signal Processing, 2007.