of measurement is a shared issue, many software organizations encounter ... goals reflect the business strategy and GQM is used to identify and refine goals ...
Multiview Framework for goal oriented measurement plan design Pasquale Ardimento, Maria Teresa Baldassarre, Danilo Caivano, Giuseppe Visaggio Dipartimento di Informatica – Research Center of Software Technology (RCOST) – Università di Bari - Via Orabona, 4, 70126 Bari – Italy {ardimento, baldassarre, caivano, visaggio}@di.uniba.it
Abstract. The need for systematic evaluation of process quality and of the resulting products has always been an issue of primary importance within the software engineering community. In the past few years many factors have determined changes in the software process scenario that inevitably impact on software quality. To this end, goal oriented measurement models, such as Goal Question Metrics (GQM), have become essential for assessing desired quality and for enacting software process improvement (SPI). Although the importance of measurement is a shared issue, many software organizations encounter difficulties and strive to define and adopt measurement plans successfully. Causes are most likely attributable to critical issues such as measurement plan dimensions, complexity, dependencies among goals. Often the industrial projects are characterized by GQM plans with numerous quality factors and, consequently, numerous goals. This makes both measurement and interpretation procedures quite onerous. Furthermore, managing a measurement plan turns out to be quite costly and requires numerous investments. To this end, this work proposes a GQM-based approach (Multiview Framework) that provides support in designing a structured measurement plan in order to overcome the common problems mentioned previously, and manage large industrial measurement plans. The proposed approach has been validated through a post mortem analysis, consisting in a legacy data study, carried out on industrial project data.
1 Introduction In the past few years many factors have determined changes in the software process scenario. Among these: the need for developing software accordingly to cost and time constraints keeping quality at the same level; the criticality of software systems which requires constantly increasing reliability; technological innovation which addresses maintainable and scalable software. Such aspects inevitably impact on the quality of software, on its costs and on the ability of managing software projects. Furthermore, they point out the need for continuously monitoring and improving software production processes in order to fulfill the fixed quality goals. Quality is intended as the set of desired characteristics that a software process or system should have in order to satisfy the requirements. It is well known that software quality is highly correlated with the quality of development and maintenance processes. In particular, effective process control and improvement implies effective
process measurement. According to [9] “you cannot control what you cannot measure”. So, measurement becomes an essential aspect for software process improvement (SPI). Although the importance of measuring is a shared issue, many software organizations encounter difficulties and strive to define and adopt measurement plans successfully. The reasons are often related to the fact that measurement plans in an industrial setting tend to be very large and include numerous goals and metrics; with a high complexity of interpretation, because many metric values must be controlled and analyzed for each goal; and high dependencies between goals. This increases interpretation complexity and makes it more difficult to identify aimed improvement actions. So, although literature suggests to reduce number of goals and gradually introduce the measurement plan [3], in practice, this seldom occurs [10, 14]. Given these important issues, this work proposes a GQM-based approach (Multiview Framework) that provides guidelines for designing a measurement plan in order to overcome well known common problems and manage large industrial measurement plans. The proposed approach has been validated through a post mortem analysis carried out on industry wide project data. The remaining part of the paper is organized in the following way: Open Issues, discusses some important issues of goal oriented measurement. Proposed Approach describes the guidelines for applying the Multiview Framework. In Validation, the approach is applied to a measurement plan, and results are discussed. Finally, conclusions are drawn.
2. Open Issues Software product and process quality assessment are issues of primary importance for any software enterprise. In general, software engineers are of the opinion that software measurement should be goal oriented because it adapts to business and project needs. One well known approach to goal oriented measurement plan definition is the Goal Question Metrics (GQM) [1]. The main idea behind GQM is that measurement should be goal-oriented and based on context characterization. It uses a top-down approach to define metrics and a bottom-up approach for analysis and interpretation of measurement data. Quality goals reflect the business strategy and GQM is used to identify and refine goals based on the characteristics of software processes, products and quality perspectives of interest. Furthermore, it provides a general paradigm for defining a measurement plan. A proposed threshold for the number of goals to include in a measurement plan is 4-5 goals [3]. In that paper, the authors suggest that “goals should not cluster more than one purpose, quality focus, or viewpoint” in order to avoid confusion. In other words, a large measurement plan is easier to manage if the measurement goals are specific, clearly defined and structured. Also, when applying a GQM paradigm to define measurement goals within an organization, it is recommended to start with a small number of goals, gain experience and confidence with measurement strategies and then extend the measurement plan.
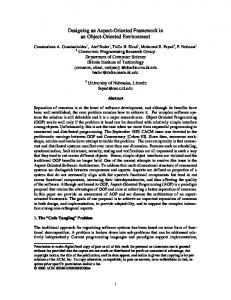
Unfortunately, in real projects the number of goals aren’t manageable nor determined by the measurer. Rather, they depend from the project characteristics and from the business goals that must be achieved. So, it is often necessary to have models with many goals. Also, the evaluation of the measures must be done to guarantee traceability between metrics and business goals. Therefore, in many cases it is not possible to gradually include the goals in the measurement plan. In spite of evidence of successful application of goal oriented measurement programs in industrial contexts such as NASA [5], Motorola [8], HP[12], AT&T [7], Schlumberger RPS [25] there are still many open issues: dimensions of a measurement plan; complexity of interpretations; dependencies between goals; time points for measurement activities. - Dimensions of a measurement plan depend from the project being executed in an organization. Moreover, in order to correctly evaluate aspects such as its processes, products, resources, economical issues and so on, many goals and therefore metrics may be necessary. A representative example is given by integrating large-grain quantifications such as SW-CMM [19], with finegrain evaluations provided by GQM. This inevitably leads to a measurement plan with a high number of goals and metrics [14]. On the contrary, a measurement plan with a limited number of goals in industrial field risks to be based on few generic goals, each including too many quality factors [10]; - Complexity and dependency issues are tightly related. Complexity of a measurement plan refers to the number of decisions that must be made to interpret the goal. Decisions depend from the metrics involved in the interpretation model of each goal. Therefore the more the metrics, the more the decisions and the higher the complexity. If the goals of a measurement plan are not appropriately structured, they risk to be dependent from one another. Two goals are dependent if one goal must rely on the interpretation results of the other goal in order to be interpreted. Consequently, complexity of interpretation increases in that a higher number of decisions must be made. - Another important issue are the time points in which measurement activities occur. More precisely, any measurement plan will most likely include goals having metrics that are collected at different time points (daily, monthly, every trimester etc). So at each time point, only a specific number of metrics can be collected and only part of the goals of the entire measurement plan can be interpreted. Furthermore, if the goals aren’t appropriately defined and structured, they may include metrics that are collected in different moments. This means that interpretation is more error prone because part of the measures involved for interpretation have become obsolete by the time all the other metrics needed are also collected. An example is shown in Figure1. In figure1.a., a time line is defined with three time points representing the moments in which measurement occurs; figure 1.b. shows two goals defined without considering when measurement occurs. For this reason they include metrics related to different moments. This means, as represented in figure1.c., that after time t1 no interpretation can be made. Only after t2, G1 can be interpreted but some of the measurements (M1) are outdated. This inevitably impacts the reliability of interpretation, because in that time
interval process performances or product characteristics may have changed. The ideal situation is to have goals that include concurrent measures, that are carried out at the same time point. So, although GQM “represents a systematic approach for tailoring and integrating goals to models of the software processes, products and quality perspectives of interest, based upon the specific needs of the project and the organization” [1], it doesn’t provide guidelines for structuring the goals and organizing metrics in order to manage large, complex measurement plans with many goals and measurements that are not necessarily concurrent.
t1
t2
t3
time (a) Goal 1
M1
M2
Goal 2
M3
M4
M5
M6
(b) Time point measurement
Measurement available
Interpretations
M1
NONE
Comments
M1, M2, M3, M4
G1
M1 is outdated; error prone
M1, M2, M3, M4, M5, M6
G1, G2
M1, M2, M3, M4 is outdated; error prone
(c)
Figure 1: measurement time points
Literature provides many examples of improvements, extensions and integrations made to the original definition of the GQM approach [2,4,6,13,15,16,17,18,23,24] as a consequence to gained experience in industrial settings. Nevertheless, they do not investigate the previously mentioned issues. In the next sections the authors present the approach (Multiview Framwork) and point out how it faces and overcomes such problems. In this sense, the main contribution is to provide an approach for designing a measurement plan so that each goal includes metrics that are measurable in a specific time point; each goal refers to a specific aspect that must be measured; goals are independent. Furthermore, it focuses on models whose number of goals depends from industrial projects, without being bonded either to the heuristic 4-5 goals rule nor to the need to reduce the number of metrics for each goal.
3. Proposed Approach “A prerequisite for any measurement plan is a deep understanding of processes and products to be measured” [4]. In this sense the Multiview Framework (MF)
characterizes the software project being evaluated and provides a model for defining a GQM according to the project definition. The model designs the goals by defining them according to what is being measured. In this way it is possible to select and carry out measures on a subset of goals that make up the entire measurement plan without having to execute it entirely. In the following the 4-step approach is described. Step 1: PROJECT DEFINITION A project is the execution of one or more activities that produce intermediate artifacts and deliverables and lead to a final product. Any project involves one or more processes. In this first step the project, must be defined. A project can be seen as a tuple PRJ=(P,D,PM,FI) where: - P=(p1,p2,…pn) is the set of processes, phases or activities executed to obtain the final products requested, starting from the raw products in input, to reach the fixed targets; - D=(d1,d2,…dm) the set of deliverables, i.e. input and output products and the artifacts produced during the execution of the processes in use; - PM: the set of project management activities and related artifacts needed to plan and control the project; - FI: the set of activities and artifacts needed to evaluate the fitness of investment. All the processes (P) involved and deliverables (D) produced must be identified. Furthermore, it is necessary to identify the activities involved in planning and controlling the project execution (Project Management-PM) and to evaluate the Fitness of Investment (FI). This is due to the fact that each project has a budget to respect and as a consequence it is important to adopt metrics for measuring and controlling this aspect. Given the project definition, we define a view as a set of goals related to each of the elements of the project definition included in Process, Product, Project Management or Fitness of Investment. This concept will be detailed in the next step. Step 2: GOAL SETTING In this step, each measurement goal is defined using the GQM goal template which consists of five dimensions [1]: 1. Analyze the object under measurement (product, process…) 2. for the purpose of understanding, controlling or improving the object 3. with respect to the quality focus of the object that the measurement focuses on 4. from the viewpoint of the people that measure the object 5. in the context of the environment in which measurement takes place Goal setting is done, according to the project PRJ=(P,D,PM,FI) characteristics, and the quality factors to be measured: a) Process goals: aimed at evaluating the quality factor of interest with respect to a process or activity pi∈P; b) Product goals: aimed at evaluating the quality of interest with respect to a deliverable or artifact d j∈D;
c)
Project Management goals: aimed at evaluating those activities (PM) needed to plan and control the project execution; d) Fitness of Investment goals: evaluate aspects such as cost-benefit ratio and possible risks (FI). Steps 2a and 2b, are strongly influenced by the process granularity. For example, lets suppose the process granularity is as described in figure2.a. In this case it is necessary to define one or more goals that refer to the entire process P=(p) and one or more goals for each deliverable dj∈D=(d0,d3). If, on the other hand, the process is defined at a lower granularity level as in figure2.b, then it’s necessary to define one or more goals for each process pi∈P=(p1,p2,p3) and one or more goals for each deliverable dj∈D=(d0,d1,d2,d3) exchanged between processes. Therefore, the more detailed the processes within the organization are, the more detailed and large the measurement plan will be. If we go into further detail, as in figure2.c., the set of processes include P=(p11, p12, p21, p22, p23, p3), and the deliverables are D=(d01, d02, d11, d12, d2, d3) The number of views increases proportionally to the granularity with which the processes are defined. d0
d3
p (a)
d0
p1
d1
p2
d2
p3
d3
d2
p3
d3
(b) d0.1 d0.2
d1.2 p1.1 p1.2
d1.1
d2.1
p2.1
p2.3 p2.2
d2.2 (c)
Figure2: different granularity of views
Also, the goals have to be defined keeping in mind the time points when the metrics are to be collected. Therefore goals should include concurrent metrics, collected in the same time point, that relate to the view and quality factor being measured. Based on what has been mentioned in the proposed approach, it is possible to have the following views within the measurement plan: - a view for every pi∈P, including all the goals that refer to a specific process pi. With refer to the template for goal definition, each view includes all the goals in which the Analyze section contains a specific pi∈P. - a view for every dj∈D, including all the goals that refer to a specific process dj. With refer to the template for goal definition, each view includes all the goals in which the Analyze section contains a specific dj∈D. - a view for all the goals related to Project management. With refer to the template for goal definition, the Analyze section can contain any process pi∈P or product dj∈D. What allows to distinguish these goals from the others is the With respect to section in which the quality factors evaluated relate to aspects such as: work progress, control of process execution, management of human or instrumental resources.
-
a view for all the goals related to Fitness of Investment. With refer to the template for goal definition, the Analyze section can contain any process pi∈P or product dj∈D. The With respect to section evaluates quality factors related to aspects such as: cost-benefit ratio, risks, coherence of execution times, costs of personnel and computer resources, project budget etc.
Note that applying the MF approach doesn’t reduce the number of goals that make up the measurement plan. At a first glance size may seem to represent a problem for managing the measurement plan itself, but this is not the case. In fact, the “structured” organization of the measurement plan allows to identify which goals and therefore measures refer to each view (processes, products, project management, fitness of investment). So, the quality manager and GQM team may focus on a subset of goals related to the view they are interested in evaluating according to the organization or project needs in a specific time point. Also, being the goals divided into views, it is easier to understand the relationship between the entities’ attributes and the metrics used to measure them. This allows to identify the most appropriate persons for each measurement activity. The measurers clearly see the connection between the measures to collect and the problems they allow to overcome, understand the need for metrics, are motivated in providing accurate data and avoid hiding shortcomings. Such a measurement plan takes into account the set of success factors presented and discussed in [11] and [20] from both an anecdotal and empirical point of view. Step 3: CROSS-VALIDATION The measurement plan structure is validated by tracing the goals in a Goal-View cross reference table. It is defined by placing the goals on the rows, and the views on the columns (table1). So, for example, each “X” entry in an (i,j) cell of the table means that the i-th goal has metrics that relate to the j-th view. Table1: goal-view cross reference table PROCESS
G1 G2 G3 G4 G5
p1 X
p2
PRODUCT p3
d0
d1 X
d2
PROJ. FITNESS MANAG OF INV d3
X X X X
X
X
The best resulting matrix is a diagonal one. In fact this means that there is one goal for each object of study forecasted by the model’s granularity. This means that each of the goals focus on the quality of a single object of study included in the project model, independently from the other objects in the process itself. The aim of the table is to point out dependencies between goals. An objective evaluation of such measures is given by the following two indicators:
#Dependencies: Points out the dependencies. Dependencies within the model are present when a goal takes into account more than one view, because it considers multiple processes and/or products, business or management issues measured at different time points. It is calculated with the following formula: k
# Dipendenci es = ∑ ( Ni − 1) i =1
where k=total number of rows of the cross-reference table; Ni = number of X in the cross-reference table, with refer to the i-th row;
The ideal condition is a dependence of, or very close to, zero. This means that each goal considers only one view and that the resulting table is a diagonal matrix. A high dependence implies a high complexity in that, on one end, the interpretation must consider such dependencies, on the other, a change introduced on a quality factor of a goal impacts on all the other quality factors and views that depend from the goal itself. Density of Dependencies Gives and idea of how strong the dependencies are. It is calculated with the following formula: DensityofD ependencie s =
# Dependenci es (# columns *# rows ) − # goals
Considering that, in an ideal situation, each goal should consider one view, the resulting value of this indicator depends from the number of extra “X” for each goal in the cross-reference table. The indicator increases when the number of “X” for each goal increases. The fixed threshold for the indicator depends from the organization adopting the metric plan for accessing its processes. In other words, if the organization requires a very accurate quality model, a low threshold such as 0.1 should be assessed. In other cases, where the aims are less restrictive the fixed threshold may be higher, for example, 0.3. To this moment these values have been decided heuristically and have not yet been empirically validated. According to the values of the two indicators, there are guidelines related to if and how to continue to structure the measurement plan. They consist of a goal analysis first, and then of a view analysis. The analyses involve the rows and columns of the cross reference table respectively. These guidelines are described as follows: Goal Review After calculating the two indicators it is necessary to consider if it is the case to redefine some of the goals. In particular, one of the following cases may occur: 1. there are no dependencies, therefore the density of dependencies is zero or not significant. So, measurement plan doesn’t need to be improved. 2. there are dependencies and the density of dependencies is higher than the fixed threshold. In this case the structure of those goals that consider more than one view must be restructured. In other words, those goals that have more than one
“X” per row in the cross reference table. Such goals must be restructured so that they consider only one viewpoint. This means that the questions and the metrics of the original goal must be adequately distributed among the new goals. The new structure of the metric plan can then be represented in a new cross reference table which will have a greater number of rows. View Review The previous step involves a row analysis which results in a set of goals, each considering one view. Nevertheless there may be numerous goals that evaluate the same view. Therefore, it is necessary to analyze the structure of the measurement plan according to the views. One of the following cases may occur for each view: 1. the goals of a view consider the same quality factors. In this case it is advisable to define only one goal for that view; 2. the goal related to a view includes many quality factors. In this case it is advisable to divide the goal in multiple ones, for each quality factor considered. Once the view analysis has been carried out, the goals that make up the metrics plan can then be represented in the cross reference table. Step 4: VERIFICATION OF INTERPRETATION COMPLEXITY The interpretation of the measures is a critical issue. In this approach, decision tables [21, 22] are used to represent the interpretation of a goal. A decision table is defined for each goal of the measurement plan. It can be seen as a tabular representation of a decision situation, where the state of a number of conditions determines the execution of a set of actions. Not just any representation, however, but one in which all distinct situations are shown as columns in a table, such that every possible case is included in only one column. A description of how decision tables are used for the interpretation is presented in figure2.
Figure2: decision table
A decision table is composed of four parts: condition stub contains the metrics used for the interpreting the goal (A); the condition entries correspond to the metric baselines (B); the action stub is the set of improvement actions that must be applied if the metrics do not reach the fixed baseline values (C); the action entries are the result of the combination of condition entries of the metrics involved and the possible actions (D). We convey in defining each action entry as a rule. Moreover, every table column of the decision table, from here on called rule, indicates which actions should (or should not) be executed for a specific combination of condition entries [21].
The complexity of the interpretation is equal to the total number of rules, or action entries that make up the decision table. The structure of the measurement plan resulting from the MF approach, consists of many specific goals each related to a single view, having a limited number of metrics, possibly homogeneous, concurrent and scarcely dependent. This reduces the overall complexity of the interpretation. Thanks to the decision tables, the interpretation results more comprehensible in that it clearly points out how metrics, condition entries and improvement actions are linked [27]. In other words, it is easier to understand the relationship between the attributes and the metrics used to measure them. Ideally the approach assures that each decision table interprets one goal, and in this way, avoids dependencies. More precisely, decision tables point out dependencies among goal interpretations. If the condition stub of a goal, lets say Gi, not only includes metrics but also other goals, such as Gk, necessary for interpretation, then Gi can be interpreted only after Gk. Furthermore, if Gi and Gk have metrics collected at different time points, dependencies may lead to error prone interpretations. For example, suppose that Gi’s metrics are collected at time t2, and it uses Gk for interpretation. If Gk’s metrics were collected during a previous time point (t1), interpretation conclusions would most likely be different than if Gk had been interpreted with metrics collected at time t2. Consequently, Gi interpretation is inevitably influenced. When decision tables point out dependencies between goals, Goal Review must be carried out again to remove or minimize such relations.
4. Validation In the following, approach validation is presented and results are discussed. 4.1. Legacy Data Method A first validation of the model has been done through a legacy aged study [26]. It is classified as a historical method because it collects data from projects that have already been completed. For this reason, we considered an existing measurement plan, defined within an executed project, and applied the proposed approach to it. The validation was based on analysis of how the structure of the measurement plan would have been if the MF approach presented in this work had been used to design it. Data was then collected and compared among the two measurement plans. The project considered for the study consisted in reengineering a legacy system in order to migrate the operative environment from monolithic centralized to clientserver architecture, and the language from assembler to Cobol and C++. A measurement plan was defined in order to monitor project execution according to the ISO9001 standard. The goals were defined according to the GQM approach, as known in literature. They measure quality factors, such as reliability, efficiency, maintainability, portability, process quality, project conformance, risks, usability. Being the project finished, a large amount of data was available for analysis. In order to validate the proposed model, the four steps of the MF were applied to the previous measurement plan.
The original measurement plan will be identified from here on with “NS-GQM” (non structured). The measurement plan resulting from the application of the multiview framework will be referred to as “S-GQM” (structured). Step1: Process Definition/Identification In step1 the project (PRJ) was defined. A graphical representation of the high level process used is given in figure 3 and detailed as follows:
R equirem ents D efinition
System R equirem ents
Test C ases
System R equirem ents
D evelopm ent
T est C ase D esign
D eveloped System
System T est C orrected D efects
D efects
T ested System
E xecution System in E xecution
D efect C orrection Project M anagem ent
Fitness of Investm ent
Figure 3: graphical representation of the project
PRJ: •
P = {Requirements Definition, Test Case Design, Development, System Test, Execution, Defect Correction}; • D = {System Requirements, Developed System, Test Cases, Corrected System, Defects, Tested System, System in Execution}; • PM = project management; • FI = fitness of investment; This step gives an overall view of what is being assessed in the project. Step2: Goal Setting Goals were defined for each view by using the GQM template. In this step the goals of the new measurement plan are defined according to the project definition PRJ. Although figure3 represents the entire project, only part of the processes (Test Case Design, System Test, Defect Correction, Execution) and products (Defects, Tested System, System in Execution) were involved in the monitoring process. For this reason the processes and products that weren’t involved in the monitoring activities are reported in dotted lines. Note that, when we applied the approach and analyzed in detail all of the quality factors and metrics, we assessed that the metrics used to measure the product Defect were actually related to Tested System. For this
reason, in the S-GQM the metrics were included in this view, and the Defect product is no longer present in table3. Goal definition according to the PRJ characterization assures that goals measure different views and that the metrics chosen are significant for the views being evaluated. Moreover, metrics identified and included also depend from the process granularity and from the time points when measurement activities occur. Step3: Cross Validation Cross-validation was carried out. To this end, the comparison between the goal-view cross reference tables of the NS-GQM and the S-GQM before and after applying the approach is interesting. They are presented respectively in table 2 and 3. Table 2: NS-GQM goal-view cross reference table Process T.Cse Syst. Des Test G1 G2 G3 G4 G5 G6
X
Def Exec Corr X
X
Product Def Test Syst X
Syst Exe.
Proj Mng
Fit. Inv
X X X
X
X X
X X X
X
G7 G8
X X
X
X
X
X
X
Table3: S-GQM goal-view cross reference table Process Product TCse Syst Def Exec. Test Syst Des Test Corr Exe Syst
GTestCaseDesign GSystemTest GDefectCorrec GExec, 1 GExec, 2 GTestSyst GSystExec,1 GSyst.Exec, 2 GProjectManag GFitnessOfInv, 1 GFitnessOfInv, 2
Proj Fit Mng Inv
X X X X X X X X X X X
In the first case, since the model had not been applied, the goals considered many views, and therefore inevitably clustered more than one purpose, quality focus, or viewpoint. This effect is visibly identified by the fact that the matrix is sparse, differently from the S-GQM, where the resulting matrix is close to a diagonal one. For example, for measuring the process System Test and the product Tested System,
the NS-GQM required seven goals: three process (G1, G4, G6) and five product (G1, G3, G5, G7, G8) goals. In particular G1 considered both process and product aspects. On the contrary, the S-GQM required only two goals: one process (GSystemTest) and one product (GTestSyst). Step4: Verification of Interpretation Complexity Finally interpretation complexity was verified. In other words, for each goal, decision tables were defined and complexity was calculated as the number of rules. The overall complexity of the S-GQM ranged from 6 to 32 rules. Not only decision tables reduce effort interpreting collected measures, but they allow to identify improvement actions more accurately. This is assured by the structure of the decision table itself, in that it considers all combinations of conditional states, and explicates the relation between attributes and entities’ attributes and the measures used to assess them. After applying the model, we analyzed and compared data related to the NS-GQM and S-GQM. A synthesis of the results obtained is presented in table 4. Table 4: comparison of NS-GQM and S-GQM
Data collected NS-GQM S-GQM Nr. Goals 8 11 Nr. Metrics 168 168 Nr. Metrics per goal (min) 21 11 Nr. Metrics per goal (max) 46 34 Nr. Metrics per goal (average) 32,75 20,18 Interpretation Complexity (min) 32 6 Interpretation Complexity (max) 63 32 Interpretation Complexity (average) 44,87 18,45 # Dependencies 24 0 Density of Dependencies 0,27 0 As it can be seen, although the overall number of goals is greater in the S-GQM, the average interpretation complexity is less. This is due to the lower number of metrics for each goal, achieved as a consequence to applying the Multiview Framework to the NS-GQM.
5 Conclusions This paper proposes a GQM-based approach for managing company wide quality models that require many goals and involve many quality factors: technical, functional, economical, managerial and so on. The approach provides: a) guidelines for designing a GQM so that each time point involves a limited number of goals to measure and interpret; b) guidelines for controlling and improving the quality model’s complexity; c) guidelines for controlling and improving interpretation; d) support for making goal interpretation more comprehensible
The proposed approach has been applied to a goal oriented quality model defined within a real industrial project many years ago. Application of the previous points a), b), and c) through the MF approach have proven the method’s efficacy. Point d) has been assessed in a previous study [27] through a controlled experiment. The experimentation and method application carried out to this moment are surely not enough to generalize the proposed approach to wider contexts. For this reason the authors aim in extending and executing further empirical investigation on other industrial projects.
References [1] V.R.Basili, G.Caldiera, H.D.Rombach, “Goal Question Metric Paradigm”, Encyclopedia of Software Engineering, John Wiley & Sons, Vol.1, 1994, pp. 528-532. [2] A Bianchi, D.Caivano, F.Lanubile, F.Rago, G.Visaggio, "Towards Distributed GQM", Proc.7th IEEE Workshop on Empirical Studies of Software Maintenance –WESS01- Florence Italy, 2001 [3] L.C.Briand, C.M.Differding, H.D.Rombach, “Practical Guidelines for Measurement-Based Process Improvement”, SOFTWARE PROCESS – Improvement and Practice, Vol.2, 1996 pp. 253-280. [4] A.Brockers, C.Differding, G.Threin, “The role of software process modeling in planning industrial measurement programs”, Proc.3rd International Software Metrics Symposium, Berlin, March 1996, pp.31-40 [5] V.R.Basili, S.Green, “Software Process Evolution at the SEL”, IEEE Software, vol.11, no.4, July 1994, pp.58-66. [6] L.C.Briand, S.Morasca, V.R.Basili, “An Operational Process for Goal-Driven Definition of Measures”, IEEE Transactions on Software Engineering, Vol28, No 12, December 2002, pp.1106-1125. [7] L.Barnard, A.Price, “Managing Code Inspection Information”, IEEE Software, vol.11, no.2, pp.59-69, Mar. 1994. [8] M.K.Daskalantonakis, “A Practical View of Software Measurement and Implementation Experiences within Motorola”, IEEE TSE, vol.18, no.11, 1992, pp.998-1010 [9] T.Demarco, Controlling Software Projects, Yourdon Press, New York, 1982 [10] A.Fuggetta, L.Lavazza, S.Morasca, S.Cinti, G.Oldano, E.Orazi, “Applying GQM in an Industrial Software Factory”, ACM Transactions on Software Engineering and Methodology, Vol 7, No.4, October 1998, pp.411-488 [11] A.Gopal, M.S.Krishnan, T.Mukhopadhyay, D.R.Goldenson, “Measurement Programs in Software Development: Determinants of Success“, IEEE Transactions on Software Engineering, vol.28, no.9, September 2002, pp.865-875. [12] R.B.Grady, Practical Software Metrics for Project Management and Process Improvement, Hewlett-Packard Professional Books, 1992 [13] T.Kilpi, “Implementing a Software Metrics Program at Nokia”, IEEE Software, November-December, 2001, pp.72-77. [14] A.Loconsole, “Measuring the requirements management key process area”, Proc. 12th European Software Control and Metrics conference - ESCOM01, London England, April 2-4, 2001, pp. 67-76. [15] F.V.Latum et al., “Adopting GQM-Based Measurement in an Industrial Environment”, IEEE Software, January-February 1998, pp. 78-86
[16] M.G.Mendonça, V.R.Basili, “Validation of an Approach for Improving Existing Measurement Frameworks”, IEEE Transactions on Software Engineering, Vol.26, No.6, June 2000, pp. 484-499. [17] R.J.Offen, R.Jeffrey, “Establishing Software Measurement Programs”, IEEE Software, March-April, 1997, pp.45-53. [18] T.Olsson, P.Runeson, “V-GQM: A Feed-Back Approach to Validation of a GQM Study”, Proc. of the 7th International Software Metrics Symposium -METRICS 01 – London England, April 4-6, 2001, pp.236 – 245. [19] M.C.Paulk, B.Curtiss, M.B.Chrissis, C.B.Weber, “Capability Maturity Model for Software”, Version 1.1., Pittsburg, Software Engineering Institute, 1993. [20] S.L.Pfleeger, “Lessons Learned in Building a Corporate Metrics Program”, IEEE Software, May 1993, pp.67-74. [21] U.W.Pooch, “Translation of Decision Tables”, Computing Surveys, vol.6, no.2, June 1974, pp.125-151 [22] http://www.econ.kuleuven.ac.be/tew/academic/infosys/research/prologa/prologa.htm [23] R.V.Solingen, E.Berghout, “Improvement by goal-oriented measurement - Bringing the Goal/Question/Metric approach up to Level 5”, Proc. European Software Engineering Process Group conference-E-SEPG-, June 16-20, 1997, Amsterdam, The Netherlands. [24] R.V.Solingen, E. Berghout, “Integrating Goal-Oriented Measurement in Industrial Software Engineering:Industrial Experiences with and Additions to the Goal/Question/Metric Method”, Proc. 7th International Software Metrics Symposium -METRICS01-, pp.246-258 [25] R.V.Solingen, F.V.Latum, M.Oivo, E.W.Berghout, “Application of Software Measurement at Schlumberger RPS: towards enhancing GQM”, Proc. 6th European Software Control and Metrics Conference – ESCOM95, The Netherlands, May 17-19, 1995. [26] M.V.Zelcowitz, D.R.Wallace, “Experimental Models for Validating Technology”, IEEE Computer, May 1998, pp.23-31. [27] M.T.Baldassarre, D.Caivano, G.Visaggio, “Comprehensibility and Efficiency of Multiview Framework for Measurement Plan Design”, Proceedings of the International Symposium on Empirical Software Engineering, Rome Italy, October 2003;