Eurospeech 2001 - Scandinavia
N-best Speech Hypotheses Reordering Using Linear Regression Ananlada Chotimongkol, Alexander I. Rudnicky Language Technologies Institute School of Computer Science Carnegie Mellon University
[email protected],
[email protected]
Abstract We propose a hypothesis reordering technique to improve speech recognition accuracy in a dialog system. For such systems, additional information external to the decoding process itself is available, in particular features derived from the parse and the dialog. Such features can be combined with recognizer features by means of a linear regression model to predict the most likely entry in the hypothesis list. We introduce the use of concept error rate as an alternative accuracy measurement and compare it withy the use of word error rate. The proposed model performs better than human subjects performing the same hypothesis reordering task.
1. Introduction In the context of dialog system speech recognition accuracy is highly correlated to task completion [1], errors in recognized speech can cause the dialog system to misunderstand a user and in turn leads to an unsuccessful task. Many recognizers can generate a list of plausible hypotheses or n-best list but output only the most probable one. Examination of the n-best list, reveals that the best hypothesis, the one with the lowest word error rate, is not always in top-1 position, but sometimes in the lower rank of the n-best list. In the Communicator, a dialog system for travel planning [2] the word error rate for the system is 12.5%. But if the best hypothesis is chosen from the 25-best list of each utterance (in an “oracle” mode), we can achieve 7.9% word error rate, a 37.0% relative improvement. Clearly there is information in the n-best list that can be used to identify the best hypotheses in the list and promote to top-1 position. In order to make the best hypothesis rise to the first rank in the n-best list, we need additional information that has not been yet considered by the recognizer. In the Communicator system we expect user utterances to be in the air travel domain and to be correlated with the previous system utterance. Therefore, the conformance of a hypothesis with respect to the domain grammar and dependency between system and user utterances are among the features that we can use to reorder the hypothesis list. To reorder n-best hypothesis list, the additional information can be integrated to the recognizer itself or used sequentially by the reordering module after the recognition phase which is also called the post-processing approach. The integrated approach was applied in [3], where additional information from reliability models of acoustic units was used to adjust the scores of recognizer search paths. Some postprocessing approaches are described in [4] and [5]. Additional linguistic knowledge was modeled as a multi-level n-gram model in [4] and as a linear combination model in [5].
In this paper, the post-processing approach was chosen to reorder the n-best hypotheses since it is considered less complex than integrating all information in the recognizer. The post-processing approach also benefits from the features (such as syntactic ones) derived from a complete hypothesis. We use a linear regression model to optimally combine different types of information extracted from a hypothesis and then predict the correctness score of that hypothesis. Since we are interested in accuracy in the context of dialog systems, we also consider the use of concept accuracy as a criterion for hypothesis reordering, in addition to recognition accuracy. Concept error rate is relevant since it, rather than word accuracy, governs the behavior of the system as a whole. This paper is organized as follows; in Section 2 we describe the features used in reordering model. The linear regression model, which is used to combine the features, is described in section 3. Concept error rate is described in section 4. Section 5 gives the experimental result and the discussion.
2. Features selection We select different types of information or features based on the analysis of the domain and experiment with human beings on the same reordering task. The human experiment is discussed in section 5. 2.1. Syntactic features In the Communicator system we expect user utterances to be in air travel domain, which are covered by a pre-defined grammar. Therefore, the conformance of a hypothesis with respect to the grammar can be used to select the hypothesis that is more relevant to the domain [4], [5]. The conformance between the hypothesis and the grammar can be determined by the quality of the hypothesis parse. In the Communicator system, the Phoenix parser [6] is used. Phoenix is specifically designed for extracting information from spontaneous speech, so it is robust with respect to some recognition errors and to speaker disfluency. The following features are used to measure the parse quality. 2.1.1.
Coverage
Coverage is the number of words in a hypothesis that is covered in the parse produced by Phoenix. This feature is normalized by the total number of words in a hypothesis. 2.1.2.
Fragmentation
Fragmentation is the number of changes from parse fraction to unparsed fraction and vice versa in the output parse. This feature is normalized by the number of total number of fractions, both parsed and unparsed, in the hypothesis.
Eurospeech 2001 - Scandinavia
2.2. Semantic features 2.2.1.
Correlation between system and user utterances
In the context of a dialog system, a user utterance is likely to be influenced by a previous system utterance. System utterances can be categorized according to the dialog states, such as query_arrive_city and query_depart_date. There are 18 dialog states in the current Communicator system. Given the state of the system, it is possible to predict a user response. We use a topic slot from the parser as a representation of a user utterance. The correlation between a system utterance and a user utterance is the conditional probability of a user utterance given a system utterance, which can be calculated by the following equation. P(uuser | usystem ) =
4. Concept error rate
N
∏ P(dialog _ state | topic _ sloti )
(1)
i
System: “Where would you like to go?” User: “I would like to go to Boston.” Dialog state: query_arrive_city User utterance’s output parse: Reserve_Flight:[i_want] ( I'D LIKE TO ) Reserve_Flight:[arriveloc] ( GO TO [Arrive_Loc] ( [Location] ( [city] ( [City_Name] ( BOSTON ) ) ) ) ) User utterance slots: Reserve_Flight:[i_want], Reserve_Flight:[arriveloc] Figure 1: A sample dialog and corresponding dialog state and user utterance slots. 2.2.2.
set of 20%, 30% and 40% word error rate hypotheses should be selected while it should not be selected if it is in the set of 10%, 15% and 20% word error rate hypotheses. Thus, we introduce the relative quality measure of the hypothesis with respect to another hypotheses of the same utterance called a correctness score. The hypothesis that has the lowest word error rate for each utterance was given a correctness score of 1 while the hypothesis with the highest word error rate was given a score of 0; intermediate word error rates were scaled in this range. The linear regression model was then used to predict the correctness score of each hypothesis, given the features. The hypothesis that receives the highest correctness score for each utterance is then output as the (reordered) top-1 result.
Relationship between topic slots
There is relationship between topic slots in a user utterance. We model this relation by a slot bigram model. The unparsed fraction of a user utterance is captured in a gap slot.
2.3. Acoustic features Acoustic features for the recognizer are still useful even though they have already been used to generate recognizer output. Some of them are not directly used when a recognizer selects its most probable hypothesis. Moreover, users don’t always say what they are expected by the system to say and sometimes syntactic and semantic information are not sufficient to distinguish between competing hypotheses. The yes/no answer is a good example for the necessity of acoustic features.
3. Linear regression model In a preliminary experiment, using each feature alone to reorder n-best hypotheses, we found that we could not improve the word error rate. Therefore, we decided to combine the features together using a linear regression model, given that each feature has nearly linear correlation with the word error rate. However, in the context of hypotheses reordering, we try to select the hypothesis that has the lowest relative word error rate among the set of n-best hypotheses of each utterance without considering its absolute value. For example, the hypothesis that has 20% word error rate in the
Word error rate, which is a commonly used metric to evaluate the performance of a reordering module, considers the surface words in an utterance. However, in a dialog system, the semantic form output from the parser is used instead of the surface form. The semantic parser allows variations of the same concept to be mapped into the same form and moreover ignores non-concept words (for example, social pleasantries). Therefore surface word variation of the same concept such as, “yes” and “yeah”, and recognition errors in non-concept words do not affect the performance of dialog system In order to measure the performance of the reordering module using a metric that better correlates with the performance of a dialog system, we examined concept error rate as an alternative evaluation metric. The output parses from the parser of the reordering module output and the transcript are compared instead of the surface words. Each slot in the parse is considered as one concept. However, not every slot and slot value are considered by a dialog manager. The slot can be categorized into 3 types: • Non-concept slot is a slot that contains information that, while captured in the grammar is not considered relevant for selecting a system action. Politeness expressions, such as “please”, are an example.
• Value-insensitive slot is a slot whose identity, rather than specific value, is sufficient to drive system action. An example would be [_yes]. • Value-sensitive slot is a slot for which both the occurrence and the value of the slot are important, for example [City_Name]. For different types of slots different pieces of information are converted to concept. The entire non-concept slot is discarded. For a value-insensitive slot only its label is converted to concept while a value-sensitive slot both its label and value are converted to concept. To calculate the concept error rate, each concept is considered as one token that is equivalent to word in the calculation of word error rate. Therefore the algorithm for calculating word error rate can be used to calculate concept error rate without any modification as in [7]. For example, the reordered hypothesis in figure 2 has word error rate of 50% (one substitution of “yes” with “yeah” and one deletion of “please”). However, this hypothesis will have 0% concept error rate since both concepts are matched. The errors in the surface level are occurred with non-concept word “please” and concept error
Eurospeech 2001 - Scandinavia
rate also allow the variation for concept [_yes]. Since these two utterances mean the same, the concept error rate is a better measurement.
Transcript: “Yes to Boston please” Output parse: Respond:[_yes] ( YES ) Reserve_Flight:[arriveloc] ( TO [Arrive_Loc] ( [Location] ( [city] ( [City_Name] ( BOSTON ) ) ) ) ) Reserve_Flight:[Polite] ( PLEASE ) Concept: [_yes], [arriveloc][City_Name](BOSTON) Reordered hypothesis: “Yeah to Boston” Output parse: Respond:[_yes] ( YEAH ) Reserve_Flight:[arriveloc] ( TO [Arrive_Loc] ( [Location] ( [city] ( [City_Name] ( BOSTON ) ) ) ) ) Concept: [_yes], [arriveloc][City_Name](BOSTON) Figure 2: Output parses and corresponding concepts of the transcript and reordered hypothesis.
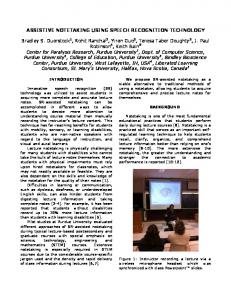
5. Experiment and discussion To evaluate the performance of the proposed reordering model, Sphinx-II speech recognizer [8] was used to generate the 25-best hypotheses of the utterances collected from Communicator system. From the graph in figure 3, we see that the accuracy of the linear regression model degrades when the number of hypotheses is large due to noise at the lower rank. Therefore, for the optimal trade of between calculation complexity and reordering performance, only the top-5 hypotheses from 25-best hypotheses are considered.
Linear Regression
tested our model on 1,718 utterances from June 1999 Communicator data. The result is shown in table 2.
Recognizer Linear regression
WER
Relative Improvement
CER
Relative Improvement
12.46%
-
12.03%
-
11.97%
Oracle
3.96% 11.60%
9.02%
27.61%
8.86%
3.57% 26.35%
Table 2: Word error rate (WER) and concept error rate (CER) of June 1999 test set. The improvement from the linear regression model was less than other models mentioned in section 1. However, it is difficult to make a fair comparison due to different test data. We found that some reordering techniques such as highest-incoverage which gained 6.8% relative improvement on word error rate in [5], did 2.0% relatively worse than the baseline on our test data. Nevertheless, our proposed model did as well as human beings on the same test data as discussed below. We conducted an experiment to compare our model with human ability in reordering the n-best hypotheses list similar to the experiment in [10]. Each human subject was given the list of 5-best hypotheses of 30 utterances that had a comparable word error rate to the test set and the system utterance that was spoken before. The subject was told that the hypotheses were given in the order of speech recognizer confidence, but audio files were not provided. The subject was asked to select the most appropriate hypothesis from the list. They were allowed to select more than one hypothesis if they are equally appropriate. They were also allowed to arbitrary edit the hypotheses. The average result on 8 subjects and 2 test sets are given in the graph following graph.
Oracle
native
13.0% 12.0%
non-native
20.0% 15.0%
10.0%
WER
WER (%)
11.0%
9.0% 8.0%
10.0% 5.0%
7.0%
20
25
an um H
Figure 3: Word error rate on the test data when reordered using different hypotheses list size. The reordering model was trained on 35,776 utterances of Communicator data from June 1998 to May 1999. The training set was separated into two sets. The first set was used to train the conditional probability of user utterance topic slots given the dialog state and the topic slot bi-gram probability. The CMU-Cambridge language model toolkit [9] was used to create the bi-gram model. The second training set was used to train the coefficient of a linear regression model to predict correctness scores using S-PLUS (version 4.5). We
e O ra cl
15
eg re s
10
Hypothesis list size (n in n-best)
R
de r 5
D
0
ec o
5.0%
Se le ct io n si on M od el H um an Ed it
0.0%
6.0%
Figure 4: Word error rate of different reordering method.
Eurospeech 2001 - Scandinavia
as an alternative evaluation metric that appears to be more consistent with human reordering criteria. The current regression model still has room to improve. We consider adding more features in word level, such as word confidence score and frequency of words in n-best hypotheses, since it is among the most frequent features used by human subjects. To optimize the concept error rate of the regression model, we will consider predicting the correctness score based on concept error rate. However, the skewed distribution of the concept error rate must be taken into account.
non-native
le O ra c
Ed it
H um an
M
io n si on
eg re s
Se le ct R
um
an
De c H
od el
20.0% 18.0% 16.0% 14.0% 12.0% 10.0% 8.0% 6.0% 4.0% 2.0% 0.0% od er
CER
native
Figure 5: Concept error rate of different reordering method. Native and non-native speakers differed in their ability to perform the task even though all the non-native speakers have a good command of English and were familiar with the domain. The word error rate and concept error rate of nonnative speaker on both selecting and editing were higher than the native speakers. When subjects were allowed to arbitrary edit the hypotheses, native speakers’ editing was better than their selection of a best hypothesis, while for non-native speaker editing was worse. These results shows that the familiarity with the language is an important factor in n-best hypotheses reordering task and suggests that understanding the cues used by native speakers would contribute to better reordering performance. The current regression model did as well as native speaker selection, suggesting that an automatic reordering process can be quite competitive. On the other hand, when evaluated using concept error rate, humans did better. This result shows that humans try to minimize concept error rate and not word error rate. Therefore concept error rate is a better evaluation metric for hypotheses reordering. When the native speakers were allowed arbitrary editing they could gain higher word error rate and concept error rate reduction even better than oracle. This improvement showed that there is useful information outside the n-best list that can be used. The accuracy improvements reported in this work fall short of those reported for similar work done using the ATIS corpus ([4], [5]). However we note that the portion of the corpus used for those experiments appear to include utterances that are on the average significantly longer than those in our corpus (3.5 words). Short utterances may have insufficient structure to effectively engage the parse-level features in our model. Our human data suggests that users (in self-reports) make use of the following features: syntax, conformance to the topic of the prompt, presence of insertions and deletions and the appropriateness or naturalness of the response. We believe that some form of this information could be automatically extracted from utterance hypotheses and made use of for reordering.
6. Conclusions We propose the n-best hypotheses reordering approach that use a linear regression model to combine different information sources. The proposed model did as well as native speakers in term of word error rate. We also propose a concept error rate
7. Acknowledgement This research was sponsored by the Space and Naval Warfare Systems Center, San Diego, under Grant No. N66001-99-18905. The content of the information in this publication does not necessarily reflect the position or the policy of the US Government, and no official endorsement should be inferred.
8. References [1] Rudnicky, A. I., “CMU Communicator”, in DARPA Communicator PI Meeting, Philadelphia, PA, 2000. [2] Rudnicky, A. I., Bennett, C., Black, A. W., Chotimongkol, A., Lenzo, K., Oh, A. and Singh R., “Task and Domain Specific Modeling in the Carnegie Mellon Communicator System”, in Proc. ICSLP’00, Beijing, China, 2000. [3] Mou, X. and Zue, V., “The Use of Dynamic Reliability Scoring in Speech Recognition” in Proc. ICSLP’00, Beijing, China, 2000. [4] Moore, R., Appelt, D., Dowding, J., Gawron, J. M. and Moran, D., “Combining linguistic and statistical knowledge sources in natural-language processing for ATIS”, in Proc. ARPA Spoken Language Systems Technology Workshop, Austin, TX, 1995. [5] Rayner, M., Carter, D. M., Digalakis, V. and Price, P., “Combining Knowledge Sources to Reorder N-best Speech Hypothesis Lists”, in Proc. the ARPA HLT Meeting, 1994. [6] Ward, W., “Understanding Spontaneous Speech: The Phoenix System”, in Proc. ICASSP’91, Toronto, Canada, 1991. [7] Boros, M., Eckert, W., Gallwitz, F., Hanrieder, G., Gorz, G. and Niemann, H., “Towards understanding spontaneous speech: Word accuracy vs. concept accuracy.” in Proc. ICSLP'96, Philadelphia, PA 1996. [8] Huang, X. D., Alleva, F., Hon, H. W., Hwang, M. Y., Lee, K. F. and Rosenfeld, R., “The SPHINX-II Speech Recognition System: An Overview”, Computer, Speech and Language, vol. 2, 1993. [9] Clarkson, P. R., and Rosenfeld, R., “Statistical Language Modeling Using the CMU-Cambridge Toolkit”, in Proc. of EUROSPEECH'97, Rhodes, Greece, 1997. [10] Brill, E., Florian, R., Henderson, J. C. and Mangu, L., “Beyond N-Grams: Can Linguistic Sophistication Improve Language Modeling?”, in Proc. COLINGACL'98, Montreal, Canada, 1998.