eled to the overall SNR at each frequency bin. It turned out, that the smoothing of the short-term PSD. Φss(m, Ωµ) in (4) yields best results with the time con-.
1
IWAENC 2006 – PARIS – SEPTEMBER 12-14, 2006
NEAR END LISTENING ENHANCEMENT WITH STRICT LOUDSPEAKER OUTPUT POWER CONSTRAINING Bastian Sauert, Gerald Enzner, and Peter Vary {sauert,enzner,vary}@ind.rwth-aachen.de Institute of Communication Systems and Data Processing ( ) RWTH Aachen University, Germany ABSTRACT The concept of near end listening enhancement has recently been proposed for improving the speech intelligibility of telecommunication equipment in the presence of ambient noise. Near end listening enhancement is a signal processing framework that acts on the received signal from the far end speaker to reduce the listening effort of the near end speaker. Since it is often not acceptable/possible to increase the emitted loudspeaker power, this paper investigates the opportunities of listening enhancement under the constraint that the processed loudspeaker signal power is strictly equal to the power of the received signal. We will compare two reasonable processing strategies: a previous one that aims at the amplification of speech at noisy frequencies and a new one which cuts down the speech power at noisy frequencies. The results show that a considerable improvement of speech intelligibility can be achieved by the second approach which can be understood by a simple model of human hearing.
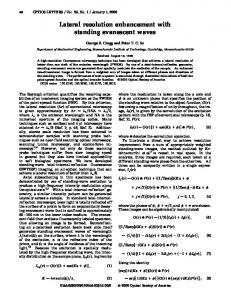
1. INTRODUCTION Mobile communication is often conducted in the presence of acoustical background noise, which leads to two major problems: 1. The noise is recorded by the microphone along with the speech and transmitted over the telephone network to the far end listener. An overview of the most popular approaches to cope with this problem of noise reduction is presented in, e. g., [1]. 2. The near end listener also experiences a reduced speech intelligibility since he is located in the noisy environment and perceives a mixture of the clean far end speech and the acoustical background noise as illustrated by Figure 1.
For the problem of near end listening enhancement, as opposed to the problem of noise reduction, the noise signal cannot be influenced because the person is located in the noisy environment and the noise reaches the ears with hardly any possibility to intercept. Therefore a reasonable option to improve intelligibility by digital signal processing is to manipulate the far end speech signal. In [2] we proposed a time adaptive and frequency dependent approach which tries to amplify the far end speech signal in order to reestablish a certain distance between the average speech spectrum and the measured noise spectrum, i. e., to recover a target signal-to-noise ratio. This algorithm obviously raises the speech signal power. However, in some applications the power of the loudspeaker signal is constrained to the power of the original signal, e. g., because the sound reproduction system has no headroom in terms of output power. Consider, for instance, mobile phones with tiny loudspeakers which are already saturated at low output power levels. Therefore we present in this contribution some investigations about near end listening enhancement with strict output power constraining. 2. NEAR END LISTENING ENHANCEMENT WITH OUTPUT POWER CONSTRAINING The fundamental idea of this work is a frequency dependent filtering of the speech signal without a change in the
telephone network far end speaker
near end listener Figure 1: The problem of near end listening enhancement.
2
IWAENC 2006 – PARIS – SEPTEMBER 12-14, 2006
signal power. Two strategies of filtering are presented, which both consider the measured speech spectrum and the measured noise spectrum. The speech signal s(k) and the noise signal n(k) are divided into half-overlapping blocks of 20 ms length, which are denoted with the frame index m. Each frame is multiplied with a Hann window and transformed to the frequency-domain representations S(m, Ωµ ) and N (m, Ωµ ) using the discrete Fourier transform (DFT), where Ωµ is the discrete DFT frequency and µ is the frequency index. ˜ Then, the loudspeaker output signal S(m, Ωµ ) is obtained by filtering of the speech signal S(m, Ωµ ) ˜ S(m, Ωµ ) = G(m, Ωµ ) · S(m, Ωµ ) .
(1)
The linear filter G(m, Ωµ ) consists of two parts: G(m, Ωµ ) = G′ (m, Ωµ ) · a(m) .
(2)
The frequency dependent filter G′ (m, Ωµ ) amplifies some frequency components and attenuates others based on the design criterion. Two possible methods to design the frequency dependent filter G′ (m, Ωµ ) are dicussed in Section 3 and Section 4. In both cases, the filter will depend on the short-term power spectral density (PSD) of the speech signal, Φss (m, Ωµ ), and the short-term PSD of the noise signal, Φnn (m, Ωµ ), which are determined according to Section 2.1. Since our design of the filter G′ (m, Ωµ ) does not guarantee, that the output power σs˜2 (m) is equal to σs2 (m), we have to correct the output power of the filtered signal G′ (m, Ωµ ) · S(m, Ωµ ). It can be easily shown that a frequency independent correction factor a(m) has to be determined as the ratio of input frame power and output frame power v 2 P u u S(m, Ωµ ) u µ (3) a(m) = u 2 . t P ′ G (m, Ωµ ) · S(m, Ωµ ) µ
Finally the filtered and power adjusted speech coefficients ˜ S(m, Ωµ ) are transformed back to time-domain using the inverse DFT and recombined with the overlap-add technique. 2.1. Short-Term PSD
The short-term PSD Φss (m, Ωµ ) which is mentioned in the previous section is computed as the recursive average of the periodogram |S(m, Ωµ )|2 : Φss (m, Ωµ ) = αS · Φss (m − 1, Ωµ ) 2 + (1 − αS ) · S(m, Ωµ ) ,
(4)
where αS ∈ [0, 1] is the time constant of the recursive average. Φnn (m, Ωµ ) may be estimated with any noise estimator, e. g., [3]. For our simulations under lab conditions, we compute Φnn (m, Ωµ ) analogously to (4) with the time constant αN = 0.96. 3. METHOD OF EQUAL SNR The basic principle of the method of “equal SNR” is to reduce speech signal power in frequency bands where the speech overtops the noise—and thus is already audible enough—and to raise speech signal power in frequency bands where the speech is covered by the noise. More technically speaking, the speech signal is attenuated in frequency bands with a high signal-to-noise ratio (SNR) and amplified in frequency bands with a low SNR, i. e., the SNR is leveled over the whole frequency range. According to [2], one option is to set the ratio of the shortterm PSD of the filtered speech, G′2 (m, Ωµ )·Φss (m, Ωµ ), and the short-term PSD of the noise signal, Φnn (m, Ωµ ), equal to one: G′2 (m, Ωµ ) · Φss (m, Ωµ ) = 1, Φnn (m, Ωµ ) which leads to the filter G′ (m, Ωµ ): s Φnn (m, Ωµ ) ′ . G (m, Ωµ ) = Φss (m, Ωµ )
(5)
(6)
The speech signal is weighted according to the reciprocal signal-to-noise ratio. Thereby, together with the subsequent power control factor a(m), the output SNR is leveled to the overall SNR at each frequency bin. It turned out, that the smoothing of the short-term PSD Φss (m, Ωµ ) in (4) yields best results with the time constant αS ≈ 0.996. Unfortunately, the solution (6) over-attenuates speech signal components with high SNRs. Therefore, a second heuristic possibility is considered: s Φnn (m, Ωµ ) + Φss (m, Ωµ ) ′ . (7) G (m, Ωµ ) = Φss (m, Ωµ ) For noise-free frequencies, i. e., Φnn (m, Ωµ ) ≈ 0, Equation (7) leads to G′ (m, Ωµ ) ≈ 1 as opposed to (6), which would result in total attenuation of the speech signal. In addition to the preservation of the speech signal, this also avoids numerical problems in (3) in low-noise environments. Since G′ (m, Ωµ ) ≥ 1, the attenuation factor a(m) always is smaller than one. Thereby the speech signal is attenuated at “audible” frequencies and amplified at “inaudible” or “less audible” frequencies.
3
IWAENC 2006 – PARIS – SEPTEMBER 12-14, 2006
4. METHOD OF MAXIMAL POWER TRANSFER This approach is based on a simple model of hearing (i. e., speech understanding) which is depicted in Figure 2. In principle, the speech signal s(k) which is obtained from the telecommunication network has to be filtered in the phone in order to assist the speech understanding process of the listener. In the model, speech understanding is deteriorated by the acoustic channel of hearing, i. e., the channel from loudspeaker to eardrum, which adds background noise n(k) to the emitted speech signal s˜(k). Let us assume that a reasonable, still simple model of human hearing consists of two cognitive stages:
s˜(k) is constrained to the power of the original signal s(k), cf. Section 2. Clearly, the proposed strategy will result in linear distortion of the original signal s(k), but let us assume it pays off in terms of the ability of human hearing in noisy acoustic environments. One possible (heuristic) filter structure G(m, Ωµ ) to assist the maximal power transfer from source to sink consists of the following two steps. • At first, we apply a frequency dependent attenuation G′ (Ωµ ) to the original signal s(k), e. g., G′ (m, Ωµ ) =
• noise reduction pre-processing H(Ωµ ) which is applied directly to the noisy signal y(k)
s(k) speech source e. g., telecommunication network
s˜(k)
, (8)
where the constant K1 has to be adjusted to deliver the best possible speech intelligibility (K1 ≈ 0.01). Φ′nn (m, Ωµ ) will be defined below.
• and a second, independent process which performs the actual speech understanding. This decomposition is justified by the fact that the basilar membrane of the inner ear performs a frequency analysis [4]. We therefore assume that cognitive signal processing could “easily” omit the noise-distorted frequencies before the actual speech understanding will happen. This is represented by the noise reduction filter H(Ωµ ) which is of course not exactly known. However, in a first attempt we may assume that it acts at least as intelligent as a Wiener filter, i. e., H(Ωµ ) will attenuate the signal y(k) at frequencies where the signal-to-noise ratio Φs˜s˜(m, Ωµ )/Φnn (m, Ωµ ) is low and preserve the signal where the signal-to-noise ratio is high. Our aim of improving speech intelligibility in noisy acoustic environments motivates a method of “maximal power transfer” from source s(k) to sink sˆ(k). The key idea of maximal power transfer is to emit a signal s˜(k) primarily at those frequencies where the acoustic channel is clean, i. e., where Φnn (m, Ωµ ) is low. This strategy will avoid a waste of speech components on frequency channels which will be attenuated by the presence of noise reduction H(Ωµ ) in the model of hearing. This has a particular relevance if the power of the loudspeaker signal
K1 ·
K1 · σs2 (m) 2 σs (m) + Φ′nn (m, Ωµ )
• Then, we apply the scalar amplification a(m) according to Section 2 in order to match the power of loudspeaker output signal s˜(k) and original speech signal s(k). Due to the fact that G′ (m, Ωµ ) < 1, the amplification factor will always be a(m) > 1. In this way, we achieve an amplification of the signal s(k) at “audible” frequencies and an attenuation of the signal s(k) at “inaudible” (i.e., noise distorted) frequencies. Assuming a Wiener filter H(Ωµ ), this filter structure G(m, Ωµ ) will certainly increase the speech power received at the sink sˆ(k) of the hearing model. In order to limit linear distortions produced by G′ (m, Ωµ ) to a reasonable degree, we apply a noise floor to the estimated noise PSD, i. e., Φ′nn (m, Ωµ ) = max {Φnn (m, Ωµ ), Φnn,min (m)} . (9) The noise floor Φnn,min (m) can be chosen adaptively as Φnn,min (m) = K2 · σn2 (m), with K2 ≈ 0.2. Alternatively, we may choose a fixed value on the basis of the noise power level at the signal-to-noise ratio of, e. g., 7.5 dB. y(k)
sˆ(k)
linear filtering G(Ωµ )
noise reduction H(Ωµ )
e. g., phone
e. g., Wiener filter background noise n(k)
speech sink speech understanding
cognitive model of human hearing (speech understanding)
Figure 2: A simple cognitive model of human hearing (i. e., speech understanding) in noisy acoustic environments.
4
IWAENC 2006 – PARIS – SEPTEMBER 12-14, 2006
5. RESULTS The performance of the proposed algorithms was evaluated in terms of the Speech Intelligibility Index (SII) [5]. 5.1. Speech Intelligibility Index The SII is supposed to be correlated with the intelligibility of speech under a variety of adverse listening conditions. It is basically computed by adding the speech-to-noise ratio in each contributing frequency band weighted according to its contribution to speech intelligibility. According to [5], good communication systems have an SII of 0.75 or above, while poor communication systems have an SII below 0.45 (see Figure 3). The SII was calculated with the critical band procedure. In order to calculate the speech and noise spectrum level of each sound file, the spectrum level is calculated for frames of 20 ms length, averaged in decibel-domain, and normalized to match the overall level. Thereby an average speech spectrum level of the whole speech database was achieved which is comparable to the standard speech spectrum level for normal vocal effort specified in [5]. 5.2. Simulation Results In our evaluation, the SII was calculated for every speech file of the TIMIT database, in total 5.4 hours, disturbed by destroyer engine noise from the NOISEX-92 database. The mean of the SIIs without processing and after processing with the developed algorithms is depicted in Figure 3 for several signal-to-noise ratios and sample rate 8 kHz. In the most relevant SNR range from 0 dB to 10 dB the method of maximal power transfer increases the SII by up to 0.1. The method of equal SNR, however, does not change the SII over almost the whole range of relevant SNR. Only at high signal-to-noise ratios a slight increase can be measured. It should be noted, that the degradation compared to [2] is due to the strict power constraining, i. e., the lack of available head-room. Informal listening tests also indicate a distinct preference for the method of maximal power transfer over all alternatives presented in this paper. 6. CONCLUSIONS In this contribution we compared two reasonable strategies for near end listening enhancement with strict loudspeaker output power constraining, i. e., enhancement of
1.0 0.9
mean Speech Intelligibility Index
Regarding the implementation of the described method, we observed that moderate or no smoothing in (4) yields best results in terms of speech intelligibility, i. e., αS → 0.
good 0.8 0.7 0.6 0.5 0.4
poor 0.3 Without processing Max. transfer, adapt. floor Max. transfer, fixed floor Equal SNR
0.2 0.1 0.0 −20
−10
0
10
20
30
signal-to-noise before processing Figure 3: Mean Speech Intelligibility Index before and after processing with proposed methods and strict power constraining. intelligibility of clean speech in the presence of ambient noise without spending additional speech signal power. The first strategy is an adaptation of previous work [2] to the power constraint and aims at an equal signal-to-noise ratio at all frequencies, i. e., especially the amplification of speech at noisy frequencies. Opposed to that, the second strategy of “maximal power transfer” is motivated by a simple model of human hearing. It cuts down the speech power at noisy frequencies and distributes it among clean frequency channels. The results show that an significant improvement in the Speech Intelligibility Index can be achieved by the second approach. However, it should be noted that we do not raise any claims of optimality regarding this solution. 7. REFERENCES [1] Peter Vary and Rainer Martin, Digital Speech Transmission: Enhancement, Coding and Error Concealment, John Wiley & Sons Ltd, New York, Chichester, Jan. 2006. [2] Bastian Sauert and Peter Vary, “Near end listening enhancement: Speech intelligibility improvement in noisy environments,” in Proceedings of ICASSP, May 2006. [3] Rainer Martin, “Noise power spectral density estimation based on optimal smoothing and minimum statistics,” IEEE Transactions on Speech and Audio Processing, vol. 9, no. 5, pp. 504–512, July 2001. [4] Eberhard Zwicker and Hugo Fastl, Psychoacoustics. Facts and Models, Springer, Berlin, Heidelberg, New York, 2nd edition, 1999. [5] American National Standard, “Methods for the Calculation of the Speech Intelligibility Index,” ANSI S3.5-1997, 1997.