(Moran and Desimone, 1985; Haenny and Schiller, 1988; Haen- ny et al., 1988; Spitzer et al., 1988; Maunsell et al., 199 1; Motter,. 1993). The results reported in ...
The Journal
Neural Correlates of Feature Selective Extrastriate Area V4
Memory
of Neuroscience,
April
1994,
14(4):
2190-2199
and Pop-Out in
Brad C. Motter VA Medical Center and Departments 13210
of Physiology and Neurosurgery,
Neural activity in area V4 was examined to assess (1) whether the effects of attentive selection for stimulus features could be based on the memory of the feature, (2) whether dynamically changing the feature selection would cause activity associated with the newly selected stimuli to pop out, and (3) whether intrusion of more than one stimulus into the receptive field would disrupt the feature-selective activity. Rhesus monkeys were trained on several variations of a conditional orientation discrimination task. A differential activation of area V4 neurons was observed in the conditional discrimination task based gn the presence of a match or a nonmatch between the conditional cue (a particular color or luminance) and the color or luminance of the receptive field stimulus. The differential activation was unchanged when the cue was removed and the animal had to remember its color (or luminance) to perform the task. When the cued feature was switched from one alternative to another in the middle of a trial the differential activation of neurons reversed over the course of 150-300 msec. If the stimulus in the receptive field contained the newly selected feature, V4 neurons became activated without a concomitant change in the stimulus in classical receptive field. Across the topographic map of V4 the activity associated with the newly selected stimuli popped out, whereas the activity of deselected stimuli faded to the background levels of other background objects. Evidence of a suppressive input from stimuli outside the classical receptive field was clear in only 3 of 24 neurons examined. Intrusion into the classical receptive field by a second stimulus resulted in a diminished difference between matching and nonmatching conditions. These physiological data suggest a major role for attentional control in the parallel processing of simple feature-selective differences. [Key words: attention, preattentiwe vision, feature selection, pop-out, visual memory, area V4]
Previous physiologicalstudieshave demonstratedthat focal attentive tasksare effective in emphasizingthe visual processing of relevant stimulus information within extrastriate area V4 (Moran and Desimone,1985;Haenny and Schiller, 1988;Haenny et al., 1988;Spitzer et al., 1988;Maunsell et al., 1991; Motter, 1993). The resultsreported in the precedingcompanion article ReceivedJune 25, 1993; revised Sept. 13, 1993; accepted Sept. 29, 1993. This work was supported by the VA Medical Researchprogram. Correspondenceshould be addressedto Brad C. Motter, ResearchService 15I, VA Medial Center, 800 Irving Avenue, Syracuse,NY I32 10. Copyright 0 1994 Society for Neuroscience 0270-6474/94/142190-10$05.00/O
SUNY Health Science Center, Syracuse,
New York
(Motter, 1994) demonstrate a second more general selective process,occurring in parallel acrossthe visual sceneand based on the selectionof a color or luminancestimulus feature. Under the conditions ofthose experimentsthe activity ofneurons within the V4 population reflected a selectionof a stimulus feature rather than a responseto the presenceof a particular physical color or luminance within the receptive field. The consequence of the feature-selective processis that on any given trial the majority of the highly activated V4 neurons preferentially representthose separatestimuli in the visual scenethat correspond to potential targets asdefined by their color or luminance. This parallel feature-attentive processmay be the physiologicalcounterpart of an attentive highlighting of locations in the visual sceneto which further focal attentive processingcanbe directed. The studiesreported here had three primary goals.The first goalwasto determinewhether the feature-selectiveprocesscould be maintained in the absenceof the visible cue. Since other studieshad shownthat V4 neuronal activity could bemodulated within a delayed match-to-sampleparadigm,even by cuesfrom nonvisual sources(Haenny et al., 1988; Maunsell et al., 199l), the designchosenexamined whether the feature-selectiveprocesscould be maintained by the memory of the cue condition. The secondgoal wasto determine whether the selectionprocess could be altered once it wasestablishedfor a particular behavioral trial. Shifts in the selection processprovide a measureof the time courseover which parallel processes can shift from one subsetof stimuli to another. The term “pop-out” is usedin this article to describethe suddenemergencethroughout the visual field of the neural representation of a set of stimuli sharing a particular feature. The third goal wasto investigate the influence of stimuli in the suppressivesurroundsof V4 neuronsupon the dischargeresponseto stimuli presentedin the classicalreceptive fields. Previous reports have found that focal attentive mechanisms govern interactions within the classic receptive field (Moran and Desimone,1985).This study wasto examinewhether the parallel mechanismsof the feature-selectiveprocesseswere specifically excluded from the classicreceptive field or the suppressive surrounds. Materials and Methods Behavioral paradigms This report describes data from two of the three behaviorally trained
Mucacamulatta monkeysthat servedassubjects in thepreceding article. Thesemonkeyswerefirsttrainedontheconditionaldiscrimination (CD)
task described below and in the preceding article (Motter, 1994). The two monkeyswerethenadditionallytrainedon two differentvariations
of the standardtask. Standard
conditional
discrimination
Each of these monorientation discrimination
paradigm.
keys was trained on a two-stage conditional
The Journal
(CD) task that required the discrimination of the orientation tilt of a bar stimulus once it was selected from a pair of stimuli based on its color or luminance. In all tasks the subjects first visually fixated a small circular fixation spot whose color or luminance provided the conditional cue for the trial. After the animals established fixation of the spot, an array of four or six stimulus bars composed of combinations of two orientations and two colors or luminances was presented. In order to study spatial interaction effectsbetween stimuli and receptive field regions, some series of studies employed additional arrays of 8, 12, or 16 stimuli. In the standard task these conditions persisted throughout the trial until the end, when the array was reduced to just two stimuli, only one of which matched the fixation cue color or luminance. At this point the subjects made an orientation discrimination of the matching color (or luminance) stimulus by pushing either a righthand button for rightward tilts of the bar stimulus or a lefthand button for leftward tilts. Memory paradigm. The first variation of the conditional discrimination paradigm was designed to require the monkey to make the final selection of the appropriate bar stimulus based on a memory of the color or luminanceof the conditional cue rather than on any possible comuarisons of stimuli in the visual field. This was accomplished by simply turning off the fixation spot part way through the trial (see Fig. 1, left). The monkeys were required to maintain fixation at the same point on the screen and make the conditional choice at the end of the trial based on the color of the fixation spot prior to its disappearance. The fixation spot was turned off either 750 or 1000 msec after the onset of the array. The array remained on for an additional 1000-l 800 msec after the fixation spot was turned off before being reduced to the final two stimuli upon which the conditional choice and discrimination was made. Cue switch paradigm. A second variation of the standard conditional discrimination paradigm was designed to alter the conditional cue color or luminance partway through the trial and thereby require the final conditional selection process to be based on information received after the array was present in the visual field. This was accomplished by switching the color or luminance of the fixation spot from one of the two alternatives to the other (see Fig. 1, right). The timing parameters were similar to those used in the memory paradigm. Simple discrimination paradigm. Prior to studying each neuron on the conditional task the neuron’s receptive field was located and mapped and the response preferences for stimulus size, color, and orientation were determined using a simpler discrimination paradigm designed to approximate the standard fixation paradigm commonly used in visual studies (Wurtz, 1969). This paradigm required the monkey to ignore peripheral stimuli while fixating a central spot until a small bar was flashed directly over the fixation spot. The monkey then made an orientation discrimination based on the small flashed bar. In addition to the standard single test and stimulus mapping of receptive fields, two or three simultaneously presented stimuli were used to assess the suppressive zones surrounding area V4 neurons.
of Neuroscience,
Memory
April
Cue
1994,
14(4)
2191
Switch
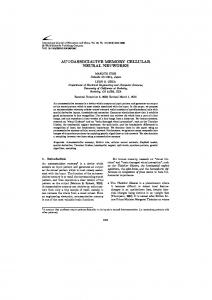
Figure 1. Behavioral paradigms. Each frame represents a field of view with the fixation spot in the center and the neuron’s receptive field indicated by the dotted circle. For either task the subject initially fixates the small fixation spot and is then presented with an array of stimuli. In the memory paradigm the fixation spot disappears 750 or 1000 msec after the array onset. The subject must remember the color ofthe fixation spot so that when the array is reduced to an unambiguous choice of two stimuli the subject can discriminate and report the orientation of the bar stimulus whose color matched that of the fixation spot. The CS paradigm is similar except that instead ofdisappearing, the fixation spot (the color cue) changes color and the subject must use this new color ‘to choose the correct bar stimulus and discriminate its orientation. M and NM conditions for both paradigms are distinguished by whether or not a color or luminance match occurs between the fixation spot and the stimulus in the receptive field. The figure is not scaled proportionately. working on the tasks or supplemented weekly holidays from the schedule.
afterwards. Animals received
Procedure Stimulus presentationand data collection Details of stimulus generation and data collection were the same as those described in the preceding companion article (Motter, 1994). Briefly, stimuli were generated on a graphics display monitor located 60 cm in front of the monkey. Stimulus timing and eye position sampling were locked to the 60 Hz frame rate of the display system. Each series of stimulus conditions was governed by a quasirandom permutation series so that trial-to-trial stimulus selection could not be predicted. The stimuli consisted ofrectangular bars ofvarious sizes, orientations, and colors presented against a background gray of 7.5 cd/m*. The fixation target was a small filled circle (0.2”). Stimulus arrays usually contained either four or six bar stimuli equally spaced along an imaginary circle centered on the fixation spot. The array was placed so that one bar stimulus was centered in the receptive field of the neuron being studied. A standard set of colors (34 cd/m*) and gray scale values was used. Each animal viewed the display monitor binocularly through an infrared reflecting mirror placed directly in front of its eyes. Eye position of the left eye was recorded with an infrared cornea1 reflection oculometer (Motter and Poggio, 1984). Steady fixation of the central fixation spot without eye blinks or eye movements to peripheral sites was required during the entire stimulus sequence. The monkeys worked daily for about 1200- 1400 trials. Correct responses were rewarded after each trial. Animals were maintained on a controlled liquid intake schedule and received their baseline amount each day either in the course of
A subset of the neurons selected for study in the previous report were also tested in the paradigms reported here. These single neurons responded well to flashed stimulus bars of various colors and luminances that were about 2.5” x 0.5” in size. The orientation, color, and luminance preferences, and receptive field location were mapped using a series of flashed stimuli under computer control. Two orientations and two colors/luminances were chosen from these results. The preferred orientation and best color stimulus were then used to redefine the edge of the receptive field nearest the fixation point and to examine the borders of the receptive field along an arc equidistant from the fixation target and passing through the receptive field center. The spacing of stimuli in the array of the conditional discrimination paradigm was then chosen so that only one stimulus would be present in the receptive field on any trial; exceptions to this statement are discussed in the Results. After all stimulus parameters were defined using the simpler discrimination paradigm, the monkey was switched to the standard conditional discrimination paradigm. Following the standard paradigm, neurons were studied while the monkey worked on either the memory or cue switch (CS) paradigms. Behavioral training, neurophysiological recording, and verification of recording sites were the same as reported in the companion article (Motter, 1994) and a previous report (Motter, 1993). All experimental protocols were approved by the Animal Care and Use Committees at the VA Medical Center and SUNY-HSC.
2192
Motter
* Neural
Correlates
of Feature
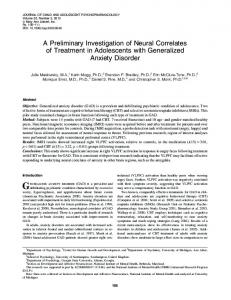
F&we 2. Responses of a V4 neuron to-the primary stimulus in both the standard CD paradigm and the memory paradigm. Raster displays of discharge activity show the difference between match (A4) and nonmatch (NM) conditions during trials for both paradigms. Stimulus array onset is marked by verticalbarson the left. In the memory paradigm removal of the fixation spot 750 msec after the array onset does not alter the differential response for either M condition. For a few neurons including this one, responses in the memory paradigm were more strongly differentiated than those in the CD paradigm.
Memory
and
Pop-Out
in V4
i Fixation
c
i
cue
removed
M’
0
I
Results Subsetsof the 109 V4 neuronsdescribedin the previous article were further studied in the several variations of the CD paradigm presentedin this article. All ofthese neuronswererecorded in the exposedportion of the prelunate gyrus within the area defined asarea V4 by Gattass et al. (1988). The receptive fields and basicstimulus responsepreferenceswere determined using stimuli presentedone at a time in the simple discrimination paradigm. Receptive field centerswere located within the range from 3” to 6” of the fovea1center. Deferential activation basedon a memory of the cue The memory paradigmprovided an assessment of whether the maintained differential responsesobserved with the CD paradigm could be sustainedby a memory of the appropriate cue color/luminance. A total of 32 V4 neuronswere studied using the memory paradigm. Each of these neurons had receptive fields centered 3-6” from the fixation spot that did not extend to include the fixation point within the receptive field. This condition was defined by locating the position of the edge of the receptive field between the fixation spot and the center of the receptive field usingstandard singlestimulus mapping procedures.Each neuron wasfirst studied in the standardCD paradigm. Figure 2 illustrates the results for one V4 neuron. The rastersin the upper part of the figure illustrate the responses under the matching (M) and nonmatching (NM) conditions of the standardCD paradigm. Within each paradigm all stimulus conditions were randomly interleaved trial by trial. Only the responsesto the primary stimulus (color, red; orientation, 45”) are shown in this figure; responsesto the other stimuli are not shown.The trials on which the receptive field stimulusmatched the conditional cue are shown in Figure 2A, and trials for the NM condition in the standardCD paradigmasshownin Figure 2B. The trials are synchronized to the onset of the array indi-
I
I
I
I
463 I
I
300
I
I
msec/div
cated by the vertical bar on the left. The responseof the neuron in the NM condition of Figure 2B is reduced compared to the M condition. The responseofthis sameneuron during the memory paradigm is shown in the lower part of Figure 2. Again, the responsesare shown for only the primary stimulus, as above, and the trials are sorted here into M and NM conditions. The secondvertical bar, 750 msecafter the onsetofthe array, denotes the time that the fixation spot wasremoved. No changeis noted in the neural activity. The activity continues to show a differential maintained responserelatedto the M and NM conditions. For someofthe neurons(seeFig. 2) the responses in the memory paradigm were more strongly differentiated than the responses in the standard CD task. Average responserates in a one second interval after the removal of the fixation spot were calculated for each condition in the memory paradigm. Average rates were obtained from a similar interval in the standard CD paradigmfor the sameneuronsand the data wereanalyzed with a two-factor ANOVA with repeated measures.The matching condition effect was significant (p < 0.00 1). Differencesbetween specificgroupswere examined with pairwise multiple comparisons.Significant differences for the M and NM conditions were present for both paradigms.The effectswere identified in individual neuronsby t test comparisons.Twenty-three of the 32 neuronstested were significantly different in the standardCD task and all 23 of these were also significantly different in the memory paradigm (p < 0.05, t test). An additional four neurons not different in the standard task were significantly different in the memory paradigm, making a total of 27 out of 32 neurons with clear differencesbetween M and NM conditions in the memory paradigm. There was also a small but significant (P < 0.01) difference in the overall ANOVA between the standard condition and the memory paradigmsthat could be attributed to slightly higher dischargerates in the standard M condition. Figure 3 summarizes the comparison between responsesin the standard para-
The Journal of Neuroscience,
April 1994, 14(4) 2193
digm and the memory paradigmin the setof 23 neuronsshowing clear differencesbetween M and NM conditions in both paradigms. The average firing rate in each condition is plotted and joined by a line for individual neurons. The NM condition is always attenuated relative to the M condition. These results indicate that a memory of the cue is sufficient to sustainthe differential neural activity. They alsooffer a further demonstration that the observed differential responsesare not due to simple stimulus-stimulus interactions between the fixation spot and the bar stimuli in the array. In contrast to this result, the presenceof a stimulus in the receptive field was an absolute requirement. If the stimulus was removed or if an errant eye movement
moved
the receptive
field away from the
stimulusthe neural activity ceasedabruptly. Therefore, the sustained responseis not a mnemonically driven but a stimulus driven activity that can be apparently gated or modulated by mnemonic processes. Effects of switching the selectedstimulusfeature: pop-out The memory paradigm demonstratedthat the cue information did not have to be presentduring the trial to sustainthe differentiated activity. It wastherefore necessaryto showwhether the sensitivity to M and NM conditions could be altered during the behavioral trial if the cuing conditions were changed.Such conditions representa more natural situation wherestimuli already present in the visual field either acquire or lose significance relative to the task at hand. Neurons were first studied in the standard CD paradigm. A secondseriesof trials using the CS paradigm wasthen begunif a differential responsein the standardCD paradigmwasevident. A total of 40 V4 neuronswere studied usingthe CS paradigm. An example of the responseof a V4 neuron in both of these paradigmsis shown in Figure 4. The receptive field stimulus is
25
0
I M
I
NM Standard Paradign
f
I
M
NM
Memory Paradigm
Figure 3. Mean discharge rates for match (M) and nonmatch (NM) conditions for 23 V4 neurons during both the standard CD paradigm and the memory paradigm. The average firing rate for each condition is joined by a line for each neuron. Discharge rates in M conditions exceeded those in NM conditions for both paradigms.
M
NM
1 C
Cue
Switched
E -
f
NM->M
a”
I
I
I
I
I
372
I 300
msec/div
Figure 4. Responses of a V4 neuron to the primary stimulus in both the standard CD paradigm and the CS paradigm. Raster displays of discharge activity show the difference between match (M) and nonmatch (NM) conditions during trials for both paradigms. Trials are sorted by condition and by trial duration. Short staggered vertical lines at the right are the times of behavioral key release at the end of the trial. Stimulusarrayonset is marked by vertical bars on the left. In the CS paradigm the M and NM conditions reverse when the cue switches at 750 msecafter array onset.The activity of the neuron also switches after a delay of about 200 msec. The response change occurs without any change in the stimulus in the classical receptive field.
2194
Matter
* Neural
Correlates
of Feature
Memory
and
Pop-Out
in V4
Receptive
field
color:
BLACK
Receptive
field
color:
BLUE
Cue
Switched
NM->M
Figure 5. Responses of a V4 neuron to both primary and secondary stimuli in the CS paradigm. For either stimulus the response pops out when an NM condition becomes an M condition (NM + A4J Likewise the response fades away when the change is from M to NM (A4 + NM). Presentation format is similar to Figure 4.
I
I
the primary stimulus (color, blue; orientation, 60”) in all cases in Figure 4. The upper pair of rastersillustrates the responseof the neuron during the M (Fig. 4A) and NM (Fig. 4B) conditions ofthe standardCD paradigm.The responsein the NM condition returns nearly completely to the low level of spontaneousbackground activity exhibited by this neuron. The lower pair of rastersillustratesthe responseof the neuron during the CS paradigm. The upper raster of the lower pair (Fig. 4C) illustrates an initially NM condition with the low level of activity seenin Figure 4B. Then, 750 msecafter the onsetof the stimulusarray, the fixation spot color is switched (from white to blue) and the responseof the neuron also switchesafter a delay to the activation pattern of responsesimilar to the M condition in the standard paradigm shown in Figure 4A. Figure 40 showsthe opposite direction of changefrom an initially M condition to an NM condition and the accompanying switch in neural activity from an activation to an attenuated response. Figure 5 showsthe activity of a secondV4 neuron during the CS paradigm neuron. This neuron was strongly selective for blueand black stimuli when testedwith 200msecflashedstimuli in the simplediscrimination paradigm. Under thoseconditions the contrast index (A - B)I(A + B) for blue versusgreen was 0.95; for blue versusred, 0.86; for black versuswhite, 0.58; and for black versusblue, 0.06. When thesetwo “colors” were used in the -CStask the neuron’s activity could be toggled on or off for either color by providing the appropriate conditional cue. Thus, changesin the cue causea dramatic shift in the neural activity in the absence of any changesin the receptive field stimulus. In a topographic map of the population activity, neurons that representthe stimuli that become selectedpop out, whereasneurons representingstimuli that become deselected fade away. As a population, the 40 neuronsstudied in the CS paradigm attained significantreversalsof their activity for either direction of cue switching. Average spike rates were calculated in a 750
I
I
I
I
I
I
I
300
I
363 I
msec/div
msec interval before the cue switch and a 750 msec interval beginning250 msecafter the cue switch. Figure 6A summarizes the activity in theseperiods. Data points for the changefrom M to NM conditions are shownasopencirclesand for the change from NM to M conditions are shown as solid circles. The data points separateinto two distinct groupsdependingupon whether there was a match to the conditional cue before (open) or after (solid) the cue switch. The data shown in Figure 6A represent the shift in neural activity that occurs, but becauseactivity was measuredat different times in the trial and becausethe overall level of activity changesduring the trial, the differencesmight be slightly overstated. Measuresof activity were therefore made betweenthe periodsafter the cueswitch and comparableperiods in the standardCD task. Thus, comparisonsweremadebetween activity
levels that would
have been present if the cue had not
switched(CD paradigm)and activity levelsafter the cueactually did switch (CS paradigm). Two setsof contrast indexes based on the paradigms(CD - CS)/(CD + CS) were calculated, one for the M to NM changeand one for the oppositechange.Figure 6B showsthe distribution of indexes for the M to NM change. The activity of all but two neuronsis depressedrelative to what it would have been at the sametime in the trial if the cue had not switched. Figure 6C showsthe distribution for the NM to M change.The activity of all but two neuronsis elevatedrelative to what it would
have been at the same time in the trial if the
cue had not switched. The neurons that failed to reach a clear difference after the cue switch did so mostly becausethey failed to change their firing substantially after a cue switch. Three neurons seemedto be directional, changing for one switch direction but not for the reverse. Time courseof feature selection The CSparadigmalsoprovided an assessment ofthe time course of the selection processwithin area V4 during a changefrom one stimulusfeature to another. Becausethe visual field stimuli
The Journal of Neuroscience,
0
20
40
Rate
60
60
Before
100
Cue
lo, B
120
NM -
M
M -+-
NM
600
800
2195
140
Switch
XJ
.-E “i
101 c
I I , I
lo-
L
6-
6-
April 1994, M(4)
2 E E?
6-
E e
0
6-
-400
~~“111’111’1’1’111’111’111’
Time 2OI
I
b
r
-1.0
-0.5
0.0
0.5
Non-Match
I
I
0.5
1.0
Match
-200
0
Relative
200
400
to the Cue
Switch
1000
(msec)
Figure 7. Timecourseof featureselection: normalizedpopulationhistograms showing the activity changes accompanying switches from match to nonmatch (A4+ NM) and nonmatch to match (NM+ A4) conditions. Dashed verticalline marks the time of the cue switch. Histograms are based on 10 msec bins. For each neuron the bin with the greatest activity across all conditions was set to 100 and the remaining bins normalized to that value. Data were then averaged across the 30 neurons. The solid line represents a 50 msecrunningaveragesmoothof the data.
activity in the CS paradigm. A,
Averagespikeratesin intervalsbeforeandafter the cueswitch.Solid circles show activity for changes of NM to M conditions; opencircles show the opposite M to NM activity changes. B and C, Distributions of the response contrastindexesfor comparisons madebetweenthe standardCD paradigmandCSparadigm.In B, the comparison shows the decrease in activity for NM conditionsafter the switch.In C, the comparisonshowsthe increasein activity for M conditionsafter the switch. were already present,including one in the receptive field of the neuron being studied, this assessment could be made without the concomitant activation associatedwith a stimulus onset. The changing patterns of responseshown in Figures 4 and 5 occur without any change in the receptive field stimulus or stimulusarray asa whole, and with only the cuing color change at the fixation spot. The time course of the change in neural activity potentially reflects the redirection of selective feature processing.To estimate this time coursea population average of the activity was made. A subsetof 30 neurons that showed the largestdifferencesin the interval after the cue switch was usedto provide a clearer picture of the temporal changes.The activity for eachcondition in each neuron was averaged in 10 msecintervals synchronized to the time of the cue switch. The responseof each neuron was normalized with respect to its highestrate and the conditions were then averaged acrossthe population of neurons.The resulting profiles of the time course of changein the CS paradigm are shownin Figure 7. The solid line representsa 50 msec running average smooth of the averagedresponsesfrom the 30 neurons. The changein activity associatedwith switch from the M to NM (M -NM) conditions is somewhatdelayed relative to the switch from the NM to M (NM -+ M) condition. The population activity change in the NM -+ M condition starts at about 150 msec,and for the M --+ NM condition at about 300 msec,after the cue is switched,The
staggereddelays suggestan interval where both (or neither) feature is selected.For comparison, response differences after the initial presentation of the array, as shown in Figure 9 of the precedingarticle (Motter, 1994), begin at about 150-200 msec after the initial presentationof the array. Thesedelaysrepresent two to three times the standard visual latency observedin area V4 and indicate that a substantialprocessinginterval isrequired for the setup of the feature-selectiveprocesses. Spatial interactions inside and outsidethe receptivefield Under conditions of directed focal attention V4 neurons have beendemonstratedto processinformation selectively within the receptive field (Moran and Desimone,1985).The generaldesign of the CD tasksusedhere wasto placeonly one stimulus in the classicalreceptive field and the remaining stimuli well outside the boundaries of the receptive field. The receptive field was determined with a singlestimulus presentedin 200 msecflashes while the monkey performed the task in the simple discrimination paradigm. To investigate the relationship of stimulus placementrelative to the boundariesofthe receptive field during the CD task, 24 neuronswere studied using8, 12, or 16 stimuli in the array in addition to the usualfour or six stimuli. For most of theseneurons attempts were also made to detect the inhibitory suppressivesurround describedfor many V4 neurons(Desimoneand Schein, 1987). Thesetestswere madewith the simple discrimination paradigm. Pairs of stimulus bars, one inside and one outside the classicalreceptive field, were flashed at locations along the imaginary arc defined by the eccentricity of the receptive field center from the fixation point. Evidence for the suppressivesurround was difficult to establish(clearly seen in only three neurons)usingthe barsthat constituted the stimuli usedin the arrays of this study. In general, increasingthe number of stimuli in the array in
2196
Motter
* Neural
B
Correlates
I
of Feature
Memory
and
Pop-Out
in V4
.
NM1
300
msec/div
Figure 8. Entry of additional array stimuli into the receptive field: discharge responses of a V4 neuron to M and NM conditions in the standard CD paradigm for arrays containing eight stimuli (4) and 16 stimuli (B). Cartoon to the left depicts inner margin of the receptive field located to the lower left of the fixation spot. Bars represent the locations of the centered receptive field stimulus and its nearest neighbors in the array. In A, the differential responses to match (M) and nonmatch (NM) conditions are clear. In B, a second bar has clearly entered the receptive field. During the M condition the response is unaltered and continues to indicate that an M condition is present. During the NM condition two types of response are evident and separated into NM1 and NM2. NM1 responses occur when the encroaching stimulus is the same color as the main receptive field stimulus: thus, neither match the conditional cue. NM2 responses occur when the encroaching stimulus is the opposite color from the main stimulus and thus’ matches the conditional cue.
had no detrimental effect on the response elicited by the singlestimulusin the receptive field until a second array stimulusencroachedupon the classicalreceptive field. The usualresult of entry into the receptive field by a secondstimulus was a greatly diminished difference between M and NM conditions, with both responsesattaining a more moderate level of sustainedactivation. In general, all stimuli used were at least moderately effective when presentedby themselvesin the receptive field. Becauseof the relatively large receptive fields of V4 neurons, and the initial centering of one stimulus in the receptive field, increasingthe number of stimuli in the array usually resulted in a symmetrical encroachment into the field from both sides.Figure 8 showsone caseof a small field that wasbracketed by stimuli in a slightly asymmetric manner. The cartoon on the left in Figure 8 depicts the inner margin of the receptive field contour line marking a 50% reduction in sensitivity from the field center. The locationsof stimuli in the arrays usedare marked by stimulus bars. Just one orientation is used in the cartoon, whereasthe flanking stimuli are randomly permuted during the experiment. The receptive field stimulus(more or lesscentered in the field) is located to the lower left of the fixation target, at an eccentricity of about 4” of visual angle.The responses of the neuron to the M and NM conditions are shown in the rasters to the right for arrays of eight (upper) and 16 (lower) stimuli. Only responsesto the primary stimulus (color, blue; orientation, 50”) are shown; the alternate color (red) was comparable in eliciting a response.With eight stimuli in the array (Fig. 8A) the responsesto M and NM are clearly differthe CD paradigm
entiated. Arrays of 16 stimuli, however, result in the flanking stimulus on the right being positioned in the central part of the receptive field, as indicated by the 50% line in Figure 8. Nevertheless,when the primary receptive field stimulusmatchesthe conditional cue (Fig. 8R, M) the responseremainsintact. However, in the NM condition two different responsescan be distinguishedand are separatedin Figure 8B into NM 1 and NM2. In NM1 the encroachingstimulus was an NM stimulusas was the receptive field stimulus,and the elicited responsewassimilar to other NM conditions. In NM2 the encroachingstimuluswas the optimally oriented stimulus of the opposite color (in this case,red) and therefore the secondstimulus matched the conditional cue. This stimuluscombination produceda maintained response,presumably becausethere was in fact an optimally oriented color matching stimulus (the red one) in the receptive field. Given theseresults it seemsreasonablethat a mixture of several stimuli in the receptive field may produce overall intermediate activations similar to thoseobservedin the majority of the neurons testedwith larger array sizes. A different observation wasmade in three of the 24 neurons; the most striking example is shown in Figure 9. In this case, increasingthe array from four to eight stimuli resulted in the placementofan array stimulusinto an apparentinhibitory zone. When the encroachingstimulusenteredthe inhibitory zone, the maintained M responsewas suppressedor occluded. The NM response,however, is not affected in the samemannerand appears to be, if anything,
more evenly activated.
This latter ob-
servation suggests the possibility of multiple mechanismsin the
The Journal
control of the feature-selection effect. A permuted selection of array stimuli was used in all of these experiments so that the stimulus in the suppressive zone was varied from trial to trial. This particular neuron, however, was not orientation sensitive and the color pairs were equally effective in driving the neuron. Excitatory or inhibitory subfields were not observed in these studies and V4 classical receptive fields are generally reported as homogeneous (Desimone and Schein, 1987). Therefore, the observed inhibitory zones are interpreted as being part of the suppressive surround. As expected, the engagement of these surrounds clearly alters the response patterns seen in the CD paradigm. Discussion The results of the present studies indicate that the feature-selective processing that occurs in extrastriate area V4 can be sustained by the memory of the relevant cue. The observed feature-selective differences in neuronal activity therefore cannot simply reflect a differential processing of the physical features ofthe visual scene as they exist but reveal an active control process based on an implied goal. Neurons in several areas in inferior temporal cortex have been shown to maintain their discharge activity during delay periods in visual memory tasks (Fuster and Jervey, 1982; Miyashita and Chang, 1988). The discharge of such neurons, especially those in more anterior inferior temporal areas, was selective for particular sets of stimulus features that the monkey had to remember during such delays. The presence of clear anatomical connections between V4 and inferior temporal cortex suggests one avenue by which mnemonic representations of the cue information can gain access to V4. The present studies further show that even after the selective processing has been established, the control remains dynamic and can be switched from one feature to another during the course of a behavioral trial. Changing the selected feature results in a dramatic change in area V4. Neurons with the newly selected feature in their receptive fields suddenly become activated without a concomitant change in the stimulus in their classical receptive fields. Across the topographic map of V4 the activity of the newly selected targets pops out, whereas the deselected targets fade to the background levels of all other background objects. The time required to switch selection from one feature to another is appreciably longer than the amount of time it takes for visual information to arrive initialiy in area V4. Fischer and Both (198 1, 1985) reported a reactivation of neural activity in a suppressed saccadic eye movement task when the fixation target disappeared and the monkeys were free to make an eye movement to a peripheral target in the neuron’s receptive field. Because in their paradigms the reactivation was associated with the release of the fixation requirement at the central target, and could not be conclusively demonstrated in a peripheral attention task, they concluded the reactivation was due to a change in visual sensitivity related to the active state of fixation. While these observations are similar to the pop-out changes seen in the CS paradigm, they are also compatible with the Fischer and Both (1985) proposal in that they represent a shift in directed focal attention. One clear difference between those studies and the present one is their report that the reactivation activity faded with prolonged training of 3-5 weeks. The monkeys in the present experiments were trained for 4-6 months before recording began. Are the feature-selective effects observed in the present study
of Neuroscience,
4 Stimuli
in
8 Stimuli
in array
April
1994.
74(4)
2197
array
356 I
I
I
I
I
I
I
300
I
I
I
msec/div
9. Entry of array stimuli into suppressive zones: discharge responses of a V4 neuron to M and NM conditions in the standard CD paradigm for arrays containing four and eight stimuli. In the upper raster pair the responses are clearly differentiated for matching (A4) and nonmatching (NM) conditions. Increasing the number of stimuli in the array to eight apparently placed one (or two) stimuli into a suppressive surround with the resulting clear effect of shutting off the response to the M condition.
Figure
basedon feedforward control systemsthat separateor group objects on the basisof elemental differencesin physical properties?For example, simple texture segmentationdependson a bottom-up processingbuilt on the evaluation of local differences in luminance contrast or orientation contrast and is sensitively dependent upon the texture gradient (Nothdurft, 1985; Landy and Bergen, 1991). The properties of feedforward systemsmay in fact explain the rapid, effortless,preattentive discriminations of texture areashaving suitable differencesin luminance or orientation contrast. Such systemsappear to be the physiological basis for the control of texture segmentation
based on luminance
(Nothdurft and Li, 1985) or orientation differences(Nothdurft, 1991; Knierim and Van Essen, 1992). Some of the properties of feature selectionobservedin the presentstudies,for example, cue-dependentdifferential activation and continued differentiation in the absenceof a cuestimulus,are not readily compatible with feedforward explanations. The observedproperties suggest a feedback control system. Many of the V4 neurons studied respondedto a reasonably wide band of colors and luminances. In the conditional paradigms there were no clear limits; essentially any mixture, including the two best “colors,” could be paired and differential driving could be obtained. This differential activation implies that the control system is able to shut down effectively the synaptic impact of all but one of many “color” inputs. The difficulty in organizing a feedback systemwith such specificity, particularly one that may be using a memory or a nonvisual source(Haenny et al., 1988) suggests that what is beingselected may not be a particular color but insteada particular relationship of the selectedcolor to other color features in general. Essentiallythis is a restatementof the observation that the pat-
2199
Motter
* Neural
Correlates
of Feature
Memory
and
Pop-Out
in V4
tern of activity during the CD paradigm segments the scene into two maps, potential targets and background objects. The basis for segmentation may be color, as it would seem to be in this case, or alternatively it may be that the color values or differences are themselves simply a reflection of a more generalized comparator system, such as suggested by the lesion study of Schiller and Lee (199 1) or the psychophysical studies of Treisman and Gormican (1988). A comparator role for V4 neurons, comparing activity in the classical receptive field with that in the suppressive surround, has already been proposed as a means to solve color constancy problems (Schein and Desimone, 1990). Extension of these ideas to a larger arena, including form (Desimone and Schein, 1987) and motion (Allman et al., 1985) but retaining the basic comparison between the classical receptive field versus peripheral surround, might provide a mechanism whereupon feedback could then select a particular relationship or ratio of activity. The term “pop-out” is used in this article to describe the parallel emergence of the neural representation of a set of stimuli sharing a particular feature. The term is used to emphasize the similarities between the parallel processing described here for neural processes and those posed in the psychophysical descriptions of visual behavior under similar conditions. In psychophysical contexts the pop-out phenomenon is usually described in association with the capturing of attention by an object with a particularly distinctive or unique feature. The detection process for such an object appears to work in parallel across a scene or set of objects. Objects that have no particularly conspicuous feature or are distinct only by particular combinations of features require a slower process for detection that appears to use a serial examination ofeach object. Wolfe et al. (1989) suggested that these two processes work together with the parallel process identifying a limited set of objects that serial process can then examine. The parallel process in this scenario is a potential match with the feature-selective process described in this article. If these processes are related, however, the neural data indicate a major role for attentional control in early parallel visual processes that is contrary to current psychophysical models. Are there interactions between stimuli in the suppressive surround and the classical receptive field in the CD paradigm? While it was easy to confirm the rich set of interactions for length and width selectivity within the classical receptive field reported by Desimone and Schein (1987), confirmation of the suppressive surrounds was surprisingly more difficult. In the anesthetized, paralyzed animal the surround fields in area V4 are bilateral and quite large, extending 15” or more from the classical receptive field (Schein and Desimone, 1990; Desimone et al., 1993). On the basis of size alone, most if not all of the array stimuli in the CD paradigm should have been located within the boundaries ofthe surround field. Yet using the simple discrimination paradigm there were only a few cases where multiple stimuli produced a suppressive effect relative to single stimuli, and then it was from sites immediately adjacent to the classical field. In the CD task increasing the number of stimuli in the array did not appear to produce changes until the additional stimuli encroached upon the classical receptive field. During the CD task the activity was generally greater in the M condition and less in NM condition than the activity observed in response to single stimuli. The influence of the surround would therefore seem to be something other than a simple center-surround weighting. Other possibilities are that the surround stimuli were too small relative to the size of the surround or
that the mixture of multiple stimuli within the surround canceled out the suppressive effects. It is also possible that the surround interactions in V4 are different in the awake behaving animal. What is occurring during the presentation of the array in the CD paradigm, and is the observed feature-selective process a focal attentive process? One possibility is that during this period the monkey is scanning the different stimuli in the array with a focal attentive mechanism while fixating the central spot. However, the discharge activity for the M condition maintains a constant level of activity without any major interruptions, as would be expected if the process resulted from a serial scan of the different stimuli. The consistent differences in the initial responses of many neurons to the matching conditions are also not compatible with a probabilistic selection of the one stimulus in the array that happens to be in the receptive field on each trial. The CS paradigm illustrates that selection changes can occur during the trial, but the changes require a considerable amount of time to occur, about an order of magnitude longer than the focal attentive scanning times of psychophysical experiments for such simple color feature differences (Treisman and Gelade, 1980; Krose and Julesz, 1989). The feature-selective process appears to be a relatively slow, parallel process that is not automatic in the sense of the preattentive processes discussed above in relation to texture discriminations. The result of this process in V4 is an activity biased map of the potential targets for the conditional task. These conditions bear a striking resemblance to the “saliency map” posed by Koch and Ullman (1985). In their model of attentive processes the saliency map brought together information from several feature maps to produce a single map of conspicuous items. A spatially restricted selection process was then used to read out information from the saliency map to a central representation. The spatially restrictive, focal attentive process reported by Moran and Desimone (1985) in V4 offers a second interesting parallel to the model. However, whether the feature-selective processes in V4 can be extended to features other than color and luminance remains to be demonstrated. The feature-selective processes described in these experiments indicate that in area V4 visual processing attains a level beyond the basic description of the physical properties of the visual scene. The CD paradigm appears to provide a window onto the processes that precede focal attention and highlight specific stimuli for further consideration at various locations. The featureselective process can dynamically change the V4 topographic map of activity from moment to moment, causing the representations of stimuli to pop out or fade away as the relevance of different stimulus features change. Furthermore, the differentiation of stimuli can be based on the memory of relevant cues. Clearly what has begun to emerge is a view that visual processing within V4 is concerned not just with an object’s stimulus features, but also with selective processes that weigh the similarities and differences between objects and the goals of visual search. References Allman J, Miezin F, McGuinness E (1985) Stimulus specific responses from beyond the classical receptive field: neurophysiological mechanisms for local-global comparisons in visual neurons. Annu Rev Neurosci 8:407430. Desimone R, Schein S (1987) Visual properties of neurons in area V4 ofthe macaque: sensitivity to stimulus form. J Neurophysiol57:835868.
The Journal
Desimone R, Moran J, Schein SJ, Mishkin M (1993) A role for the corpus callosum in visual area V4 of the macaque. Vis Neurosci 10: 159-171. Fischer B, Both R (198 1) Selection ofvisual targets activates prelunate cortical cells in trained rhesus monkey, Exp Brain Res 41:431-433. Fischer B, Both R (1985) Peripheral attention versus central fixation: modulation of the visual activity of prelunate cortical cells of the rhesus monkey. Exp Brain Res 345: 11 l-l 23. Fuster JM, Jervey JP (1982) Neuronal firing in the inferotemporal cortex of the monkey in a visual memory task. J Neurosci 2:361375. Gattass R, Sousa APB, Gross CG (1988) Visuotopic organization and extent of V3 and V4 of the macaque. J Neurosci 8: 183 l-l 845. Haenny PE, Schiller PH (1988) State dependent activity in monkey visual cortex. I. Single cell activity in Vl and V4 on visual tasks. Exp Brain Res 69~225-244. Haenny PE, Maunsell JHR, Schiller PH (1988) State dependent activity in monkey visual cortex. II. Retinal and extraretinal factors in V4. Exp Brain Res 691245-259. Knierim JJ, Van Essen DC (1992) Neuronal responses to static texture patterns in area Vl of the alert macaque monkey. J Neurophysio167: 96 l-980. Koch C, Ullman S (1985) Shifts in selective visual attention: towards the underlying neural circuitry. Hum Neurobiol 4:2 19-227. Krose BJA, Julesz B (1989) The control and speed of shifts of attention. Vision Res 29: 1607-l 6 19. Landy MS, Bergen JR (1991) Texture segregation and orientation gradient. Vision Res 3 1:679-69 1. Maunsell JHR, Sclar G, Nealey TA, DePriest DD (199 1) Extraretinal representations in area V4 in the macaque monkey. Vis Neurosci 7~561-573. Miyashita Y, Chang HS (1988) Neuronal correlate of pictorial shortterm memory in the primate temporal cortex. Nature 33 1:68-70.
of Neuroscience,
April
1994,
M(4)
2199
Moran J, Desimone R (1985) Selective attention gates visual processing in the extrastriate cortex. Science 229:782-784. Motter BC (1993) Focal attention produces spatially selective processing in visual cortical areas Vl, V2 and V4 in the presence of competing stimuli. J Neurophysiol 70:909-9 19. Motter BC (1994) Neural correlates of attentive selection for color or luminance in extrastriate area V4. J Neurosci 14:2 178-2 189. Motter BC, Poggio GF (1984) Binocular fixation in the rhesus monkey: spatial and temporal characteristics. Exp Brain Res 54:304-3 14. Nothdurft HC (1985) Sensitivity for structure gradient in texture discrimination tasks. Vision Res 25: 1957-1968. Nothdurft HC (1991) Texture segmentation and pop-out from orientation contrast. Vision Res 31:1073-1078. Nothdurft HC. Li CY (1985) Texture discrimination: representation of orientation and luminance differences in cells of the cat striate cortex. Vision Res 25:99-l 13. Schein SJ, Desimone R (1990) Spectral properties of V4 neurons in the macaque. J Neurosci 10:3369-3389. Schiller PH, Lee K (1991) The role of the primate extrastriate area V4 in vision. Science 251:1251-1253. Spitzer H, Desimone R, Moran J (1988) Increased attention enhances both behavioral and neuronal performance. Science 240:338-340. Treisman A, Gelade G (1980) A feature integration theory of attention. Cognit Psycho1 12:97-l 36. Treisman A, Gormican S (1988) Feature analysis in early vision: evidence form search asymmetries. Psycho1 Rev 95: 15-48. Wolfe JM, Cave KR, Franzel SL (1989) Guided search: an alternative to the feature integration model for visual search. J Exp Psycho1 [Hum Percept] 15:419-433. Wurtz RH (1969) Visual receptive fields of striate cortex neurons in awake monkeys. J Neurophysiol 32:727-742.