curacy of the clustering results using the confusion matrix. [14]. First we .... stability bounds for multiclass classification,â arXiv preprint arXiv:1202.6221, 2012.
Neural Spike Representation Using Cepstrum Sherif Haggag, Shady Mohamed, Asim Bhatti, Hussein Haggag and Saeid Nahavandi Centre for Intelligent Systems Research Deakin University, Australia Abstract—Neural spikes define the human brain function. An accurate extraction of spike features leads to better understanding of brain functionality. The main challenge of feature extraction is to mitigate the effect of strong background noises. To address this problem, we introduce a new feature representation for neural spikes based on Cepstrum of multichannel recordings. Simulation results indicated that the proposed method is more robust than the existing Haar wavelet method.
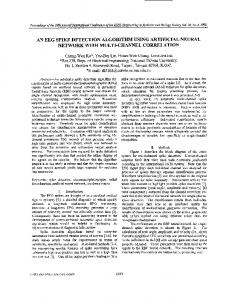
I. I NTRODUCTION Human brain is a highly sophisticated organ. It contains millions of neurons [1], which communicate with each other by firing a voltage called action potentials (spikes) [2]. A micro-electrode is used to record the voltage of those action potentials within a specific region [3]. With signals recorded by the micro-electrode, neurophysiologist can understand the behavior of the brain better by sorting the spikes and identifying their relevant neurons [4] [5]. The steps shown in Figure 1 have been followed in order to sort the neural spikes. The first step is feature detection using different types of thresholds, then extract the spike features in which spikes are represented by a set of features, these features can differentiate between spikes from different neurons. Some dimensionality reduction are applied on the features in which feature coefficients which can highly differentiate between spikes are determined and saved for processing while the rest are discarded. Finally,the process that is referred to as clustering or sorting [7] where spikes are divided into different clusters, corresponding to different neurons, based on the feature coefficients that was extracted in the feature extraction step [6]. Extracting the features is the most important part in these steps as the spikes are convoluted with noise and it is not easy to extract distinguishable features. Moreover, it is important to reduce the number of features, if too many unnecessary features are extracted, to reduce computation burdens for real-time applications.
Principal Component Analysis (PCA) has been proposed to extract the more dominant features [7] [8]. It expresses the spikes similarities and differences by calculating the sample maximum correlation and variance [9]. Satisfied results can be achieved by PCA-based methods when spikes are not heavily polluted by background noises. However, the performance of these methods will degrade significantly when low signal to noise ratio (SNR), closely shaped and overlapped spikes occur. In [10], the Haar wavelet was utilized to detect spikes from noisy data and satisfied results were achieved for a limited dataset. The idea of utilizing Haar basis is inspired by the fact that Haar wavelet is not continuous, and therefore not differentiable. Hence, it can be used for detecting signals with sudden transitions such as neuron spikes. In addition, the phase information of the signal, an important feature of neuron spikes, is not explored in this method, as the Haar wavelet only considers the time-domain information. Moreover, computing the Haar basis is a time consuming job. Hence, a large computational burden cannot be avoided. These disadvantages prevent the wide application of the wavelet-based method for a large dataset in real time. In this paper, we use Cepstrum to represent spikes of a noisy signal. Cepstrum is the Inverse Fourier transform (IFT) of the logarithm of the estimated spectrum of a signal. The idea behind representing the spikes using Cepstrum is not only holding information about magnitude but also it selects more meaningful features from noisy signals. Moreover, the number of the extracted features is very small compared to other methods that lead to less computation. So for these reasons Cepstrum gives better performance, more efficient spike sorting and less computation time. II. M ETHODOLOGY A multielectrode array system is used to record the neural spikes. Thresholding is applied on this data to detect the spikes. There are a lot of methods used to select a threshold for the data [11] [12], the most popular (accurate) method is the dynamic thresholding as shown in the following equations (1) and (2) [10] where the threshold changes depending on the input data. Thr = 4σn � σn = median
Fig. 1: The signal processing steps used to obtain single unit activity.
|x| 0.6745
(1) � (2)
where σn is the background noise standard deviation and x is the bandpass filtered signal.
X[k]
x[n]
DFT
log
Algorithm 1 Calculate spike and cluster matching correctness.
ˆ X[k] IDFT
c[n]
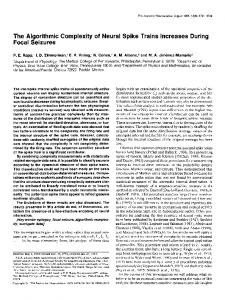
Fig. 2: Cepstrum representation is defined as the inverse DFT of the log magnitude of the DFT of a signal. Suppose a signal x is convoluted with noise n in the time domain, Cepstrum first calculates the DFT of the convolution in the time domain (x(t) ∗ n(t)) which leads to multiplication in the frequency domain (x(w) × n(w)). Then it calculates the log magnitude of the multiplication that gives (log(x(w)) + log(n(w)). At the end it calculates the inverse DFT for the log magnitude that returns it to the time domain. So in these steps Cepstrum converts the convolution to addition, which leads to a better representation.
The next step is extracting the spike features. This is the most important step because clustering the spikes (spike sorting) depends on the accuracy of the extracted features. So extracting the most dominant and invariant features that are insensitive to noise will improve the performance of neural spikes classification. Cepstrum is computed as in equation (3): c[n] = IDF T {log|DF T {x[n]}|}
(3)
Cepstrum feature vector of a signal is computed as in equation (4):
c[n] =
N −1 X n=0
! −1 NX 2π kn −j 2π log x[n]e N e−j N kn x
(4)
Require: RealS and RealC are known. Also GenS and GenC are calculated. Output: MappedRealtoGenClassRatio. i=0 while GenS[i] 6= null do MinDiff = 1000 j=0 while RealS[j] 6= null do TimeDiff = |RealS[i].DTime − GenS[i].DTime| if TimeDiff