3245
The Journal of Experimental Biology 201, 3245–3256 (1998) Printed in Great Britain © The Company of Biologists Limited 1998 JEB1631
NEUROMUSCULAR CONTROL OF ANGUILLIFORM LOCOMOTION: PATTERNS OF RED AND WHITE MUSCLE ACTIVITY DURING SWIMMING IN THE AMERICAN EEL ANGUILLA ROSTRATA GARY B. GILLIS* Department of Ecology and Evolutionary Biology, University of California, Irvine, CA 92697, USA *Present address: Concord Field Station, Harvard University, Old Causeway Road, Bedford, MA 01730, USA (e-mail:
[email protected])
Accepted 7 September; published on WWW 10 November 1998 Summary generated by posterior muscles. As speed increases, more Two areas that have received substantial attention in anterior muscles are additionally recruited. investigations of muscle activity during fish swimming are Electromyogram (EMG) burst durations typically occupy (1) patterns of fiber type recruitment with swimming speed between 0.2 and 0.3 undulatory cycles, irrespective of speed and (2) the timing of muscle activation in relation to muscle or position. EMG burst intensity increases significantly strain. Currently, very little is known about either of these with swimming speed. The onset of EMG activity typically areas in eels, which represent an extreme body form among occurred near the end of muscle lengthening, whereas the fishes and utilize a mode of locomotion found at one end of offset of EMG activity occurred during shortening the undulatory spectrum (anguilliform locomotion). To (typically before the muscle’s return to resting length). assess how this swimming mode and body form influence There was a significant shift in red muscle onset times such the neuromuscular control of swimming, I recorded that anterior muscles were typically active later in their electromyographic data from red and white muscle at four strain cycle than posterior muscles. When red muscle positions, 0.3L, 0.45L, 0.6L and 0.75L, where L is body activity patterns across various fish taxa are compared, length, in eels (Anguilla rostrata) simultaneously videodifferences in propulsive wavelength among species are taped (250 fields s−1) swimming at three speeds, 0.5, 0.75 related to differences in muscle activity, providing insight and 1.0 L s−1. As in other fish, exclusively red muscle is used into the underlying neuromuscular bases of differences at slow swimming speeds and white muscle is additionally among undulatory swimming modes. recruited at higher swimming speeds. However, this study also revealed a novel posterior-to-anterior pattern of muscle recruitment with increasing swimming speed. At slow speeds, anteriorly located muscles are never active, Key words: locomotion, swimming, muscle, EMG, behaviour, eel, Anguilla rostrata. muscle strain is negligible and forward thrust must be Introduction The axial undulatory movements used by many fish to propel themselves through the aquatic environment have been of interest to scientists for hundreds of years. As a result, general patterns of swimming movements from fish representing a diversity of taxa, shapes and sizes have been described and categorized (Breder, 1926; Bainbridge, 1963; Webb, 1975; Videler, 1993). However, it is only within the last few decades that the underlying patterns of muscle activity used to generate these swimming movements have begun to be described and understood. Two areas that have received substantial attention with regard to patterns of muscle activity during fish swimming are (1) the relationship between muscle fiber type recruitment and swimming speed, and (2) the timing of muscle activity relative to the in vivo strain cycles undergone by axial muscle fibers during swimming. Most fish possess at least two distinct muscle fiber types within their axial musculature. Typically a narrow wedge of
red, slow oxidative muscle fibers extends longitudinally just beneath the skin, usually along the path of the lateral line down the length of the body. Additionally, there are the larger, white, fast glycolytic fibers, organized in a complex manner within the serially arranged myomeres and making up the majority of the musculature of the fish. Intramuscular recordings made from phylogenetically diverse fish generating undulatory movements under spinalized (Bone, 1966) and normal (Johnston et al. 1977; Brill and Dizon, 1979; Freadman, 1979; Rome et al. 1984; Jayne and Lauder, 1994) conditions have shown that the red muscle is active during steady, slow- to medium-speed swimming, while the white muscle is recruited for more vigorous, high-speed swimming. Thus, many fish use only a small portion of their muscle mass (red muscle) to power slower swimming behaviors and recruit the bulk of their musculature (white muscle) only in circumstances when high velocities or accelerations are required.
3246 G. B. GILLIS More recently, studies have correlated the timing of axial muscle activity with undulatory movements of the fish to identify the functional roles of the axial musculature during swimming (Williams et al. 1989; van Leeuwen et al. 1990; Rome et al. 1993; Wardle and Videler, 1993; Jayne and Lauder, 1995a; Wardle et al. 1995; Long, 1998). Determining the timing of muscle activity relative to the cyclic lengthening and shortening of muscle fibers during swimming is important because the amount of force and power generated by fish axial musculature depends not only on the cross-sectional area of the muscle but also upon when, how quickly and over what distance it contracts during the strain cycle (Altringham and Johnston, 1990). Along the length of a fish, longitudinal variation is possible in several parameters integral to axial muscle function. First, the degree and rate of axial muscle shortening can change along the length of the body (Hess and Videler, 1984; Rome et al. 1990, 1993; Jayne and Lauder, 1995b; Coughlin et al. 1996). Second, the timing of muscle activity relative to its strain cycle can shift along the body because the traveling wave of muscle activation travels faster than the mechanical wave of bending it creates (e.g. Williams et al. 1989). Third, the duration of electromyogram (EMG) bursts commonly changes with longitudinal position, decreasing from rostral to caudal myomeres (e.g. van Leeuwen et al. 1990; Wardle and Videler, 1993). Finally, the contractile properties of axial muscles may vary longitudinally, typically slowing in their rate of force production and relaxation posteriorly (Altringham et al. 1993; Rome et al. 1993; Davies et al. 1995). Amidst this framework of longitudinal variation in muscle function, two hypotheses have been proposed to explain the roles of axial musculature during swimming in fish. One, set forth by Altringham et al. (1993) and corroborated by data from van Leeuwen et al. (1990) and Wardle and Videler (1993), proposes that the bulk of the power required to propel the fish forward is generated in rostrally located muscles, which are active largely while shortening, and that this power is then transmitted to the animal’s tail via the caudal musculature, which is active for a greater proportion of time during lengthening. The second hypothesis, proposed by Rome et al. (1993) and corroborated by data from Johnson et al. (1994) and Jayne and Lauder (1995a), suggests that fish power swimming largely via caudally located musculature. According to this hypothesis, anterior muscles do generate positive power, but it is relatively small because of the reduced muscle strain at anterior sites. Posterior muscles, however, despite spending a larger proportion of their time actively lengthening (performing negative work), have much greater strain amplitudes and generate more positive power during the time when they are actively shortening. While patterns of longitudinal variation in muscle function are almost sure to vary among fish species, it would be interesting to know whether such variation were related to some aspect of the phylogenetic history, morphology and/or ecology of a species. In a recent review on muscle function during fish swimming, Wardle et al. (1995) hypothesized that
certain differences in body form and swimming mode among fish species can be related to how the axial muscles are used to generate power for swimming. Specifically, muscle function should shift along the body from head to tail in fish that possess a caudal fin because the generation and transmission of locomotor power are occurring at different longitudinal locations. In contrast, in fish lacking a caudal fin, muscle function should be similar along the length of the body, because most parts of the body are presumed to be used in a similar manner in generating and transmitting thrust forces to the external environment. To test this hypothesis and to investigate the patterns of muscle activity used during anguilliform locomotion, I examined the patterns of movement and underlying muscle activity used by eels during steady swimming at a variety of speeds. Some EMG data have been presented previously from swimming eels (Grillner and Kashin, 1976); however, data on how red versus white muscle are differentially recruited with changes in swimming speed are still lacking. In addition, data on the timing of muscle activity relative to the cyclical lengthening and shortening phases undergone by muscle fibers at different longitudinal positions are necessary to determine whether, and in what ways, the extreme morphology and swimming mode of the eel affect the function of its axial musculature during swimming. Materials and methods Animals Eels [Anguilla rostrata, 37–42 cm total length (L), mean 39.6 cm, N=6] were obtained from commercial suppliers. All animals were housed individually in 40 l aquaria with pieces of polyvinylchloride tubing provided for hiding during daylight hours. Eels were fed a maintenance diet of earthworms (Lumbricus sp.) twice weekly. Water temperature within the aquaria was kept at 19.5±1.5 °C, and a 12 h:12 h light:dark photoperiod was maintained within the aquarium room. Surgical procedures Eels were anesthetized using a buffered solution of tricaine methanesulfonate (MS-222) at a concentration of 0.45 g l−1. For surgery, eels were then moved into a shallow tray (42 cm×37 cm×7 cm) filled with 1.5 l of fresh water and 2.5 l of the anesthetic solution. Every 15 min, throughout the surgery, eel gills were perfused with the water from this tray via tubing attached to a pump and inserted in the animal’s mouth. Surgery began with the implantation of five 4-0 gauge black braided silk sutures into the eel. One suture was placed just anterior to the origin of the dorsal fin (approximately 0.35L) and was used as the point to which all electrode wires were anchored before leaving the body in a glued cable. The other four sutures were placed at 0.68L and 0.53L bilaterally at the base of the dorsal fin. These sutures were used to anchor electrode wires implanted along the latter half of the animal close to the body to help prevent them from being dislodged.
Muscle activity during eel swimming 3247 Table 1. Locations (as a proportion of total length, L) of red muscle implants from which EMG activity was recorded Implant location (L)
Eel 1 L
0.3 0.45 0.6 0.75
Eel 2 R
L
0.41 0.61 0.77
Eel 3 R
L
Eel 4 R
L
0.57
0.43 0.58
0.44 0.73
0.59 0.74
Eel 5 R
L
Eel 6 R
0.26 0.42 0.73
L
R
Mean
0.56 0.75
0.28 0.42 0.58 0.74
0.3 0.60 0.75
0.59 0.74
Note that empty cells represent either sites from which electrodes were dislodged during an experiment or sites from which EMG signals were not recorded because of a lack of muscle activity, faulty implantation (for example, dissection confirmed that the electrode was actually implanted too deep, into the white muscle) or poor electrode design. L, left; R, right side of the eel.
Two insulated, stainless-steel wires were used to make each bipolar electrode for recording EMG signals from axial muscles during swimming (Loeb and Gans, 1986). EMG wires were threaded through the barrel of a hypodermic needle (26 gauge 5/8), then glued together at one end using cyanoacrylate glue. The tips of the wires (0.5 mm) at the glued end of the electrode were stripped of insulation, spread 0.5–1.0 mm apart and bent to form a fishhook-like structure which was then pulled back and nestled into the tip of the barrel of the hypodermic needle. Using these hypodermic needles, EMG electrodes were implanted at four longitudinal positions (0.3L, 0.45L, 0.6L and 0.75L posterior to the snout; see Tables 1 and 2 for precise longitudinal locations) in the red muscle bilaterally, and in the white muscle unilaterally (typically on the left side). Electrodes in red muscle were inserted superficially, whereas those in white muscle were inserted to a depth approximately midway between the skin and the vertebral column. Owing to their superficial implantation, the electrodes in red muscle were more likely to be pulled out; hence, twice as many electrodes were implanted in red muscle at each longitudinal position. All electrodes on one side of the body were then bundled together, sutured to the anterior margin of the dorsal fin and then glued together to form a single cable. After all the electrodes from the other side of the body had been sutured Table 2. Locations (as a proportion of total length, L) of white muscle implants from which EMG activity was obtained Implant location (L) 0.3 0.45 0.6 0.75
Eel 1
0.75
Eel 2
Eel 3
0.73
0.44 0.57 0.77
Eel 4
Eel 6
Mean
0.58 0.73
0.38 0.55 0.71
0.41 0.57 0.74
Note that empty cells represent either sites from which electrodes were dislodged during an experiment or sites at which EMG signals were not recorded successfully. No white muscle activity was ever recorded from sites at 0.3L or from individual 5 between 0.5 and 1.0 L s−1.
and glued into a single cable, the two cables from each side of the body were glued together to form one large cable originating at the start of the dorsal fin. Animals were then transferred into a container filled with fresh water until they revived from the anesthesic (10–15 min). Swimming trials Once eels had revived from the anesthetic, they were transferred into the flow tank (working section 28 cm×28 cm× 78 cm) and allowed to recover for several hours before the swimming trials were initiated. During this time, the unglued wire tips from all twelve electrodes were connected to Grass (model P511) preamplifiers with a 60 Hz notch filter and a bandpass of 100–3000 Hz. Analog EMG signals were amplified 10 000 times and recorded onto tape via a TEAC XR 5000 cassette data recorder and later converted to digital signals for analysis. EMG data were collected from eels swimming steadily at three speeds (0.5, 0.75 and 1.0 L s−1). NAC HSV 500 highspeed video recordings of the ventral view of swimming eels were collected simultaneously with EMG data. Patterns of muscle activity and undulatory movements were synchronized using a synchronizing pulse signal recorded onto both the TEAC (EMG data) and NAC (video data) tapes. Swimming sequences at each speed consisted of 5–16 consecutive tailbeat cycles during which the animal was moving steadily at the desired speed ±5 % (see Table 3 for sample sizes). The longitudinal position of electrodes was verified after the swimming trials via X-ray or was estimated in the case of one individual that had pulled out most of its electrodes at the end of the experiment from the location of electrode insertion marks observable as holes in the skin under a light microscope (Tables 1, 2). Video analysis Using a custom-designed kinematic analysis program described by Jayne and Lauder (1993, 1995b) and Gillis (1997, 1998), the temporal patterns of intervertebral flexion from five individuals swimming at 0.75 and 1.0 L s−1 were determined for muscle sites from which EMG activity was recorded. Briefly, outlines of eels were digitized from 12 video images per undulatory cycle, evenly spaced in time. Eel midlines were calculated from these digitized outlines and then divided into
3248 G. B. GILLIS Table 3. Number of cycles from which data were collected for each eel at each swimming speed Swimming speed (L s−1) Individual
0.5
0.75
1.0
1 2 3 4 5 6
5 14 8 8 11 10
11 9 16 10 14 18
5 8 4 8 10 8
Mean
9.3
13
7.2
L, total body length.
segments representing the axial skeleton of the animal via Xray measurements. Once electrode locations had been identified, the flexural excursions of the intervertebral joints closest to these locations were calculated. Intervertebral flexion at a site was used as a correlate of muscle fiber length (for example, if a joint is flexed maximally concave to the left, muscles on the right side of the joint will be at their maximum length, while muscles on the left side will be at their minimum length). Thus, for the two highest speeds, the timing of EMG activity at a given site was determined relative to estimations of muscle fiber length at the joint closest to that site. Data analysis Analog EMG data on TEAC tapes were converted to digital data using a Keithley analog-to-digital converter sampling at 8000 Hz. Digital EMG data from each swimming sequence were then filtered using a finite impulse response filter to eliminate extraneous signals below 100 Hz and above 3000 Hz not eliminated by the preamplifiers. EMG data were analyzed on a personal computer using custom-designed software. By examining EMG profiles visually on the computer monitor, the onset and offset times of each EMG burst were located and digitized. The computer program then calculated the duration (DUR; in s) and rectified area (AREA; in mV s) of the burst. EMG burst duration from each cycle was converted into a proportion of the undulatory cycle time (DUR/CYC). Cycle duration (CYC) was calculated as the time between sequential onsets of red muscle activity at a tail site (usually 0.75L). The rectified area of an EMG burst can be used as a measure of the intensity of muscle activity (Loeb and Gans, 1986) but, because this area can be strongly influenced by burst duration, mean intensity (INT; in mV) was also calculated by dividing the rectified area of each burst by its duration. Furthermore, because AREA depends upon factors such as the exact location of electrode placement or the exact structure of the hand-made bipolar electrode, comparisons of AREA and INT among different sites, individuals and speeds required some method of standardization. To accomplish this, the maximal AREA and INT were determined for each site in each individual, and all other values of AREA and INT at that
site in that individual were standardized as a proportion of the maximum: REL AREA and REL INT. In five individuals with confirmed electrode positions, onset (ON) and offset (OFF) times of muscle activity were calculated in relation to the estimated cyclical changes in muscle fiber length at the two highest swimming speeds. Several recent studies (see, for example, Wardle et al. 1995) have defined the muscle strain cycle as a 360 ° cycle where 0, 90, 180 and 270 ° indicate a fiber’s resting (during lengthening), maximal, resting (during shortening) and minimal length, respectively. Flexion data originally calculated for 12 fields in each tailbeat cycle (Fig. 1A) were smoothed and interpolated, effectively providing 60 values of intervertebral flexion equally spaced in time per tailbeat cycle (Fig. 1B). The interpolation function was used to generate more points in time to identify better the beginning and end of each 360 ° cycle of flexion, and did not influence the relative timing of the flexion cycle (Fig. 1C). Points of flexion closest in time to 0 ° were identified, and cycle by cycle, muscle onset and offset times were determined relative to each cycle of flexion for all electrodes from which EMG activity was obtained (Fig. 1D,E). Statistical analyses To quantify patterns of electromyographic activity, the mean and standard error of six variables were calculated for each fiber type, longitudinal position and swimming speed: DUR, DUR/CYC, REL AREA, REL INT, ON and OFF. Not all longitudinal positions and fiber types were active at each speed, so these means were calculated only from active sites and fiber types at each speed to indicate the nature of the muscle activity when present. To show how often longitudinal positions and fiber types were typically active, the proportion of cycles that showed activity at each position for each fiber type was calculated for each individual and averaged across all individuals for each swimming speed. To determine the extent to which swimming speed and longitudinal position affected DUR, DUR/CYC, REL AREA and REL INT, two-way analyses of variance (ANOVAs) were performed on each variable, with speed and position being fixed effects. In the ANOVAs, individual variation was not addressed (because some sites were active in only one or two individuals at some speeds) and, instead, mean values at each site and speed for each individual were used. If a particular site within a fiber type was inactive at a given speed, but showed activity at higher speeds or during other behaviors, or was inactive at all speeds, but the electrode appeared structurally sound and well placed during the post-mortem dissection, it was given a value of zero for REL AREA and REL INT, but was considered to be a missing value for DUR and DUR/CYC. If a site never showed activity and was pulled out prior to the end of the experiments, or if the electrode at that site had been damaged or implanted improperly, it was considered to be a missing value for all variables within the data set. Several variables analyzed by ANOVA were proportions, namely DUR/CYC, REL AREA and REL INT. Using proportions in statistical analyses can be problematic because
Muscle activity during eel swimming 3249 A 2 0 -2
Intervertebral flexion (degrees)
2
B
0 -2
C 2 0 -2
2
D
0 -2
their distribution tends to be skewed from normal (Atchley et al. 1976). In the case of DUR/CYC, arcsine transformation (Sokal and Rohlf, 1981) was used to make the distribution of this variable more normal (the qualitative results of the ANOVA procedures were unchanged by this transformation). In the cases of REL AREA and REL INT, arcsine transformations were also used to increase normality, and the qualitative ANOVA results were unchanged by this transformation. However, these data remained non-normally distributed (skewed to the right) even after these transformations as a result of values of zero being used to
3.0
3.5
4.0 Time (s)
4.5
5.0
E 0° Intervertebral flexion (degrees)
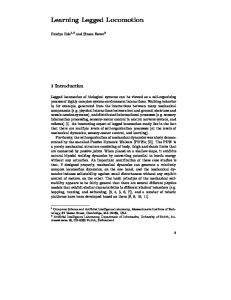
Fig. 1. A series of plots showing the process of identifying muscle onset and offset times relative to the in vivo pattern of intervertebral flexion (used as an estimate of muscle strain). The cyclic pattern of intervertebral flexion at 0.75L, where L is total body length, calculated from digitized video images of a swimming eel (A). Because only 12 video fields were digitized per cycle, flexion data were interpolated and smoothed using IGOR, providing 60 points of flexion data per cycle, facilitating a more accurate means of determining the timing of the beginning and end of each cycle of flexion (B). When the original and interpolated flexion cycles are superimposed (C), it can be seen that, although magnitudes are altered slightly, the times at which the flexion traces cross the zero line (used to define a strain cycle) have not been influenced by the interpolation process. Electromyogram (EMG) data were superimposed on the interpolated flexion data (D), facilitating the identification of the onset and offset times of muscle bursts, seen in the enlargement of one flexion cycle (E). Phase (in degrees) is shown at the top of E.
90°
180°
270°
360°
2
0 Offset
Onset -2 3.8
3.9
4.0 Time (s)
4.1
4.2
represent no activity at a site for these variables. ANOVAs were nevertheless run using these data, but the effects of speed and site are most clearly seen in graphical representations of the data (see Fig. 3). A subset of five individuals was used to determine whether longitudinal position or swimming speed affected EMG timing and, because the longitudinal distribution of muscle activity was greatest at the higher speeds, two-way ANOVAs (with speed and position as fixed effects) were run on the individual means of ON and OFF from swimming trials at 0.75 and 1.0 L s−1.
3250 G. B. GILLIS To account for multiple simultaneous ANOVAs, the level of statistical significance was adjusted (within a particular ANOVA model) using the sequential Bonferroni technique described by Rice (1989). Results Muscle activity at different speeds Muscle fiber type recruitment was clearly dependent upon swimming speed. In all the eels used in these experiments, only red muscle was used to power swimming at the slowest speed (Figs 2, 3A,F). However, all but one eel additionally recruited white muscle at 0.75L to help power swimming at the highest speed, and several eels also recruited more anteriorly located white muscle at this speed (Fig. 3F; Table 2). In addition, a pattern of ‘posterior-to-anterior’ recruitment within a fiber type was observed as eels increased their swimming speed (Figs 2, 3A,F). For example, eels typically used mainly posteriorly located red muscle (at 0.75 and 0.6L) to power slow-speed swimming, but would then additionally recruit more anteriorly located red muscle (at 0.45 and 0.3L) to swim at the higher speeds (Figs 2, 3A). Absolute duration (DUR) of red muscle EMG bursts decreased significantly with increasing swimming speed (F=7.2; d.f.=2,5; P=0.003), most notably between 0.5 and 0.75 L s−1 (Fig. 3B; however, Tukey post-hoc tests show that red muscle DUR at 0.75 and 1.0 L s−1 were not significantly different from one another). White muscle DUR did not change significantly with swimming speed (F=0.006; d.f.=1,2; P=0.939; Fig. 3G). However, because no white muscle activity
was recorded at the slowest speed, only the two higher speeds were included in white muscle analyses. Longitudinal position had no effect on DUR for red or white muscle, although red muscle bursts tended to be of slightly greater duration than white muscle bursts at the same position (Fig. 3B,G). Locomotor cycle time (CYC) decreased significantly with swimming speed (F=31.2; d.f.=2,10; P