that learning to rank approaches using features specific to blog posts/tweets lead to ...... 4.1 Top ranked results from the Google Web search engine for the query ...
News Vertical Search using User-Generated Content
Richard McCreadie School of Computing Science University of Glasgow
A thesis submitted for the degree of Doctor of Philosophy September 2012 c
Richard McCreadie, 2012
Abstract The thesis investigates how content produced by end-users on the World Wide Web — referred to as user-generated content — can enhance the news vertical aspect of a universal Web search engine, such that news-related queries can be satisfied more accurately, comprehensively and in a more timely manner. We propose a news search framework to describe the news vertical aspect of a universal web search engine. This framework is comprised of four components, each providing a different piece of functionality. The Top Events Identification component identifies the most important events that are happening at any given moment using discussion in user-generated content streams. The News Query Classification component classifies incoming queries as news-related or not in real-time. The Ranking News-Related Content component finds and ranks relevant content for news-related user queries from multiple streams of news and user-generated content. Finally, the News-Related Content Integration component merges the previously ranked content for the user query into the Web search ranking. In this thesis, we argue that user-generated content can be leveraged in one or more of these components to better satisfy news-related user queries. Potential enhancements include the faster identification of news queries relating to breaking news events, more accurate classification of news-related queries, increased coverage of the events searched for by the user or increased freshness in the results returned. Approaches to tackle each of the four components of the news search framework are proposed, which aim to leverage user-generated content. Together, these approaches form the news vertical component of a universal Web search engine. Each approach proposed for a component is thoroughly evaluated using one or more datasets developed for that component. Conclusions are derived concerning whether the use of user-generated content enhances the component in question using an appropriate measure, namely: effectiveness when ranking events by their current importance/newsworthiness for the Top Events Identification component; classification accuracy over different types of query for the News Query Classification component; relevance of the documents returned for the Ranking News-Related Content component; and end-user preference for rankings integrating user-generated content in comparison to the unaltered Web search ranking for the News-Related Content Integration component. Analysis
i
of the proposed approaches themselves, the effective settings for the deployment of those approaches and insights into their behaviour are also discussed. In particular, the evaluation of the Top Events Identification component examines how effectively events — represented by newswire articles — can be ranked by their importance using two different streams of user-generated content, namely blog posts and Twitter tweets. Evaluation of the proposed approaches for this component indicates that blog posts are an effective source of evidence to use when ranking events and that these approaches achieve state-of-the-art effectiveness. Using the same approaches instead driven by a stream of tweets, provide a story ranking performance that is significantly more effective than random, but is not consistent across all of the datasets and approaches tested. Insights are provided into the reasons for this with regard to the transient nature of discussion in Twitter. Through the evaluation of the News Query Classification component, we show that the use of timely features extracted from different news and user-generated content sources can increase the accuracy of news query classification over relying upon newswire provider streams alone. Evidence also suggests that the usefulness of the user-generated content sources varies as news events mature, with some sources becoming more influential over time as new content is published, leading to an upward trend in classification accuracy. The Ranking News-Related Content component evaluation investigates how to effectively rank content from the blogosphere and Twitter for news-related user queries. Of the approaches tested, we show that learning to rank approaches using features specific to blog posts/tweets lead to state-of-the-art ranking effectiveness under real-time constraints. Finally this thesis demonstrates that the majority of end-users prefer rankings integrated with usergenerated content for news-related queries to rankings containing only Web search results or integrated with only newswire articles. Of the user-generated content sources tested, the most popular source is shown to be Twitter, particularly for queries relating to breaking events. The central contributions of this thesis are the introduction of a news search framework, the approaches to tackle each of the four components of the framework that integrate user-generated content and their subsequent evaluation in a simulated real-time setting. This thesis draws insights from a broad range of experiments spanning the entire search process for news-related queries. The experiments reported in this thesis demonstrate the potential and scope for enhancements that can be brought about by the leverage of user-generated content for real-time news search and related applications.
ii
Acknowledgements This thesis was make possible by the great support that I have received from a wide variety of people during the course of my PhD. I first would like to thank my parents, who constantly encouraged me and helped keep the more practical aspects of my life intact, especially when deadlines were approaching. I must thank both my supervisor, Iadh Ounis, and co-supervisor Craig Macdonald. Their supervision taught me how to integrate and build upon prior works from many areas to tackle new tasks and design sound experiments to explore them. Moreover, without their meticulous attention to detail, this thesis would not have been possible. I would also like to thank the TerrierTeam research group with whom I shared an office for four years (and counting), most notably Rodrygo Santos who provided feedback relating to some of the experiments in this thesis. Finally, I wish to thank Charlie Clarke for his mentoring during the SIGIR Doctoral Consortium in the early stage of this thesis, which helped to shape it.
iii
Contents Abstract
i
Acknowledgements 1
2
iii
Introduction
1
1.1
Introduction . . . . . . . . . . . . . . . . . . . . . . . . . . . . . . . . . . . . . . . .
1
1.2
Motivation . . . . . . . . . . . . . . . . . . . . . . . . . . . . . . . . . . . . . . . . .
2
1.3
Thesis Statement . . . . . . . . . . . . . . . . . . . . . . . . . . . . . . . . . . . . .
6
1.4
Contributions . . . . . . . . . . . . . . . . . . . . . . . . . . . . . . . . . . . . . . .
6
1.5
Origins of the Material . . . . . . . . . . . . . . . . . . . . . . . . . . . . . . . . . .
8
1.6
Thesis Outline . . . . . . . . . . . . . . . . . . . . . . . . . . . . . . . . . . . . . . .
9
Information Retrieval
12
2.1
Introduction . . . . . . . . . . . . . . . . . . . . . . . . . . . . . . . . . . . . . . . .
12
2.2
Indexing . . . . . . . . . . . . . . . . . . . . . . . . . . . . . . . . . . . . . . . . . .
14
2.2.1
Tokenisation . . . . . . . . . . . . . . . . . . . . . . . . . . . . . . . . . . .
15
2.2.2
Stopword Removal . . . . . . . . . . . . . . . . . . . . . . . . . . . . . . . .
15
2.2.3
Stemming . . . . . . . . . . . . . . . . . . . . . . . . . . . . . . . . . . . . .
16
2.2.4
Index Data Structures . . . . . . . . . . . . . . . . . . . . . . . . . . . . . . .
16
2.2.5
Large Scale Indexing and MapReduce . . . . . . . . . . . . . . . . . . . . . .
19
2.2.6
Document Boilerplate . . . . . . . . . . . . . . . . . . . . . . . . . . . . . .
23
Document Retrieval . . . . . . . . . . . . . . . . . . . . . . . . . . . . . . . . . . . .
25
2.3.1
Term Frequency - Inverse Document Frequency (TF-IDF) . . . . . . . . . . .
26
2.3.2
The Best Match Weighting Model . . . . . . . . . . . . . . . . . . . . . . . .
27
2.3.3
Divergence From Randomness . . . . . . . . . . . . . . . . . . . . . . . . . .
28
2.3.4
Language Modelling . . . . . . . . . . . . . . . . . . . . . . . . . . . . . . .
29
2.3
i
CONTENTS
2.3.5 2.4
2.5
2.6
2.7
2.8
2.9 3
Query Expansion and Pseudo Relevance Feedback . . . . . . . . . . . . . . .
30
Evaluation . . . . . . . . . . . . . . . . . . . . . . . . . . . . . . . . . . . . . . . . .
32
2.4.1
Evaluation Measures . . . . . . . . . . . . . . . . . . . . . . . . . . . . . . .
32
2.4.2
Cranfield Paradigm . . . . . . . . . . . . . . . . . . . . . . . . . . . . . . . .
34
2.4.3
TREC . . . . . . . . . . . . . . . . . . . . . . . . . . . . . . . . . . . . . . .
35
2.4.4
Relevance Assessment . . . . . . . . . . . . . . . . . . . . . . . . . . . . . .
35
Machine Learning for IR . . . . . . . . . . . . . . . . . . . . . . . . . . . . . . . . .
36
2.5.1
Classification . . . . . . . . . . . . . . . . . . . . . . . . . . . . . . . . . . .
36
2.5.2
Learning to Rank . . . . . . . . . . . . . . . . . . . . . . . . . . . . . . . . .
38
2.5.3
Machine Learning Libraries/Toolkits . . . . . . . . . . . . . . . . . . . . . .
39
Topic Detection and Tracking (TDT) . . . . . . . . . . . . . . . . . . . . . . . . . . .
39
2.6.1
Topic Tracking . . . . . . . . . . . . . . . . . . . . . . . . . . . . . . . . . .
40
Ranking Aggregates . . . . . . . . . . . . . . . . . . . . . . . . . . . . . . . . . . . .
41
2.7.1
Aggregate Ranking Approaches . . . . . . . . . . . . . . . . . . . . . . . . .
41
Resource Selection/Vertical Search . . . . . . . . . . . . . . . . . . . . . . . . . . . .
43
2.8.1
Source Selection via Expected Relevancy . . . . . . . . . . . . . . . . . . . .
45
2.8.2
Source Selection via Vertical Type . . . . . . . . . . . . . . . . . . . . . . . .
46
2.8.3
Merging of Document Rankings . . . . . . . . . . . . . . . . . . . . . . . . .
47
Conclusions . . . . . . . . . . . . . . . . . . . . . . . . . . . . . . . . . . . . . . . .
48
Search and User Generated Content
50
3.1
Introduction . . . . . . . . . . . . . . . . . . . . . . . . . . . . . . . . . . . . . . . .
50
3.2
The Blogosphere . . . . . . . . . . . . . . . . . . . . . . . . . . . . . . . . . . . . .
51
3.2.1
Blog Search Queries . . . . . . . . . . . . . . . . . . . . . . . . . . . . . . .
52
3.2.2
Blog Post Search . . . . . . . . . . . . . . . . . . . . . . . . . . . . . . . . .
53
3.2.3
Top News Stories Identification . . . . . . . . . . . . . . . . . . . . . . . . .
54
3.2.4
News and Blogs . . . . . . . . . . . . . . . . . . . . . . . . . . . . . . . . .
56
3.2.5
Summary . . . . . . . . . . . . . . . . . . . . . . . . . . . . . . . . . . . . .
57
Digg . . . . . . . . . . . . . . . . . . . . . . . . . . . . . . . . . . . . . . . . . . . .
57
3.3.1
Digg Users . . . . . . . . . . . . . . . . . . . . . . . . . . . . . . . . . . . .
58
3.3.2
Story Promotion . . . . . . . . . . . . . . . . . . . . . . . . . . . . . . . . .
58
3.3.3
Summary . . . . . . . . . . . . . . . . . . . . . . . . . . . . . . . . . . . . .
59
Twitter . . . . . . . . . . . . . . . . . . . . . . . . . . . . . . . . . . . . . . . . . . .
59
3.3
3.4
ii
CONTENTS
3.5
3.6
3.7 4
5
3.4.1
Twitter Characteristics . . . . . . . . . . . . . . . . . . . . . . . . . . . . . .
60
3.4.2
Twitter Search . . . . . . . . . . . . . . . . . . . . . . . . . . . . . . . . . .
61
3.4.3
TREC 2011 Microblog Track . . . . . . . . . . . . . . . . . . . . . . . . . .
62
3.4.4
Event Detection in Twitter . . . . . . . . . . . . . . . . . . . . . . . . . . . .
63
3.4.5
Summary . . . . . . . . . . . . . . . . . . . . . . . . . . . . . . . . . . . . .
64
Query-Logs . . . . . . . . . . . . . . . . . . . . . . . . . . . . . . . . . . . . . . . .
64
3.5.1
Query Log Analysis . . . . . . . . . . . . . . . . . . . . . . . . . . . . . . .
65
3.5.2
Query Types and Vertical Selection . . . . . . . . . . . . . . . . . . . . . . .
66
3.5.3
Summary . . . . . . . . . . . . . . . . . . . . . . . . . . . . . . . . . . . . .
68
Wikipedia . . . . . . . . . . . . . . . . . . . . . . . . . . . . . . . . . . . . . . . . .
68
3.6.1
News Events and Wikipedia . . . . . . . . . . . . . . . . . . . . . . . . . . .
69
3.6.2
Summary . . . . . . . . . . . . . . . . . . . . . . . . . . . . . . . . . . . . .
69
Conclusions . . . . . . . . . . . . . . . . . . . . . . . . . . . . . . . . . . . . . . . .
70
A Framework for Real-time News Search
72
4.1
Introduction . . . . . . . . . . . . . . . . . . . . . . . . . . . . . . . . . . . . . . . .
72
4.2
Real-Time News Queries . . . . . . . . . . . . . . . . . . . . . . . . . . . . . . . . .
73
4.3
A Taxonomy of News Queries . . . . . . . . . . . . . . . . . . . . . . . . . . . . . .
74
4.4
Framework Overview . . . . . . . . . . . . . . . . . . . . . . . . . . . . . . . . . . .
76
4.5
Top Events Identification . . . . . . . . . . . . . . . . . . . . . . . . . . . . . . . . .
79
4.6
News Query Classification . . . . . . . . . . . . . . . . . . . . . . . . . . . . . . . .
83
4.7
Ranking News-Related Content . . . . . . . . . . . . . . . . . . . . . . . . . . . . . .
86
4.7.1
Blog Posts . . . . . . . . . . . . . . . . . . . . . . . . . . . . . . . . . . . .
87
4.7.2
Real-time Tweet Search . . . . . . . . . . . . . . . . . . . . . . . . . . . . .
88
4.8
News-Related Content Integration . . . . . . . . . . . . . . . . . . . . . . . . . . . .
89
4.9
Conclusions . . . . . . . . . . . . . . . . . . . . . . . . . . . . . . . . . . . . . . . .
91
Evaluation Datasets and Crowdsourcing
92
5.1
Introduction . . . . . . . . . . . . . . . . . . . . . . . . . . . . . . . . . . . . . . . .
92
5.2
Datasets Overview . . . . . . . . . . . . . . . . . . . . . . . . . . . . . . . . . . . .
94
5.2.1
Top Event Identification Datasets . . . . . . . . . . . . . . . . . . . . . . . .
97
5.2.2
News Query Classification Datasets . . . . . . . . . . . . . . . . . . . . . . .
99
5.2.3
Ranking News-Related Content Datasets . . . . . . . . . . . . . . . . . . . .
102
5.2.4
News-Related Content Integration Datasets . . . . . . . . . . . . . . . . . . .
103
iii
CONTENTS
5.2.5 5.3
5.4
5.5
5.6
5.7
5.8
Summary . . . . . . . . . . . . . . . . . . . . . . . . . . . . . . . . . . . . .
104
Crowdsourcing . . . . . . . . . . . . . . . . . . . . . . . . . . . . . . . . . . . . . .
104
5.3.1
Work Validation Strategies . . . . . . . . . . . . . . . . . . . . . . . . . . . .
106
5.3.2
Agreement Measures . . . . . . . . . . . . . . . . . . . . . . . . . . . . . . .
107
5.3.3
Structured Crowdsourced Evaluation . . . . . . . . . . . . . . . . . . . . . .
108
Crowdsourced Task: Identifying Top Events . . . . . . . . . . . . . . . . . . . . . . .
108
5.4.1
Task Description . . . . . . . . . . . . . . . . . . . . . . . . . . . . . . . . .
109
5.4.2
Interface Design for News Article Assessment . . . . . . . . . . . . . . . . .
109
5.4.3
Validation of Worker Assessments . . . . . . . . . . . . . . . . . . . . . . . .
110
5.4.4
Crowdsourcing Configuration . . . . . . . . . . . . . . . . . . . . . . . . . .
112
5.4.5
Assessment Accuracy . . . . . . . . . . . . . . . . . . . . . . . . . . . . . .
112
Crowdsourcing Task: Classifying User Queries . . . . . . . . . . . . . . . . . . . . .
113
5.5.1
Task Description . . . . . . . . . . . . . . . . . . . . . . . . . . . . . . . . .
113
5.5.2
Interface Design for News Query Classification . . . . . . . . . . . . . . . . .
114
5.5.3
Validation of Worker Labelling . . . . . . . . . . . . . . . . . . . . . . . . . .
116
5.5.4
Crowdsourcing Configuration . . . . . . . . . . . . . . . . . . . . . . . . . .
116
5.5.5
Label Quality . . . . . . . . . . . . . . . . . . . . . . . . . . . . . . . . . . .
117
Crowdsourcing Task: Ranking Blog Posts for a News Story . . . . . . . . . . . . . . .
118
5.6.1
Task Description . . . . . . . . . . . . . . . . . . . . . . . . . . . . . . . . .
118
5.6.2
Interface Design for Blog Post Ranking . . . . . . . . . . . . . . . . . . . . .
119
5.6.3
Validation of Worker Assessments . . . . . . . . . . . . . . . . . . . . . . . .
120
5.6.4
Crowdsourcing Configuration . . . . . . . . . . . . . . . . . . . . . . . . . .
122
5.6.5
Assessment Quality . . . . . . . . . . . . . . . . . . . . . . . . . . . . . . . .
122
Crowdsourced Task: Document Relevance Assessment . . . . . . . . . . . . . . . . .
123
5.7.1
Task Description . . . . . . . . . . . . . . . . . . . . . . . . . . . . . . . . .
123
5.7.2
Interface Design for Document Relevance Assessment . . . . . . . . . . . . .
124
5.7.3
Validation of Worker Assessments . . . . . . . . . . . . . . . . . . . . . . . .
126
5.7.4
Crowdsourcing Configuration . . . . . . . . . . . . . . . . . . . . . . . . . .
126
5.7.5
Assessment Quality . . . . . . . . . . . . . . . . . . . . . . . . . . . . . . . .
126
Conclusions . . . . . . . . . . . . . . . . . . . . . . . . . . . . . . . . . . . . . . . .
127
iv
CONTENTS
6
Identifying Top News
129
6.1
Introduction . . . . . . . . . . . . . . . . . . . . . . . . . . . . . . . . . . . . . . . .
129
6.2
Unlearned Story Ranking Approaches . . . . . . . . . . . . . . . . . . . . . . . . . .
131
6.2.1
Voting for Important Stories (Votes) . . . . . . . . . . . . . . . . . . . . . . .
131
6.2.2
Relevance Weighted Aggregation (RWA) . . . . . . . . . . . . . . . . . . . .
132
6.2.3
Story Length Normalisation (RWAN) . . . . . . . . . . . . . . . . . . . . . .
133
6.2.4
Temporal Promotion (GaussBoost) . . . . . . . . . . . . . . . . . . . . . . . .
134
6.2.5
Maximum Burst Magnitude (MaxBurst) . . . . . . . . . . . . . . . . . . . . .
136
6.3
Learning To Rank Stories (LTRS) . . . . . . . . . . . . . . . . . . . . . . . . . . . .
137
6.4
Experimental Methodology . . . . . . . . . . . . . . . . . . . . . . . . . . . . . . . .
140
6.4.1
Blog Stream Methodology . . . . . . . . . . . . . . . . . . . . . . . . . . . .
140
6.4.2
Tweet Stream Methodology . . . . . . . . . . . . . . . . . . . . . . . . . . .
143
6.5
Research Questions . . . . . . . . . . . . . . . . . . . . . . . . . . . . . . . . . . . .
144
6.6
Evaluation: News Story Ranking with Blogs . . . . . . . . . . . . . . . . . . . . . . .
146
6.6.1
Votes, RWA and RWAN . . . . . . . . . . . . . . . . . . . . . . . . . . . . .
147
6.6.2
GaussBoost . . . . . . . . . . . . . . . . . . . . . . . . . . . . . . . . . . . .
148
6.6.3
Learning to Rank Stories Effectiveness . . . . . . . . . . . . . . . . . . . . .
149
6.6.4
Influential Story Ranking Features . . . . . . . . . . . . . . . . . . . . . . . .
151
6.6.5
Event Promotion in Blogs . . . . . . . . . . . . . . . . . . . . . . . . . . . .
152
6.6.6
Conclusions . . . . . . . . . . . . . . . . . . . . . . . . . . . . . . . . . . . .
153
Evaluation: News Story Ranking with Tweets . . . . . . . . . . . . . . . . . . . . . .
153
6.7.1
Votes, RWA and RWAN . . . . . . . . . . . . . . . . . . . . . . . . . . . . .
154
6.7.2
GaussBoost . . . . . . . . . . . . . . . . . . . . . . . . . . . . . . . . . . . .
156
6.7.3
MaxBurst . . . . . . . . . . . . . . . . . . . . . . . . . . . . . . . . . . . . .
158
6.7.4
Learning to Rank Stories Effectiveness . . . . . . . . . . . . . . . . . . . . .
159
6.7.5
Influential Story Ranking Features . . . . . . . . . . . . . . . . . . . . . . . .
162
6.7.6
Event Promotion in Tweets . . . . . . . . . . . . . . . . . . . . . . . . . . . .
163
6.7.7
Conclusions . . . . . . . . . . . . . . . . . . . . . . . . . . . . . . . . . . . .
164
Conclusions . . . . . . . . . . . . . . . . . . . . . . . . . . . . . . . . . . . . . . . .
165
6.7
6.8
v
CONTENTS
7
News Query Classification
168
7.1
Introduction . . . . . . . . . . . . . . . . . . . . . . . . . . . . . . . . . . . . . . . .
168
7.2
Feature Aggregation from News Streams (FANS) . . . . . . . . . . . . . . . . . . . .
169
7.3
Experimental Methodology . . . . . . . . . . . . . . . . . . . . . . . . . . . . . . . .
172
7.4
News Query Classification Features . . . . . . . . . . . . . . . . . . . . . . . . . . .
174
7.5
Research Questions . . . . . . . . . . . . . . . . . . . . . . . . . . . . . . . . . . . .
177
7.6
Evaluating News Query Classification on the May 2006 Dataset . . . . . . . . . . . .
178
7.6.1
Integrating User-generated Content . . . . . . . . . . . . . . . . . . . . . . .
178
7.6.2
Feature Importance . . . . . . . . . . . . . . . . . . . . . . . . . . . . . . . .
180
7.6.3
Timeliness . . . . . . . . . . . . . . . . . . . . . . . . . . . . . . . . . . . .
183
Evaluating News Query Classification on the April 2012 Dataset . . . . . . . . . . . .
184
7.7.1
Integrating User-generated Content . . . . . . . . . . . . . . . . . . . . . . .
185
7.7.2
Feature Importance . . . . . . . . . . . . . . . . . . . . . . . . . . . . . . . .
187
7.7.3
Timeliness . . . . . . . . . . . . . . . . . . . . . . . . . . . . . . . . . . . .
191
Conclusions . . . . . . . . . . . . . . . . . . . . . . . . . . . . . . . . . . . . . . . .
192
7.7
7.8 8
Ranking News Content
195
8.1
Introduction . . . . . . . . . . . . . . . . . . . . . . . . . . . . . . . . . . . . . . . .
195
8.2
Learning to Rank User-Generated Content . . . . . . . . . . . . . . . . . . . . . . . .
196
8.2.1
Learning to Rank Blog Posts . . . . . . . . . . . . . . . . . . . . . . . . . . .
197
8.2.2
Learning to Rank Tweets . . . . . . . . . . . . . . . . . . . . . . . . . . . . .
201
Experimental Methodology . . . . . . . . . . . . . . . . . . . . . . . . . . . . . . . .
205
8.3.1
Blog Post Ranking Methodology . . . . . . . . . . . . . . . . . . . . . . . . .
205
8.3.2
Tweet Ranking Methodology . . . . . . . . . . . . . . . . . . . . . . . . . . .
207
8.4
Research Questions . . . . . . . . . . . . . . . . . . . . . . . . . . . . . . . . . . . .
207
8.5
Evaluation: Blog Post Ranking . . . . . . . . . . . . . . . . . . . . . . . . . . . . . .
208
8.5.1
Learning to Rank Performance . . . . . . . . . . . . . . . . . . . . . . . . . .
208
8.5.2
Ranking Effectiveness Over Time . . . . . . . . . . . . . . . . . . . . . . . .
209
8.5.3
Blog Post Ranking Features . . . . . . . . . . . . . . . . . . . . . . . . . . .
210
8.5.4
Conclusions . . . . . . . . . . . . . . . . . . . . . . . . . . . . . . . . . . . .
212
Evaluation: Tweet Ranking . . . . . . . . . . . . . . . . . . . . . . . . . . . . . . . .
213
8.6.1
Learning to Rank Performance . . . . . . . . . . . . . . . . . . . . . . . . . .
213
8.6.2
Tweet Ranking Features . . . . . . . . . . . . . . . . . . . . . . . . . . . . .
215
8.3
8.6
vi
CONTENTS
8.6.3 8.7 9
Conclusions . . . . . . . . . . . . . . . . . . . . . . . . . . . . . . . . . . . .
216
Conclusions . . . . . . . . . . . . . . . . . . . . . . . . . . . . . . . . . . . . . . . .
217
News-Related Content Integration
219
9.1
Introduction . . . . . . . . . . . . . . . . . . . . . . . . . . . . . . . . . . . . . . . .
219
9.2
Resource Selection for News-Related Content Integration . . . . . . . . . . . . . . . .
220
9.3
Comparative Ranking Evaluation and Presentation . . . . . . . . . . . . . . . . . . .
222
9.4
Research Questions . . . . . . . . . . . . . . . . . . . . . . . . . . . . . . . . . . . .
226
9.5
Experimental Methodology . . . . . . . . . . . . . . . . . . . . . . . . . . . . . . . .
226
9.5.1
News-Related Queries and Content Sources . . . . . . . . . . . . . . . . . . .
226
9.5.2
Document Rankings . . . . . . . . . . . . . . . . . . . . . . . . . . . . . . .
227
9.5.3
Experiment structure . . . . . . . . . . . . . . . . . . . . . . . . . . . . . . .
229
9.5.4
Worker Instructions . . . . . . . . . . . . . . . . . . . . . . . . . . . . . . . .
230
9.5.5
Crowdsourcing Configuration and Statistics . . . . . . . . . . . . . . . . . . .
230
Evaluation: Integrating News and User-generated Content . . . . . . . . . . . . . . .
231
9.6.1
Integrating Top Events . . . . . . . . . . . . . . . . . . . . . . . . . . . . . .
231
9.6.2
Integrating News and User-Generated Content vs the Web Search
9.6
9.7
Ranking . . . . . . . . . . . . . . . . . . . . . . . . . . . . . . . . . . . . . .
233
9.6.3
Integrating User-Generated Content vs News Content . . . . . . . . . . . . . .
235
9.6.4
Integrating User-Generated Content for Breaking and Recent Events . . . . . .
237
Conclusions . . . . . . . . . . . . . . . . . . . . . . . . . . . . . . . . . . . . . . . .
238
10 Conclusions and Future Work
241
10.1 Contributions and Conclusions . . . . . . . . . . . . . . . . . . . . . . . . . . . . . .
241
10.1.1 Contributions . . . . . . . . . . . . . . . . . . . . . . . . . . . . . . . . . . .
241
10.1.2 Conclusions . . . . . . . . . . . . . . . . . . . . . . . . . . . . . . . . . . . .
244
10.1.3 Thesis Conclusions . . . . . . . . . . . . . . . . . . . . . . . . . . . . . . . .
248
10.2 Directions for Future Work . . . . . . . . . . . . . . . . . . . . . . . . . . . . . . . .
249
10.3 Closing Remarks . . . . . . . . . . . . . . . . . . . . . . . . . . . . . . . . . . . . .
250
A Parameter Analysis for Top Events Identification
252
A.1 Parameter Analysis on Blogs . . . . . . . . . . . . . . . . . . . . . . . . . . . . . . .
252
A.1.1 News Story Representations . . . . . . . . . . . . . . . . . . . . . . . . . . .
252
A.1.2 Ranking Depth . . . . . . . . . . . . . . . . . . . . . . . . . . . . . . . . . .
254
vii
CONTENTS
A.2 Parameter Analysis on Twitter . . . . . . . . . . . . . . . . . . . . . . . . . . . . . .
254
A.2.1 Background Window . . . . . . . . . . . . . . . . . . . . . . . . . . . . . . .
256
A.2.2 Recent Window . . . . . . . . . . . . . . . . . . . . . . . . . . . . . . . . . .
257
A.2.3 News Story Representations . . . . . . . . . . . . . . . . . . . . . . . . . . .
258
A.2.4 Ranking Depth . . . . . . . . . . . . . . . . . . . . . . . . . . . . . . . . . .
261
B Worker Instructions for Crowdsourcing
264
B.1 Story Ranking Task Worker Instructions . . . . . . . . . . . . . . . . . . . . . . . . .
265
B.2 News Query Classification Worker Instructions . . . . . . . . . . . . . . . . . . . . .
266
B.3 Blog Post Ranking Task Worker Instructions . . . . . . . . . . . . . . . . . . . . . . .
267
B.4 Document Assessment Task Worker Instructions . . . . . . . . . . . . . . . . . . . . .
268
C Features for News Query Classification
269
C.1 Query-only Features . . . . . . . . . . . . . . . . . . . . . . . . . . . . . . . . . . .
269
C.2 Frequency Features . . . . . . . . . . . . . . . . . . . . . . . . . . . . . . . . . . . .
270
C.3 Retrieval Features . . . . . . . . . . . . . . . . . . . . . . . . . . . . . . . . . . . . .
273
C.4 Burstiness Features . . . . . . . . . . . . . . . . . . . . . . . . . . . . . . . . . . . .
274
C.5 Importance Features . . . . . . . . . . . . . . . . . . . . . . . . . . . . . . . . . . . .
276
C.6 Stream-Specific Features . . . . . . . . . . . . . . . . . . . . . . . . . . . . . . . . .
277
D News Query Classification Learners
279
References
304
viii
List of Figures 1.1
Example search results for the query ‘olympics’ to the Google Search engine on the 22/07/12. . . . . . . . . . . . . . . . . . . . . . . . . . . . . . . . . . . . . . . . . .
3
2.1
Pseudo-code for the word-counting operation, expressed as map and reduce functions.
21
2.2
Pseudo-code for the Terrier indexing strategy Map function. . . . . . . . . . . . . . .
23
2.3
Pseudo-code for the Terrier indexing strategy Reduce function. . . . . . . . . . . . . .
24
4.1
Top ranked results from the Google Web search engine for the query ‘olympic swimming’ on 01/08/12 at two points in time. . . . . . . . . . . . . . . . . . . . . . . . . .
74
4.2
Overview of the proposed News Search Framework. . . . . . . . . . . . . . . . . . . .
77
4.3
Top news identification component within our news search framework. . . . . . . . . .
80
4.4
Top Bing search results for the query ‘cnn’ on 27/06/2012. . . . . . . . . . . . . . . .
81
4.5
News query classification component within our news search framework. . . . . . . .
83
4.6
Top news-related results returned for the query ‘find silver in london’ from the Google Web search engine on 01/08/12. . . . . . . . . . . . . . . . . . . . . . . . . . . . . .
84
4.7
Google Trends result for the query ‘ash cloud’ (made on 30/01/2012). . . . . . . . . .
85
4.8
Ranking News-Related Content component within our news search framework. . . . .
86
4.9
News-Related Content Integration component within our news search framework. . . .
89
5.1
Illustration of available document corpora from different years. . . . . . . . . . . . . .
94
5.2
An example of news story importance scoring on the nytimes.com website - 10/01/2012. 100
5.3
A screenshot of the external judging interface shown to workers within the instructions. 110
5.4
Displayed summary of three workers judgements for a single task instance. . . . . . .
111
5.5
Task instance possibly completed by a bot. . . . . . . . . . . . . . . . . . . . . . . . .
111
5.6
News query classification instances used in this thesis. Not all of the news story summaries are shown in the Headline+Summary interface to save space. . . . . . . . . . .
ix
115
LIST OF FIGURES
5.7
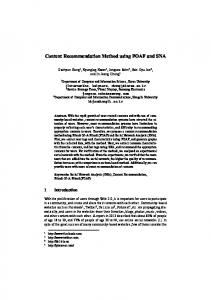
A screenshot of the external judging interface shown to workers within the instructions. 119
5.8
An example blog post rendering both when cleaned and as HTML. The HTML rendering contains the same content as the cleaned version, however, due to a missing CSS template one would need to scroll down to get to it. . . . . . . . . . . . . . . . . . . .
121
5.9
The basic interface with which our workers label each query. . . . . . . . . . . . . . .
125
6.1
Example of Gaussian curves with varying values of l (the Gaussian curve width). Note that for illustration clarity, weights have been normalised so that ∆t = 0 will always be assigned a weight of 1. . . . . . . . . . . . . . . . . . . . . . . . . . . . . . . . . . .
6.2
134
An example of 12 story ranking features generated from two story representations, two tweet rankers, two extracted tweet-features and two aggregation models. . . . . . . . .
139
6.3
Example tweet that would be promoted by the Mentions feature. . . . . . . . . . . . .
163
6.4
The average age of selected tweets as the retrieval depth is increased. . . . . . . . . . .
164
7.1
A hypothetical distribution of documents published over time that are about a newsworthy event in three streams. . . . . . . . . . . . . . . . . . . . . . . . . . . . . . . . .
170
7.2
Illustration of feature generation for news query classification. . . . . . . . . . . . . .
172
7.3
News query classification F1 performance for three temporal settings using each news and user-generated content stream. . . . . . . . . . . . . . . . . . . . . . . . . . . . .
7.4
182
News query classification effectiveness when using different combinations of stream features query-only features (66/33 split). . . . . . . . . . . . . . . . . . . . . . . . .
188
7.5
News query classification F1 when using features derived from each stream over time.
193
9.1
Illustration of the top events and news and user-generated content integration into the Web search ranking (IntegrationN ews (RW , I) and IntegrationRE (Q, R1..n , RW , S)). 222
9.2
Comparison of our framework presentation of search results to the Bing Web search engine. . . . . . . . . . . . . . . . . . . . . . . . . . . . . . . . . . . . . . . . . . . .
9.3
224
Illustration of the ranking interface produced for the query ‘north korea’ on 13/4/12 with our framework, where the enhanced ranking integrates Digg posts. The first two rankings are the ranking pair to be assessed. The third (red) bordered ranking a validation ranking designed to catch workers that are randomly clicking. . . . . . . . . . . . . .
9.4
225
The number of topics where the majority of users preferred the Web search ranking or the enhanced ranking that integrates each source. . . . . . . . . . . . . . . . . . . . .
x
234
LIST OF FIGURES
9.5
Topic comparison between rankings enhanced with news articles and those enhanced with other user-generated content sources. . . . . . . . . . . . . . . . . . . . . . . . .
xi
236
List of Tables 2.1
A document-posting list . . . . . . . . . . . . . . . . . . . . . . . . . . . . . . . . . .
17
2.2
An example inverted-index . . . . . . . . . . . . . . . . . . . . . . . . . . . . . . . .
17
2.3
An example document index . . . . . . . . . . . . . . . . . . . . . . . . . . . . . . .
18
2.4
IR corpora in order of increasing size . . . . . . . . . . . . . . . . . . . . . . . . . . .
20
2.5
Document ranking/classification confusion table for calculating precision and recall. .
33
4.1
Classifications for the 2268 queries sampled from the MSN query log. . . . . . . . . .
76
5.1
Statistics of all corpora representing document streams used in this thesis. . . . . . . .
95
5.2
A listing of the datasets and corpora used to evaluate each component of our news search framework. For each dataset, whether they were produced for the Text REtrieval Conference (TREC) and whether they use crowdsourcing for relevance assessment generation is also noted. Where the crowdsourced assessments column is marked with a 4*, that indicates that we collaborated with TREC to produce the assessments using crowdsourcing. . . . . . . . . . . . . . . . . . . . . . . . . . . . . . . . . . . . . . .
5.3
96
Top Events Identification datasets used in this thesis. Datasets that were produced by TREC or that contain crowdsourced relevance assessments are denoted with a 4 in the associated column. Where crowdsourced assessments are marked with a 4* the dataset assessments were crowdsourced by ourselves on behalf of TREC. . . . . . . . . . . .
5.4
98
News Query Classification datasets used in this thesis. Datasets that were produced by TREC or that contain crowdsourced relevance assessments are denoted with a 4 in the associated column. . . . . . . . . . . . . . . . . . . . . . . . . . . . . . . . . . . . .
5.5
100
Ranking News-Related Content datasets used in this thesis. Datasets that were produced by TREC or that contain crowdsourced relevance assessments are denoted with a 4 in the associated column. Where crowdsourced assessments is marked with a 4* the dataset assessments were crowdsourced by ourselves on behalf of TREC. . . . . . . .
xii
102
LIST OF TABLES
5.6
Summary of the N RCIApr2012 News-Related Content Integration dataset used in this thesis. Datasets that were produced by TREC or that contain crowdsourced relevance assessments are denoted with a 4 in the associated column. . . . . . . . . . . . . . . .
104
5.7
Summary of the tasks crowdsourced for each dataset. . . . . . . . . . . . . . . . . . .
105
5.8
Judgement distribution and agreement on a per category basis. . . . . . . . . . . . . .
112
5.9
test Statistics for the MSN query log from 2006, as well as the sampled N QC2006 and f ull N QC2006 .. . . . . . . . . . . . . . . . . . . . . . . . . . . . . . . . . . . . . . . . .
114
f ull test 5.10 Statistics for the validation sets created for the N QC2006 and N QC2006 .. . . . . . . .
116
test 5.11 Quality measures for news query classification on the approximately 100 query N QC2006 f ull with varying interfaces, in addition to the over 1000 query N QC2006 using the Link-
Supported interface. . . . . . . . . . . . . . . . . . . . . . . . . . . . . . . . . . . . .
118
5.12 Average amount paid per hour to workers and work composition for each batch of HITs. 122 5.13 Accuracy of blog post assessments in comparison to the track organiser judgements. . .
123
5.14 Statistics of the documents to be assessed from each of the five news and user-generated content sources. . . . . . . . . . . . . . . . . . . . . . . . . . . . . . . . . . . . . . .
124
5.15 Statistics of the document relevance assessments produced by MTurk workers. . . . . .
127
6.1
A sample assignment of votes for two articles (a1 and a2 ) over 3 days (d1 to d3 ). . . .
132
6.2
Blog stream LTRS feature instances used. . . . . . . . . . . . . . . . . . . . . . . . .
143
6.3
Tweet stream LTRS feature instances used. . . . . . . . . . . . . . . . . . . . . . . .
145
6.4
News story ranking performance of Votes, RWA and RWAN in comparison to the best participating system to the TREC top news stories identification task during 2009 and 2010. . . . . . . . . . . . . . . . . . . . . . . . . . . . . . . . . . . . . . . . . . . .
6.5
News story ranking performance of VotesGaussBoost and RWAGaussBoost when the Gaussian curve width l is varied. . . . . . . . . . . . . . . . . . . . . . . . . . . . . .
6.6
146
150
Comparison between our learning to rank approach when trained under both CrossCorpus and Per-Corpus training with the best TREC systems in terms of overall story ranking performance under the Blogs09 and Blogs10 story ranking topics. N denotes a statistically significant increase over the best individual feature (t-test p < 0.05). . . . .
6.7
151
Strongest 5 positive and negative features on the Blogs09 and Blogs10 datasets. Boldened feature weights indicate features with a high impact on the story ranking. The document feature component is not reported, as only document relevance is used in this experiment. . . . . . . . . . . . . . . . . . . . . . . . . . . . . . . . . . . . . . . . .
xiii
152
LIST OF TABLES
6.8
News story ranking performance of Votes, RWA and RWAN in comparison to the random baseline. N and H indicate statistically significant increases/decreases over Votes using the Tweet representation under t-test p < 0.05. NN and HH indicate statistically significant increases/decreases over Votes using the Tweet representation under t-test p < 0.01. . . . . . . . . . . . . . . . . . . . . . . . . . . . . . . . . . . . . . . . . .
6.9
155
News story ranking performance of VotesGaussBoost and RWAGaussBoost in comparison to Votes and RWA. The most effective NDCG and Success@1 performance observed under each approach and dataset is highlighted. N and H indicate statistically significant increases/decreases over the baseline run without GaussBoost under t-test p < 0.05. NN and HH indicate statistically significant increases/decreases under t-test p < 0.01. . . . . . . . . . . . . . . . . . . . . . . . . . . . . . . . . . . . . . . . . .
157
6.10 News story ranking performance of VotesM axBurst , RWAM axBurst and RWANM axBurst . The most effective NDCG and Success@1 performance observed under each approach and dataset is highlighted. N and H indicate statistically significant increases/decreases over the base news story ranking approach without M axBurst under t-test p < 0.05. NN and HH indicate statistically significant increases/decreases under t-test p < 0.01.
158
6.11 News story ranking performance of VotesM axBurst+GaussBoost and RWAM axBurst+GaussBoost in comparison to Votes and RWA. The most effective NDCG and Success@1 performance observed under each approach and dataset is highlighted. N and H indicate statistically significant increases/decreases over the base news story ranking approach without M axBurst and GaussBoost under t-test p < 0.05. NN and HH indicate statistically significant increases/decreases under t-test p < 0.01. . . . . . . . . . . . .
160
6.12 Learned story ranking performance when training across story ranking datasets when using AFS. The most effective NDCG and Success@1 performance observed under each approach and dataset is highlighted. N and H indicate statistically significant increases/decreases over the random baseline under t-test p < 0.05. NN and HH indicate statistically significant increases/decreases under t-test p < 0.01. . . . . . . . . . . . .
161
6.13 Top 5 features (comprised of their four individual elements) selected by AFS on the Twitter12−T R dataset. . . . . . . . . . . . . . . . . . . . . . . . . . . . . . . . . . . .
162
7.1
News Streams available within each of the two news query classification datasets. . . .
173
7.2
All query-only and stream features extracted from the N QCM ay2006 and N QCApr2012 datasets, excluding stream-specifc features. . . . . . . . . . . . . . . . . . . . . . . .
xiv
176
LIST OF TABLES
7.3
0 All 10 corpus specific stream features extracted N QC2012 s Digg and Twitter streams. .
7.4
News query classification performance using multiple combinations of news and user-
177
generated streams. Statistical significance (t-test p < 0.05) over the BBC+Guardian+Telegraph news baseline is denoted N. 7.5
179
News query classification performance for each of the three query feature categories described in Appendix C.1.
7.6
. . . . . . . . . . . . . . . . . . . . . . . . . . . . . . .
. . . . . . . . . . . . . . . . . . . . . . . . . . . . . . .
180
News query classification performance using different feature set/streams combinations. Statistically significant (t-test p < 0.05) decreases in performance over using all features are denoted H. . . . . . . . . . . . . . . . . . . . . . . . . . . . . . . . . . . . . . . .
7.7
181
News query classification performance in terms of precision, recall and F1 for three temporal settings using all streams. Statistically significant (t-test p < 0.05) decreases in performance over classification at the original query time are denoted H. . . . . . .
183
7.8
Percentage of the four query types that were classified correctly at the three points in time.184
7.9
News query classification performance using multiple combinations of news and usergenerated corpora.
. . . . . . . . . . . . . . . . . . . . . . . . . . . . . . . . . . . .
187
7.10 Positive and Negative query features selected on the 66% training set and their weights (66/33 split). . . . . . . . . . . . . . . . . . . . . . . . . . . . . . . . . . . . . . . . .
189
7.11 News query classification performance using different feature set/streams combinations. The best performing feature combinations that use a single stream are highlighted in bold. Cases where combining streams results in increased performance over any single stream is also highlighted in bold. . . . . . . . . . . . . . . . . . . . . . . . . . . . .
191
7.12 News query classification performance in terms of precision, recall and F1 for three temporal settings using each news and user-generated content stream. The best performing feature combinations that use a single stream are highlighted in bold. Cases where combining streams results in increased performance over any single stream is also highlighted in bold. Statistically significant increases (t-test p or < p > tags. Indeed, Figure 5.8 (b) shows the cleaned version of the same page. However, we do provide a full HTML rendering that can be loaded by pressing the ‘Full Post’ button on the left component of the interface (see Figure 5.7), in case the text cleaning mistakenly removes the main content of the article.
5.6.3
Validation of Worker Assessments
As before, to ensure the quality of the relevance assessments produced, we employ validation strategies. In this case, we use a form of gold judgement validation. In particular, typical gold standard validation involves the prior creation of a gold-standard judgement set, with which to test workers, known as a ‘honey pot’ (see Section 5.3.2). Our approach is similar, except that we wait until all of the work is completed, such that we can better identify those documents that workers found difficult, i.e. disagreed on. For each set of 20 blog posts, we select three posts to be validated against a gold standard, i.e. one judged relevant, one judged possibly relevant and one judged not relevant. For each of these selected posts, the author assessed their relevance to the associated newswire article, forming the gold standard. If more than one of these did not match this gold standard, then all 20 assessments were rejected and re-posted for another worker to complete on the grounds that the work was not of sufficient quality. Overall, this resulted in a gold standard set of roughly 15% of all blog posts to be assessed (1197/7975), and took within the region of 8 hours to create. This is naturally longer than it would take to create a normal 5% gold standard set. However, by using a larger and more evenly distributed gold standard, we have greater confidence in the reliability of the gold standard, and hence the quality of the resulting assessments.
120
5.6 Crowdsourcing Task: Ranking Blog Posts for a News Story
(a) HTML.
(b) Cleaned.
Figure 5.8: An example blog post rendering both when cleaned and as HTML. The HTML rendering contains the same content as the cleaned version, however, due to a missing CSS template one would need to scroll down to get to it.
121
5.6 Crowdsourcing Task: Ranking Blog Posts for a News Story
Batch Batch 1 Batch 2 Batch 3 Batch 4 Batch 5 Batch 6
# Stories 1→5 6→15 16→28 29→50 51→68 68
# HITs 27 66 78 137 102 68
# Judgements 540 1320 1560 2740 2040 80
Pay Per HIT 0.50 0.50 0.50 0.50 0.50 0.25
Hourly-rate ($) 2.27 3.85 3.90 3.58 2.27 6.07
Table 5.12: Average amount paid per hour to workers and work composition for each batch of HITs.
5.6.4
Crowdsourcing Configuration
For crowdsourcing, we use the Amazon Mechanical Turk (MTurk) marketplace. Recall that in total we assess 7,975 blog posts from 68 newswire articles. We spread these over 433 MTurk HIT instances, each containing approximately 20 posts. We pay our workers $0.50 (US dollars) per HIT for the 20 assessments. The total cost is $238.70 (including Amazon’s 10% fees). Due to the larger and more thorough gold standard validation set employed, we have only a single worker assess each HIT. We did not restrict worker selection based on geography, however only workers with a prior 95% acceptance rate were accepted for this task. Continuing with an iterative methodology (Alonso et al., 2008), we submitted our HITs in 6 distinct batches, allowing for feedback to be accumulated and HIT improvements to be made. The first five batches were comprised of HITs containing 20 blog posts to be judged. The sixth batch contained all of the remaining blog posts for each news story. Table 5.12 reports the statistics and per-hourly rate paid to workers during each of the six batches.
5.6.5
Assessment Quality
For the blog post ranking task, we had a single worker judge each blog post. As such, we cannot use inter-worker agreement to estimate final quality (at least three workers per blog post would be required). Instead, to determine the quality of our resulting relevance assessments, we compare them against assessments produced by the author as a ground truth. In particular, we randomly sampled 5% of the blog post set judged (360/7975) and manually assessed each post in terms of its relevancy to the associated news story. Note that this is not the same as the gold standard used to validate the workers during the production of the relevance assessment (see Section 5.6.3), but is a different set used to evaluate the quality of the final relevance assessments produced. Table 5.13 reports the accuracy of the crowdsourced blog post relevance judgements in comparison to the aforementioned ground truth, both overall (All), and in terms of each relevance grade.
122
5.7 Crowdsourced Task: Document Relevance Assessment
Relevance Grade Relevant Probably Relevant Not Relevant All
Accuracy 62.43% 50.00% 74.64% 66.63%
Table 5.13: Accuracy of blog post assessments in comparison to the track organiser judgements. We observe a reasonable overall accuracy of 66.63%, i.e. 2/3 crowdsourced judgements exactly matched our ground truth. This indicates that by using a single crowdsourced worker, we can still generate assessments of reasonable quality. Furthermore, we see that a disproportionate number of incorrect judgements belonged to ‘Probably Relevant’ category. This is to be expected, as blog posts that fall into this category were difficult to assess for our track organisers. To resolve this, we collapse these three-way graded assessments into a binary form, by combing the ‘Probably Relevant’ and ‘Not Relevant’ categories together. By doing so, we observe a markedly higher worker accuracy of 76.73%. Indeed, based upon this higher level of accuracy and the resilience of Cranfield-style evaluation when using many topics to variances in assessment quality (Bailey et al., 2008), we conclude that the relevance labels produced are of sufficient quality to use in our subsequent evaluation of blog post ranking approaches in Chapter 8.
5.7
Crowdsourced Task: Document Relevance Assessment
In this section, we describe how we crowdsource relevance assessments for a series of documents ranked from different sources as part of the N RCIApr2012 dataset. Recall from Section 5.2.4 that for this dataset, we use crowdsourcing to filter out irrelevant documents for rankings of news and user-generated content that we integrate into the Web search ranking in our final experimental chapter (Chapter 9). We structure this section into five sections as follows. In Section 5.7.1, we describe the crowdsourcing task. Section 5.7.2 details the assessment interface developed. In Section 5.7.3 we describe how we validate the assessments produced. Section 5.7.4 details the setup of the crowdsourcing task, while Section 5.7.5 reports the quality of the result assessments.
5.7.1
Task Description
The crowdsourcing task that we tackle in this section is to assess documents as relevant, possibly relevant or not relevant for a news-related user query. In this case, the documents can come from any one of five news and user-generated content sources, namely newswire, the blogosphere, Twitter, Digg or Wikipedia. Documents are uniformly represented as title and snippet pairs, with the exception of Twitter
123
5.7 Crowdsourced Task: Document Relevance Assessment
Corpus BlekkoN ewsSnippetsApr2012 BlekkoBlogSnippetsApr2012 DiggSnippetsApr2012 T weetsApr2012 W ikiU pdatesApr2012 Total
Document Type Newswire Articles Blog Posts Digg Posts Twitter Tweets Wikipedia Pages
# Documents 1,553 1,857 1,888 1,990 902 8,190
Table 5.14: Statistics of the documents to be assessed from each of the five news and user-generated content sources. tweets that only contain a ‘title’ representing the text of the tweet. The news-related queries for which the documents are to be assessed come from the Google Trends analysis tool (see Section 5.2.4). There are 8,190 documents to be assessed in total over the 199 queries (see Table 5.6). These documents come from pooling the top 10 rankings produced for each of the 199 queries by a single search engine for each of the five news and user-generated content rankings (the ranking approaches employed are described later in Section 9.5.2). Note that not all of the queries retrieved 10 documents since some news and user-generated content sources may contain fewer than ten related documents within the time window considered, hence the uneven total number of documents. Table 5.14 lists the corpora that the documents come from and the number of documents from each of those sources. From Table 5.14, we see that of the five sources, the blog post, Digg and Twitter corpora returned between 1,850 and the maximum 1,990 documents over the 199 news-related queries. The newswire article corpus returned fewer documents (1,553), while Wikipedia returned the fewest with only 902 documents.
5.7.2
Interface Design for Document Relevance Assessment
To enable workers to assess each of the 8,190 documents we develop a common interface that we vary slightly for each of the five different type of documents that we have assessed. This interface is comprised of two components. Firstly, an instruction block describing how the worker is to complete the task is provided at the top. An illustration of the instructions can be found in Appendix B.4. Below the instruction block are a series or assessment blocks. Each assessment block represents a single assessment that the worker is to make. Figure 5.9 illustrates how documents from three of the five sources are displayed to the user as assessment blocks. From Figure 5.9, we see that in each interface the news-related query is displayed at the top. Below the query, the document title and snippet pair is displayed. For Figure 5.9 (a) and (b) representing blog and Digg posts respectively, these take the form of an actual title and document snippet from the original document, while for Twitter (Figure 5.9 c) the
124
5.7 Crowdsourced Task: Document Relevance Assessment
(a) Blog Post
(b) Digg
(c) Twitter
Figure 5.9: The basic interface with which our workers label each query.
125
5.7 Crowdsourced Task: Document Relevance Assessment
tweet text is displayed in the ‘title’ slot and the username and the number of retweets is displayed below it. Underneath the document representation, a common evaluation block is displayed enabling the user to record their assessment for that document and query.
5.7.3
Validation of Worker Assessments
As with previous crowdsourcing studies, we use gold judgement validation to identify workers who produce random or low quality assessments. In particular, for each of the five types of document that we rank, we create randomly select a small subset to manually assess, forming our gold judgement set. In particular, for newswire articles, we created 77 gold documents (4.9% of the total), while for blog posts we created 70 (3.7% of total). For the Digg source we created 88 (4.5% of the total), while we assessed 91 for Twitter (4.6% of the total). Finally, for Wikipedia, we created 50 gold documents (5.1% of the total). These ‘gold’ documents are interspersed with the non-gold documents that each worker assesses. Workers that fail more than 20% of the gold documents are rejected from the evaluation unpaid.
5.7.4
Crowdsourcing Configuration
To crowdsource our relevance labels, we used the CrowdFlower microtask crowdsourcing platform on top of Amazon’s Mechanical Turk (MTurk). We have the documents from each of the five sources assessed separately. Documents from each source are grouped into sets of ten (including a single gold document) forming an MTurk HIT. We pay workers $0.01 (US dollars) per assessment made, hence $0.10 for each HIT. Each document is assessed by three workers. The total cost for crowdsourcing all 24,570 assignments (8190 documents * 3 workers) was $446.53. We do not restrict workers by region, however, we do have three individual workers attempt each. The final assessments produced are the majority vote across the three assessments.
5.7.5
Assessment Quality
We evaluate the quality of the assessments produced by the workers in terms of inter-worker agreement across the three workers that attempted each HIT. A high level of agreement indicates that the final labels are of good quality (see Section 5.3.2). In this case, we report the agreement measure that CrowdFlower provides, namely observed agreement. In this case, the probability of random agreement is the probability of all three workers selecting the same label by chance, i.e. 33%. Table 5.15 reports on a per source basis the number of assessments accrued for each in addition to the average worker agreement across all 199 queries for each source.
126
5.8 Conclusions
Corpus BlekkoN ewsSnippetsApr2012 BlekkoBlogSnippetsApr2012 DiggSnippetsApr2012 T weetsApr2012 W ikiU pdatesApr2012 Total
# Documents 1,553 1,857 1,888 1,990 902 8,190
# Gold 77 70 88 91 50 376
# Assessments 5,245 6,432 6,027 7,722 3,695 29,121
# Agreement 82.62% 71.53% 77.29% 73.43% 77.39% 76.07%
Table 5.15: Statistics of the document relevance assessments produced by MTurk workers. From Table 5.15, we observe that for all five sources, agreement is higher than 71% across the three relevancy labels. This is a high level of agreement that indicates that the resultant assessments are of good quality in comparison to random levels of agreement. The lowest agreement reported is 71.53% for the blog corpus, while the highest agreement was when assessing newswire articles with 82.62% agreement. The higher level of agreement when assessing newswire articles in comparison to tweets or blogs indicates that news articles are easier to assess as relevant or not to a query. Overall observed agreement across sources is 76.07%. Since this is much higher than random agreement, we conclude that the resultant relevance assessments are of sufficient quality to use later in Chapter 9.
5.8
Conclusions
In this chapter, we described ten different datasets from time periods between 2006 and 2012 that we use in our subsequent experimental chapters to evaluate whether the use of user-generated content can aid in satisfying news-related queries submitted to universal Web search engines. In Section 5.2, we listed each of the ten datasets that we use later (see Table 5.2) divided into the four components of our proposed news search framework. Out of the ten datasets, four contain document assessments that we developed using the medium of crowdsourcing. In Section 5.3, we defined what crowdsourcing is and why it is a valuable resource for relevance assessment and detailed the validation strategies the we employ to improve the quality of the assessments produced. Agreement measures that were used to evaluate the quality of those assessments were also described. In Sections 5.4, 5.5, 5.6 and 5.7, we described how we used crowdsourcing to generate assessments for each of the four datasets, totalling over 60,000 individual assessments and a total cost of $1,442.93 (US dollars). In particular, in each section, we described in detail how we developed effective new interfaces for crowdsourcing assessments and then validated the resulting assessments in real-time, enabling the rejection of poor quality work. Furthermore, we closed each of these four sections by evaluating
127
5.8 Conclusions
the quality of the final assessments produced, showing through high levels of inter-worker agreement or accuracy against a ground truth, that the resultant assessments were of sufficiently good quality. In the next chapter of thesis, we examine the Top Events Identification (TEI) component of our news search framework. We use the five datasets that we described in Section 5.2.1 (see Table 5.3), T opN ews−P hase1 dataset that contains newswire article assessments that we including the BlogT rack2011
crowdsourced (see Section 5.4), to evaluate whether important events can be identified accurately using live streams of blog posts or tweets.
128
Chapter 6
Identifying Top News 6.1
Introduction
Previously, in Chapter 4, we proposed a news search framework to describe the process of news search within a universal Web search engine. Within that framework, we identified four components, each responsible for a different task. In this chapter, we investigate the first of these components, namely Top News Identification (see Section 4.5). The aim of this component is to estimate what the most important news stories of the moment are in a fully automatic and real-time manner. This can be seen as a ranking task, whereby a set of news stories are ranked by their current importance. The Top News Identification component is unusual within our news search framework, in that it is not driven by a user-query. Instead, the component maintains an up-to-date ranking of news stories, ranked by their current importance, such that it can be used by other components within the framework. In particular, the rankings produced here are subsequently used within the News Query Classification and News Content Integration components that we examine later in Chapters 7 and 9, respectively. However, ‘current importance’ is challenging to measure, as there are many factors that can influence it, e.g. story prominence, significance and proximity to the reader (Wavelength Media, 2009). As per our thesis statement (see Section 1.3), we propose to leverage real-time discussion in user-generated content sources to estimate the importance of individual news stories. Indeed, there are two key advantages to using user-generated content sources to measure news story importance. Firstly, the fast paced nature of some user-generated content sources, e.g Twitter, may enable breaking news stories to be promoted early in their lifetime, as discussion builds in social media. Secondly, by using the ebb and flow of user discussion, we can help avoid editorial bias observed in newspaper reporting (Sear, 2012). In this chapter, we examine how to effectively rank news stories by their current importance or newsworthiness using discussion about those stories expressed in user-generated content and evaluate
129
6.1 Introduction
how these rankings compare to those produced by newspaper editors. In particular, we propose two types of approach to news story ranking – unsupervised and learning to rank – and then evaluate them on blog and tweet datasets. It is of note that although we motivate this work within the context of a universal search engine, the techniques proposed and evaluated here are directly applicable to news aggregator services and indeed e-newspapers that want to automatically rank their articles by importance (see Section 4.5). The remainder of this chapter is structured as follows. • Section 6.2 details the first of our two types of approach to news story ranking, specifically unsupervised approaches. We propose an adaptation of the Voting Model to measure the recent discussion within user-generated content sources and enhancements to that model. • In Section 6.3, we describe the second of our two types of approach to news story ranking, i.e. learning to rank news stories. In particular, we propose a new news story ranking framework that uses training data to build a news story ranking model combining multiple story ranking approaches with temporal evidence to better estimate the importance of a news story from a usergenerated content stream. • Section 6.4 defines our methodology for evaluating each of the two types of news story ranking approach described in the prior two sections over blog and tweet datasets (see Section 5.2.1). • In Section 6.5, we describe the structure of our evaluation and enumerate the research questions investigated in the following two evaluation sections (Section 6.6 and 6.7). • Section 6.6, the first of the two evaluation sections, evaluates the effectiveness of the news story ranking approaches proposed in Sections 6.2 and 6.3 on a stream of blog data. In particular, we use the TREC 2009 and TREC 2010 top news stories identification task datasets (see Section 5.2.1). • Section 6.7 evaluates the effectiveness of our news story ranking approaches on real-time tweet data. In particular, we use a live stream of tweets from late 2011 and early 2012, in addition to news story rankings from newswire providers (see Section 5.2.1). We evaluate whether our story ranking approaches are effective at estimating the importance of news stories when leveraging large volumes of short tweets. • In Section 6.8, we summarise the findings of this chapter.
130
6.2 Unlearned Story Ranking Approaches
6.2
Unlearned Story Ranking Approaches
The aim of this chapter is to investigate approaches to rank a set of pre-provided news stories by their importance, where importance is estimated using discussion in user-generated content streams (see Section 4.5). Stories are represented as newspaper articles from one or more news providers. One approach to estimate the importance of a news story is by measuring the volume and intensity of discussion about that story. The more a story is discussed, the more important it is considered to be. For example, in the case of the blogosphere, this can be estimated using the number of blogs or individual blog posts that discuss a news story. The first approaches to automatic ranking of news stories using the blogosphere were developed for the TREC 2009 and 2010 Blog track top news stories identification (TNSI) task (Ounis et al., 2010). More information about the TREC Blog track TNSI task and approaches to tackle it (including baselines that we compare to in this chapter) can be found in Section 3.2.3. In this section, we propose our own approaches for automatic news story ranking derived from voting theory (Macdonald, 2009). In particular, in Section 6.2.1, we propose our baseline approach, which we refer to as Votes. We then propose four enhancements to our approach in Sections 6.2.2 to 6.2.5, which take into account the degree of relatedness between posts and each news story (RWA); the length of the news story representation (RWAN); the distribution of related posts to each news story over time (GaussBoost), and the maximum importance observed (MaxBurst), respectively.
6.2.1
Voting for Important Stories (Votes)
To achieve automatic news story ranking, we propose to model a story’s newsworthiness as a voting process (Macdonald & Ounis, 2009). The intuition underpinning our approach is that a blog post related to a news story can be seen as a vote for that story to be important at the time the blog post was published. Hence, by measuring the volume of posts sharing content with a given article around the time of ranking, i.e. the votes, we can estimate the importance of the story. As mentioned earlier, a news story to rank for is described by a news article representation, denoted a, e.g. a headline. To measure the response to such a news article at and before a point in time t, we count the number of related posts to that article that were published during the period of t − r → t. r is a window size, e.g 1 day, that represents recent posts. To operationalise this, an information retrieval (IR) system first selects a fixed number1 of posts R(a, St−w→t ) which are topically related to news article a during the period of t − w → t. w is a time period greater than r and represents the background of posts that are available. Let R(a, St−r→t ) ⊂ R(a, St−w→t ) denote the subset of posts 1 In our later experiments we retrieve 1000 posts per article. An additional analysis of the ranking depth can be found in Appendix A.1.2
131
6.2 Unlearned Story Ranking Approaches
a1 a2
d1 4 1
d2 4 8
d3 2 1
Table 6.1: A sample assignment of votes for two articles (a1 and a2 ) over 3 days (d1 to d3 ). in R(a, St−w→t ) that were published during the smaller time window t − r → t. We consider that R(a, St−w→t ) can be seen as a set of votes for article a as important during for the period t − w → t (the background), while R(a, St−r→t ) can be seen as a set of votes for article a as important during the more recent period t − r → t. By counting the number of votes for article a in the most recent subset (i.e. |R(a, St−r→t )|) we can estimate the article’s importance for the period r. Consequently, using this voting-like approach (Macdonald, 2009), which we refer to as Votes, the score for each article a is calculated as: score(a, S, t, w, r) = |R(a, St−r→t ) ⊂ R(a, St−w→t )|
(6.1)
where a is the newswire article to rank for, S is the source to rank documents from, t is the ranking time, w is the size of the time window from which to rank and r is size of the smaller window considered recent. To build the final ranking of articles for time t, denoted I (see Section 4.4), we compare the number of votes for all articles a ∈ A, i.e. we rank by score(a, S, t, w, r). We refer to this story ranking approach throughout this thesis as Votes. Note that this is a three-stage process. Firstly, for each news article a, we retrieve related posts from the background window w in stream S. Next, we find the subset of those posts that we consider recent, as defined by the period t − r → t, and count them to form a score. Lastly, we rank all articles a ∈ A by the number of votes (score) they received. To illustrate our approach, we give a short example of Votes for two news articles (a1 and a2 ) and 3 days (d1 to d3 ), i.e. r = 1day and three values for t are defined corresponding to three days. For each article, a ranking of the top 10 posts is analysed, and then votes are assigned to the various days. Table 6.1 shows, for each article (row), the number of votes for each of the 3 days. From this example, we can see that a1 received 4 votes on days d1 and d2 , in contrast to only 2 votes on d3 . Article a2 obtained 8 votes on d2 but only 1 on days d1 and d3 . Hence, to find the most important news article on d1 (first column), a1 would be ranked higher than a2 , since a1 received more votes. Similarly, for d2 (second column), a2 would be the most important news story.
6.2.2
Relevance Weighted Aggregation (RWA)
Our Votes approach described above, considers all posts returned in R(a, St−r→t ) to be equally relevant to the news article a. However, in a fast paced real-time setting, where a news article has just broken,
132
6.2 Unlearned Story Ranking Approaches
there may be few relevant posts to return. In cases where there is little or no related discussion (so far), the majority of posts returned in R(a, St−r→t ) will be irrelevant to the news story and retrieved only due to chance matching of terms from that story. In these cases, under Votes, the score for a story can be highly misleading, as it assumes that the posts in R(a, St−r→t ) discuss the news story. To counteract this, we propose an enhanced variant of Votes, which incorporates the relevance of a post to the news story. In particular, we propose to weight each post by the degree to which it is related to the story. In this way, for cases where there are few relevant posts, and hence the story should be considered unimportant due to a lack of related discussion, the low retrieval scores for non-relevant posts assure that the story will receive an overall low score. In particular, the weight for each post becomes equal to its relevance score, while the newsworthiness for the story becomes the sum of the scores of the posts returned. We refer to this enhanced story ranking approach as Relevance Weighted Aggregation (RWA), which is defined as follows: P p∈R(a,St−r→t )⊂R(a,St−w→t ) score(a, p) score(a, S, t, w, r) = |R(a, St−w→t )|
(6.2)
where a is a story, R(a, St−r→t ) is the set of posts returned for a and score(a, p) is the retrieval score (e.g. using a document weighting model – see Section 2.3) for post p ∈ R(a, St−r→t ) ⊂ R(a, St−w→t ). We hypothesise that this aggregation approach should be more effective than Votes, because it incorporates not only the volume of discussion about a news story, but also the likelihood that the post is about article a. This should avoid overemphasising the importance of a news story in cases where many non-relevant or weakly relevant documents are returned in R(a, St−r→t ).
6.2.3
Story Length Normalisation (RWAN)
Next, we propose an enhancement to the RWA, denoted RW AN , that takes into account the length of the story representation. The intuition is that the length of each news story should act as a normalising factor on the score for each news story, as when comparing across news stories, the longer news story representations will naturally receive higher scores under RWA as they are based upon the SUM of the retrieval scores of each individual document. This results because longer news story representations typically lead to larger document (post) scores, because they in turn are dependant upon the SUM of the scores for each individual term in the document retrieved. The aim is to avoid favouring stories with longer news story representations. In particular, we add a story length component to RWA to normalise out the differing lengths of individual headlines as follows: P 1 p∈R(a,St−r→t )⊂R(a,St−w→t ) score(a, p) score(a, S, t, w, r) = · |a| |R(a, St−w→t )|
133
(6.3)
6.2 Unlearned Story Ranking Approaches
Figure 6.1: Example of Gaussian curves with varying values of l (the Gaussian curve width). Note that for illustration clarity, weights have been normalised so that ∆t = 0 will always be assigned a weight of 1. where
1 |a|
is the added normalisation component and |a| is the number of terms in the newswire article
representation a.
6.2.4
Temporal Promotion (GaussBoost)
Thus far, we have made use of evidence from only the time period preceding t defined by r. However, historical evidence may also help to improve the accuracy of Votes, RWA or RWAN. In particular, news stories may be discussed beforehand for predictable events, e.g. speculation about election results, and/or discussed afterwards for long running, controversial or important unpredictable stories, e.g. the aftermath of a terrorist bombing. By taking this evidence into account, we may be able to identify those stories that maintain their interest over time, and as such can be deemed more important. Kleinberg (2002) suggested that bursts in term distributions could last for a period of time. Hence, in the following, we define an alternative technique for calculating score(a, S, t, w, r), which leverages the temporal distribution of each article a over time. This technique additionally accumulates vote evidence from the period preceding t − r, to ‘boost’ the score of articles which retain their importance over time. In our proposed temporal distribution boosting technique, denoted GaussBoost, we consider the background related document set R(a, St−w→t ) to be comprised of n equal parts covering periods of size r, starting at time t. These parts are referred to as temporal units (of size r). Votes or RWA work exclusively on the most recent of these temporal units before t. In contrast, GaussBoost weights documents (posts) based on the time elapsed from t, using a Gaussian curve to define the magnitude of emphasis. In this way, we state a preference for stories that were important during periods close to t, rather than stories which peaked some time before t:
134
6.2 Unlearned Story Ranking Approaches
score(a, S, t, w, r) =
X
Gauss(∆t) · |R(a, St−r∗(∆t+1)→t−r∗∆t ) ⊂ R(a, St−w→t )|
(6.4)
0