Col: “Although the section on Statistical Software of the Journal of Computational
and Graphical Statistics may be changing this.” Cam: “Serious computing is a ...
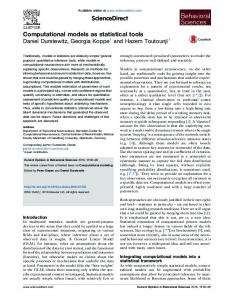
A joint newsletter of the Statistical Computing & Statistical Graphics Sections of the American Statistical Association.
Summer 2002 Vol.13 No.1
A WORD FROM OUR CHAIRS
Statistical Computing
Susan Holmes is the 2002 Chair of the Statistical Computing Section.
I’m writing my first column for the 2002 as chair of computing, although we have already met in these columns as I have been editor for the section for more than a year now. As I scramble to find time to do my own research on the bootstrap and its applications to biology, in particular the problem of phylogenetic trees, I am confronted more and more by the digital divide that separates me from the community for which I have chosen to work: biologists. I have been collaborating with biologists for more than 20 years now, and even my initial venture involved statistical computing, since at the time I helped develop software for teaching multivariate analysis using the Apple II. In 2002, we have many more tools available to the specialists in statistical computing, as professionals we use C++, Java, R/Splus or matlab, but our research only trickles down to scientists very slowly. R in particular has been making leaps and bounds towards the biological and medical community as the project Bioconductor has emerged for analyzing microarrays, and two very nice Mac versions (one for Mac OS 9 and one for Mac OS X) of R now available to the Mac-bios.
Statistical Graphics
Steve Eick is the 2002 Chair of the Statistical Graphics Section. It is my pleasure to be your graphics section president this year and one of the honors that goes with the office is to write a short message to the members. Mario Peruggia pulled together a great Graphics program for the JSM this summer. For more details, see his write-up later in this newsletter. The Stat Graphics and Computing Meeting is Monday night at the JSM. It’s always fun, good food, interesting door prizes, please come. The world has certainly become much more dangerous than last year. For us in the high-tech industry, the current sharp recession has made life interesting, challenging, and highly distracting for me on a personal level. Being an executive at a high-tech company during a period when capital spending for software essentially freezes is really tough an experience I wish never to have again. One a positive note, however, the need for statistical graphics and visualization continues to increase. Spending freezes are lifted eventually. Interesting computers are inexpensive and conductivity is becoming ubiquitous. At a fundamental level, every nine months the amount of data stored on disk doubles, a trend that is likely to continue for another decade. The technical, business, and research challenge is how to
SPECIAL ARTICLE
“Its Just Implementation!” Di Cook (
[email protected]), Igor Perisic (
[email protected]), Duncan Temple Lang (
[email protected]), Luke Tierney (
[email protected]) Col says: “I just got off the phone with my sister. I called to wish her happy birthday but before long the conversation shifted from fun topics and onto workrelated topics. She has a PhD in entomology and works on phylogeny of insects based on genetic information. In our conversation she revealed that she was doing ‘Bayesian inference using Markov Chain Monte Carlo’. I was stunned! I asked her how she heard of these techniques, was she working with some of the excellent statisticians on campus, ... Her response was that she had read a couple of papers that mentioned the methods, and then did an internet search for software. The search yielded two packages Mr Bayes (http://morphbank.ebc.uu.se/mrbayes/) and ‘PAUP’ (http://paup.csit.fsu.edu/about.html). She has been testing both programs on her data. (And she has bought herself a dual-process, large memory Mac to do the testing!) Software is a major communication tool today. It is common that people download publicly available software to experiment with new methodology. They may even be motivated to then read the associated literature and learn about the methods. But software is becoming a major entry point into new research.” Cam says: “The development of prominent statistical software systems such as S, XGobi, (SPSS, etc.) have been done fortuitously and in very special environments that may not be reproducible. We need to find a way to make such breakthroughs more likely to occur.” Col: “Statistical software breakthroughs have historically occurred under the nurturing of liberal research departments in commercial companies and its still occurring in places such as Lucent Bell Labs. But support for liberal research is dwindling in the face of demands for short-term accountability and productivity. Its going to be important for academia to develop research environments that facilitate computational breakthroughs.” Ric says: “If we want to give some academic value to code that is freely distributed within say R or ... Then we still do have a problem of communicating its value to the statistical community.” Kel says: “My view is that at this point many depart2
Statistical Computing & Statistical Graphics Newsletter
Vol.13 No.1
ments would in principle like to consider software development as part of research and scholarly work but do not really know how to make the case among themselves, i.e. for departmental promotion recommendations, or to the college level.” Col: “The provost at Institution X verbally supported the inclusion of software research in faculty promotion decisions, if we can tell them how it should be counted.” Liam says: “The key to accountability is peer evaluation. Technical papers have a peer evaluation process, software does not.” Col: “Although the section on Statistical Software of the Journal of Computational and Graphical Statistics may be changing this.” Cam: “Serious computing is a considerably timeconsuming endeavor. Unfortunately, we are at a point where there are different generations of statisticians cohabiting the field with very different experiences. Now, almost all graduate students will be experienced with the computer. However, their advisors will be less familiar. Importantly, many of these more senior members will be less aware of a) the learning curve and general day-to-day complexity of computer programming, and b) are not able to necessarily identify or appreciate well-written programs that support easy modification, etc. The effect is often to ‘encourage’ people to write code quickly and often rather than to stop and think about how to write good software once (or twice :-)). We don’t want to necessarily move away from ad hoc statistical software development. Rather we want to encourage good statistical computing practice research and innovation. One aspect of good practice involves re-using what is already there (and hence leveraging and integrating with existing tools)..... The requirement that people survey the existing ‘literature’ in the area and reference and build on it is vital to any academic discipline. It is an area where we in statistical computing have not been very rigorous, to our detriment. We don’t want to give people the impression that there is a single way to do things. Just that there is level or standard of software that needs to be considered. It is clear that there is a growing awareness and appreciation of statistical computing research. However, given that it is a reasonably new endeavor, there is less understanding of how to evaluate this type of research, especially when considering hiring and promotion of faculty. In order to count these new ‘beans’, we need to help evaluate statistical computing research.” Background: A year ago the American Statistical Association section on Statistical Graphics and Comput-
ing held a workshop on the future of statistical computing in conjunction with the Interface between Computer Science and Statistics. A summary of the workshop was published in the Statistical Computing and Graphics newsletter, volume 11, issue 1 (2001). The workshop grew out of concerns for the status of computing in the Statistics community. One of the topics discussed was how to improve the recognition of software research in academia: when recruiting graduate students, in assessing student’s research, when considering new candidates for positions, promoting and rewarding faculty. These comments here are a snapshot of discussions that have been occurring in email since the workshop. Duncan Temple Lang, Luke Tierney, Igor Perisic and Di Cook ‘volunteered’ to write a document describing approaches to evaluate statistical computing and graphics research. Its turned out there’s been some considerable difference of opinion on the direction of the article. We first began to develop a ‘check list’ of items that could frame a work of software or place it in context. The check list grew from the experiences of the John Chambers award committee last year. Here are some comments that arose after this original draft was distributed... Kel: “I think a check list is a bad idea for two reasons. One is that software development is too heterogeneous for a single check list to work for all cases, much like research papers are too heterogenous (you can’t write a check list that asks 1) how many theorems, 2) how many plots, 3) how many figures or some such and hope to get anything useful out of it. The other reason is that the target audience, faculty who are evaluating someone who does software research but don’t do software development themselves, may not be able to appropriately use such a list even if we could present them with one.” Ric: “I’d agree with you here in the sense that you will not judge if a code is ‘useful’ or .. by a check list, but there are accepted standards within each type of publication. Research papers follow some rules which although often implicit are nevertheless present. Say for example, you should be able to read the paper and understand what it is all about or that it starts with an abstract and intro, and so on ... The idea is similar to the fact that a great idea/result still needs to be clearly transcribed in order to make a good paper. Now, we all know that departments hold lists of at least top-tier/middle tier/lower tier publications. So the problem becomes how we can match this list to software/code. How should a published code be valued? Does it matter if it is available only from your web page as opposed to the official page of ... which is ‘filtered’?
The peculiarity of code is that a lot of public code is managed by a reputation management scheme that is automatic. i.e. you can publish your code and new code but it will get less and less used/downloaded if it is shoddy. In this regard the task that we would have here is, how do we tell evaluating faculty members that this software development is worthy? ” Col: “Developing software is often viewed to be primarily implementation, a less than creative, respectable endeavor. This is a misguided opinion. Creating software commonly involves ingenuity, good computing literacy and awareness of the current computational technology. It takes considerable skill to develop a framework for statistical computations, especially in interactive and dynamic environments. I’m concerned that we are not adequately including enough people with sophisticated computing expertise in academia. How do we encourage creative research in statistical computing and graphics in academia?” Kel: “Most universities will have other departments that face similar issues, such as performing arts where performance evaluations may figure into promotion decisions, and finding out what the locally appropriate mechanisms are is one useful recommendation.” Cam: “There are many different areas of statistical computing. In the past we have focussed on the important field of algorithms, numerical analysis, etc. These are the more traditional computational equivalents of mathematical theory. While development of systems (e.g. S, XGobi, XLisp-Stat, etc.) has been rarer for obvious reasons, these haven’t been as widely recognized as ‘regular research’. Similarly, practical parallel and distributed computing, integration and computer automation are important but less visible aspects of computing that we leave to other disciplines. We need to find a way to encourage such research within the statistical community. And more important, a very insightful view of how to use existing code in a different way is great statistical computing research but doesn’t necessarily provide any code. As we move more and more towards component based software, the focus will be on the way we glue them together.” Col: “Software is a major communication device in the electronically connected global community. Making software available on the web puts a methodology into the public domain in a usable form. Software is often the first entry point for analysts to new methodology, and ideally encourages the user to learn more about the methods.” Vol.13 No.1
Statistical Computing & Statistical Graphics Newsletter
3
Kel: “Making software available on the web should count as a bean.” Kel: “Where we can help is: • to have a statement by a top professional organization like ASA that explicitly identifies software development as a form of research and scholarly work worthy of reward and consideration in promotion decisions that departments can use to back up using this as part of their evaluation. • to recommend in broad terms how departments can put together evaluations of software by obtaining peer reviews of the software from qualified experts in the field. • to come up with a mechanism that can help departments identify appropriate individuals who can be commissioned to write peer reviews of software contributions that are part of promotion cases.” Ric: “This suggests that we do need to make a case for software development. If so, then I fully agree with it. But this would require that we define what software development (for the ASA) is.” Rob says: “Evaluating the Chambers award submissions is really tough. The software is usually part of a student’s PhD work, so it’s very specialized. The letters that accompany the software almost never mention the software design, or its quality or degree of difficulty; the advisors may talk about usability or impact, but often they’re more interested in discussing the mathematics (or in their own research!) than anything else. Finally, the judges don’t have explicit guidelines, so the judging process is very intuitive and subjective. A different set of judges could easily rank the work very differently.” Cam: “One thing that comes to mind is that I don’t think we would give a seminar that describes the details of the software and its configuration and its documentation. Instead, we would pose the problem the software addresses and show how it solves that problem, how it can be used for other problems, how it relates to other software in that domain and other domains that form other stages of the problem. In other words, we describe the high-level concept, not the details of the implementation. And that is a difference between the ‘code’ and the idea or the research.” Col: “Why isn’t it ok to discuss the software structure in a seminar? Traditionally it been ok to discuss a mathematical proof in a seminar, although it is now much preferred to listen to an outline of a proof rather than to the tedious details. Full proofs can be read at leisure at a later point. It seems appropriate that issues of software 4
Statistical Computing & Statistical Graphics Newsletter
Vol.13 No.1
design, and particularly difficult parts to code, should be communicated in a seminar. It may even be good to show code fragments sparingly. How else does the community learn about good coding practices? But back to evaluating software work as an expression of statistical computing research... It is important to have a framework or definitions from which to evaluate the work. A framework gives people a place to start, and a context in which to assess the relevance of the work. In evaluations for grants, promotion and awards there are usually standards to follow. They are usually not as detailed as a checklist might be. Sometimes evaluation takes the form of an ‘expert’ panel discussion with very few guidelines, and then there is a danger that a strong opinion can determine the outcome of the committee’s decision. A checklist can constrain and divert the discussion. They can be good and bad, but they are most useful when the committee does not have much expertise in the area. That is the case in statistical computing so having some areas to focus the conversation can be helpful. One would never start a paper without telling the reader what it was about in a general sense first. How can we expect software to be evaluated if we don’t define what we mean by software? As an evolving new, yet old, discipline it is fruitful to re-define the parameters from those that defined statistical computing in the past.” Summary: So a year after the workshop we are still debating aspects of statistical computing. The purpose of this document is to raise the awareness, communicate some of the discussion and open the discussion to the statistical computing and graphics community. There are some deliberately provocative statements, and there are numerous open questions: What is statistical computing research? graphics research?
statistical
How do we assess research involving software development? How do we encourage academic departments to hire and be supportive of computationally literate faculty? What measures can be used to evaluate statistical computing research? If you would like to contribute to the discussion, provide answers to any of these questions or ideas related to the issues raised here please email the authors. We may provide a public forum if enough insightful email results.
Editorial We are doing better this year in getting an issue out before the JSM ’02 in New York City. We’re hoping for 2 issues this year, a marked improvement on last year’s effort. This issue contains information on the JSM ’02 events for the Statistical Computing and Graphics sections, a continuation of the report from the Workshop on Statistical Computing in Academia, an article on bootstrapping and more articles on statistical software continuing the section from last issue. If you have articles on software to contribute to the next issue please submit them. We’re also interested in articles from any area of statistical computing or graphics. Send them down!
dent to design a series of posters on statistical graphics. The idea is to profile a variety of graphics techniques, for example, scatterplot matrix, tours, parallel coordinate plots, on visually attractive posters. The posters would be made available to the members of the Statistical Graphics section for free and the general community for a small charge. We envision perhaps 5 posters in all. Di would like to hear suggestions for graphical methods that could be featured, explanations of techniques, or design ideas. The editors would like to thank contributors to this issue and request submissions in the form of papers for the next newsletter, to appear at the end of 2002.
Di has a request from the readership. This coming academic year she will be working with a graduate stu-
FROM OUR CHAIRS (Cont.). . .
Statistical Computing CONTINUED FROM PAGE 1
As we work more often with the large genetic databases, interfacing our usual tools with these databases seems essential. Some statisticians have chosen Perl/Bioperl or Python/Biopython for their interfaces, both communicate easily with R through the Omegahat tools. Now all we need now is develop some GUI’s so our users don’t have to deal with all the intricacies of command line interfaces, and teach them some more statistics so they can understand all our wonderful pictures! One of the most difficult part of my job as section chair has been interacting with the central administration of the ASA. It was extremely difficult this year to round up up a complete roster of possible volunteers for the various offices up for election and prepare for the JSM meetings. I must thank all the volunteers who helped me put this list together, in particular Mark Hansen, our past chair, but also the many people I contacted when I was trying to build our list; those on the lists Alfred O. Hero III, Carey E. Priebe, Jun Liu, David Madigan, Tim Hesterberg, R. Webster West, Vincent J. Carey, Roger Koenker, and even some who we hope to invite in the near future- in particular, Chris Genovese. As a plea to our members, please make yourself known to us if you would like to particpate more in our activities, we would love to have you on board! We are all looking forward to the JSM and seeing you
Susan Holmes and Dianne Cook
all again at the mixer. The meeting has been carefully planned so you can enjoy New York and all the wonderful sessions put together for us by Tim Hesterberg. Now back to my laptop, happy that it can now hold a 1GB database and all the Python/R tools necessary to analyze the data, last night while I was working, the computer on my lap (as is wont of a laptop) I was even more worried than usual that the data had become too much to handle, there was a definite overflowing feeling coming from all those loops?? But no, it was only one of our small California quakes reminding me that there are other things around us that are just as exciting! Susan Holmes, Chair, Statistical Computing Section,
[email protected]
Statistical Graphics CONTINUED FROM PAGE 1
make sense of this information in a way that leads to actions that create value. One obvious opportunity is to build visual analytic applications that package sophisticated analyses for broad usage within the technical community. It seems clear that there will be a need for many such applications over the next few years. For me, I’m onto my next startup, Visintuit. There is a story behind the name that I’ll save for another day. By the way, it seemed like Visintuit was the only domain name that wasn’t taken. Our idea is to apply visualization and analytical techniques to understand a particular class of financial data. Why financial data? As Willy Vol.13 No.1
Statistical Computing & Statistical Graphics Newsletter
5
Sutton said, “that’s where the money is”. Working for a startup is really hard. The best part is that there are no rules. The worst part, so far, is that we have no revenues, although we’re moving nicely to change this. Life is fun and it’s a great time to be doing statistical graphics. I’m looking forward to seeing everyone in NYC this August. If you don’t see me, it means that I may have failed to solve our revenue problem. Please consider getting involved with section activities. The health of
An Introduction to the Bootstrap with Applications in R A. C. Davison and Diego Kuonen
[email protected]
Introduction Bootstrap methods are resampling techniques for assessing uncertainty. They are useful when inference is to be based on a complex procedure for which theoretical results are unavailable or not useful for the sample sizes met in practice, where a standard model is suspect but it is unclear with what to replace it, or where a ‘quick and dirty’ answer is required. They can also be used to verify the usefulness of standard approximations for parametric models, and to improve them if they seem to give inadequate inferences. This article, a brief introduction on their use, is based closely on parts of Davison and Hinkley (1997), where further details and many examples and practicals can be found. A different point of view is given by Efron and Tibshirani (1993) and a more mathematical survey by Shao and Tu (1995), while Hall (1992) describes the underlying theory.
Basic Ideas The simplest setting is when the observed data y1 , . . . , yn are treated as a realisation of a random sample Y1 , . . . , Yn from an unknown underlying distribution F . Interest is focused on a parameter θ, the outcome of applying the statistical functional t(·) to F , so θ = t(F ). The simplest R example of such a functional is the average, t(F ) = y dF (y); in general we think of t(·) as an algorithm to be applied to F . The estimate of θ is t = t(Fˆ ), where Fˆ is an estimate of F based on the data y1 , . . . , yn . This might be a parametric model such as the normal, with parameters estimated by maximum likelihood or a more robust method, Statistical Computing & Statistical Graphics Newsletter
Stephen G. Eick, Ph.D. Co-founder and CTO Visintuit
[email protected] 630-778-0050
or the empirical distribution function (EDF) Fˆ , which puts mass n−1 on each of the yj . If partial information is available about F , it may be injected into Fˆ . However Fˆ is obtained, our estimate t is simply the result of applying the algorithm t(·) to Fˆ .
TOPICS IN STATISTICAL COMPUTING
6
our section, one of the largest in ASA, depends on volunteers.
Vol.13 No.1
Typical issues now to be addressed are: what are bias and variance estimates for t? What is a reliable confidence interval for θ? Is a certain hypothesis consistent with the data? Hypothesis tests raise the issue of how the null hypothesis should be imposed, and are discussed in detail in Chapter 4 of Davison and Hinkley (1997). Here we focus on confidence intervals, which are reviewed in DiCiccio and Efron (1996), Davison and Hinkley (1997, Chapter 5) and Carpenter and Bithell (2000).
Confidence Intervals The simplest approach to confidence interval construction uses normal approximation to the distribution of T , the random variable of which t is the observed value. If the true bias and variance of T are b(F ) = E(T | F ) − θ = E(T | F ) − t(F ), (1) v(F ) = var(T | F ), then we might hope that in large samples T − θ − b(F ) . Z= ∼ N (0, 1); v(F )1/2 the conditioning in (1) indicates that T is based on a random sample Y1 , . . . , Yn from F . In this case an approximate (1 − 2α) confidence interval for θ is t−b(F )−z1−α v(F )1/2 ,
t−b(F )−zα v(F )1/2 , (2)
where zα is the α quantile of the standard normal distribution. The adequacy of (2) depends on F , n, and T and cannot be taken for granted. As it stands (2) is useless, because it depends on the unknown F . A key idea, sometimes called the bootstrap or plug-in principle, is to replace the unknown F with its known estimate Fˆ , giving bias and variance estimates b(Fˆ ) and v(Fˆ ). For all but the simplest estimators T these cannot be obtained analytically and so
simulation is used. We generate R independent bootstrap samples Y1∗ , . . . , Yn∗ by sampling independently from Fˆ , compute the corresponding estimator random variables T1∗ , . . . , TR∗ , and then hope that . b(F ) = b(Fˆ ) = E(T | Fˆ ) − t(Fˆ )
(4)
r=1
. v(F ) = v(Fˆ ) = var(T | Fˆ ) . =
1 R−1
R X
(Tr∗ − T¯∗ )2 .
(5) (6)
r=1
There are two errors here: statistical error due to replacement of F by Fˆ , and simulation error from replacement of expectation and variance by averages. Evidently we must choose R large enough to make the second of these errors small relative to the first, and if possible use b(Fˆ ) and v(Fˆ ) in such a way that the statistical error, unavoidable in most situations, is minimized. This means using approximate pivots where possible. If the normal approximation leading to (2) fails because the distribution of T − θ is not close to normal, an alternative approach to setting confidence intervals may be based on T −θ. The idea is that if T ∗ −t and T −θ have roughly the same distribution, then quantiles of the second may be estimated by simulating those of the first, giving (1 − 2α) basic bootstrap confidence limits ∗ t − (T((R+1)(1−α)) − t),
Bootstrapping in R
(3)
R
X . = R−1 Tr∗ − t = T¯∗ − t,
that BCa intervals are shorter than studentized ones, so they undercover by slightly more.
∗ t − (T((R+1)α) − t),
∗ < · · · < T ∗ are the sorted T ∗ ’s. When an whereT(1) r (R) approximate variance V for T is available and can be calculated from Y1 , . . . , Yn , studentized bootstrap confidence intervals may be based on Z = (T − θ)/V 1/2 , whose quantiles are estimated from simulated values of the corresponding bootstrap quantity Z ∗ = (T ∗ − t)/V ∗1/2 . This is justified by Edgeworth expansion arguments valid for many but not all statistics (Hall, 1992).
Unlike the intervals mentioned above, percentile and bias-corrected adjusted (BCa) intervals have the attractive property of invariance to transformations of the parameters. The percentile intervals with level (1 − 2α) is ∗ ∗ (T((R+1)α) , T((R+1)(1−α)) ), while the BCa interval has ∗ ∗ form (T((R+1)α0 ) , T((R+1)(1−α00 )) ), with α0 and α00 cleverly chosen to improve the properties of the interval. DiCiccio and Efron (1996) describe the reasoning underlying these intervals and their developments. The BCa and studentized intervals are second-order accurate. Numerical comparisons suggest that both tend to undercover, so the true probability that a 0.95 interval contains the true parameter is smaller than 0.95, and
R (Ihaka and Gentleman, 1996) is a language and environment for statistical computing and graphics. Additional details can be found at www.r-project.org. The two main packages for bootstrapping in R are boot and bootstrap. Both are available on the ‘Comprehensive R Archive Network’ (CRAN, cran.rproject.org) and accompany Davison and Hinkley (1997) and Efron and Tibshirani (1993) respectively. The package boot, written by Angelo Canty for use within S-Plus, was ported to R by Brian Ripley and is much more comprehensive than any of the current alternatives, including methods that the others do not include. After downloading the package from CRAN and installing the package, one simply has to type require(boot) at the R prompt. Note that the installation could also performed within R by means of install.packages(boot) A good starting point is to carefully read the documentations of the R functions boot and boot.ci ?boot ?boot.ci and to try out one of the examples given in the ‘Examples’ section of the corresponding help file. In what follows we illustrate their use.
Example Figure 1shows data from an experiment in which two laser treatments were randomized to eyes on patients. The response is visual acuity, measured by the number of letters correctly identified in a standard eye test. Some patients had only one suitable eye, and they received one treatment allocated at random. There are 20 patients with paired data and 20 patients for whom just one observation is available, so we have a mixture of paired comparison and two-sample data.
blue