ARTICLE INFORMATION Received: 28 September 2012
© 2013 The Authors
Revised: 6 January 2013
Accepted: 16 January 2013
doi: 10.1259/bjr.20120500
Cite this article as: Dobeli KL, Lewis SJ, Meikle SR, Thiele DL, Brennan PC. Noise-reducing algorithms do not necessarily provide superior dose optimisation for hepatic lesion detection with multidetector CT. Br J Radiol 2013;86:20120500.
Noise-reducing algorithms do not necessarily provide superior dose optimisation for hepatic lesion detection with multidetector CT 1,2,3 1,2
K L DOBELI, MSc, 1,2S J LEWIS, PhD, P C BRENNAN, PhD
1,2
S R MEIKLE, PhD, 4D L THIELE, PhD and
1
Medical Image Optimisation and Perception Group (MIOPeG), Medical Imaging & Radiation Sciences Faculty Research Group, Faculty of Health Sciences, University of Sydney, Sydney, Australia 2 Brain and Mind Research Institute, University of Sydney, Sydney, Australia 3 Department of Medical Imaging, Royal Brisbane & Women’s Hospital, Brisbane, Australia 4 Biomedical Technology Services, Queensland Health, Brisbane, Australia Address correspondence to: Ms Karen L. Dobeli E-mail:
[email protected]
Objective: To compare the doseoptimisation potential of a smoothing filtered backprojection (FBP) and a hybrid FBP/iterative algorithm to that of a standard FBP algorithm at three slice thicknesses for hepatic lesion detection with multidetector CT. Methods: A liver phantom containing a 9.5-mm opacity with a density of 10 HU below background was scanned at 125, 100, 75, 50 and 25 mAs. Data were reconstructed with standard FBP (B), smoothing FBP (A) and hybrid FBP/iterative (iDose4) algorithms at 5-, 3- and 1-mm collimation. 10 observers marked opacities using a four-point confidence scale. Jackknife alternative freeresponse receiver operating characteristic figure of merit (FOM), sensitivity and noise were calculated.
Results: Compared with the 125-mAs/5-mm setting for each algorithm, significant reductions in FOM (p,0.05) and sensitivity (p,0.05) were found for all three algorithms for all exposures at 1-mm thickness and for all slice thicknesses at 25 mAs, with the exception of the 25-mAs/5-mm setting for the B algorithm. Sensitivity was also significantly reduced for all exposures at 3-mm thickness for the A algorithm (p,0.05). Noise for the A and iDose4 algorithms was approximately 13% and 21% lower, respectively, than for the B algorithm. Conclusion: Superior performance for hepatic lesion detection was not shown with either a smoothing FBP algorithm or a hybrid FBP/iterative algorithm compared with a standard FBP technique, even though noise reduction with thinner slices was demonstrated with the alternative approaches.
K L Dobeli, S J Lewis, S R Meikle et al
Advances in knowledge: Reductions in image noise with non-standard CT algorithms do
CT is a valuable diagnostic tool; nevertheless, it delivers a high radiation dose compared with other imaging modalities [1, 2]. Estimates of radiation risk from CT examinations based on dose surveys from the 1990s and data from atomic bomb survivors suggest that approximately 60–100 cancers are induced for every million CT examinations performed [3–6]. Significant global increases in collective CT dose over the past two decades [7–9] and recent direct evidence of increased cancer incidence in a cohort of patients who had CT imaging when they were 21 years of age or younger [10] indicate that optimisation of CT acquisition protocols is required [3, 7]. Unlike film-screen radiography, where excessive exposure is readily perceived by the film’s optical density, there are no such visual indicators in CT, and there is a paucity of data defining appropriate dose levels while maintaining clinical effectiveness [11]. The current work endeavors to address this deficiency within the context of hepatic lesion detection. The limited attenuation difference that can often occur between hepatic lesions and the surrounding normal liver tissue [12] may compromise dose optimisation since high exposures aimed at reducing image noise and maximising low-contrast resolution may be required [13].
not necessarily translate to an improvement in low-contrast object detection.
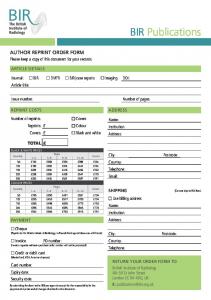
In this phantom study, we compare the doseoptimisation potential of a smoothing and a hybrid reconstruction algorithm to that of a standard algorithm at three different slice thicknesses for hepatic lesion detection with multidetector CT (MDCT). METHODS AND MATERIALS A liver lesion phantom (Spiral/helical CT phantom, Model 061; Computerized Imaging Reference Systems, Inc., Norfolk, VA) was scanned using a 64-slice CT system (Brilliance 64; Philips Medical Systems, Cleveland, OH). The phantom consisted of an 18-cm diameter polymer disc, which contained within its central plane three rows of spheres ranging in size from 2.4 to 9.5 mm in diameter with CT density 5, 10 or 20 HU below that of the liver-equivalent (50 HU) background (Figure 1). The focus here was on the 9.5 mm/10 HU opacity (Figure 1, arrow) because liver lesions ,10 mm in size are rarely of diagnostic significance for routine abdominal CT examinations [16] and 10 HU is generally considered the minimum lesion-to-liver contrast required to be detected with CT [17]. The phantom was scanned five times at each of the five exposure settings (125, 100, 75, 50, 25 effective mAs) Figure 1. An image of the phantom through the midline of the opacities. The opacity under investigation is indicated (arrow).
Two key operator-selectable parameters that affect image noise and influence the level of exposure required for accurate lesion detection are slice thickness and the reconstruction algorithm. Thinner slices reduce partial volume effects and can improve lesion detection, yet unless a compensatory increase in exposure is made, the resultant images have higher noise levels, which may offset any advantage in lesion conspicuity provided by the reduction in slice thickness. Traditional low pass or smoothing algorithms can be used in combination with thinner slices to offset noise increases; however, these algorithms also reduce spatial resolution [14]. Alternatively, recently developed hybrid reconstruction algorithms using iterative techniques have the potential to facilitate thin slices without noise increase [15]; however, studies investigating the interaction between algorithm, slice thickness and exposure when optimising hepatic CT protocols are required.
2 of 8
bjr.birjournals.org
Br J Radiol;86:20120500
Dose optimisation for hepatic lesion detection
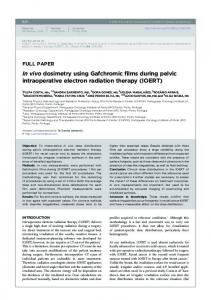
and the data reconstructed at three slice thicknesses (5, 3 and 1 mm) using the following three reconstruction methods: filtered backprojection (FBP) using the standard body (B) algorithm, FBP using a smoothing body (A) algorithm and a hybrid reconstruction method utilising FBP with the B algorithm and an iterative reconstruction algorithm (iDose4 with strength 3 noise reduction [18]). Data were presented with 50% image overlap and 350-mm display field of view. An image containing the background disc and a single randomly positioned opacity was generated for each series by electronically cutting an 18-mm region of interest (ROI) containing the opacity from the image reconstructed through the midline of the phantom. This ROI was then pasted on a distal image from the same series that contained only the background disc at a position that was at an equal distance from the outer perimeter of the phantom as the cut opacity to standardise spatially dependent noise variations (Figure 2). 25-mm-diameter ROIs were then placed over the opacity and the minimum, maximum and standard deviation of the pixel values compared between the edited and the original images, which confirmed that the editing process did not change the appearance of the background or the opacity. Five edited images were created for each algorithm/mAs/ slice thickness combination, resulting in a total of 225 Figure 2. An edited image containing a pasted opacity (arrow).
images containing the opacity. These images were randomly combined with 450 background-only images. All images were reviewed on a diagnostic display station (DS3000; Agfa, Mortsel, Belgium) by 10 observers, who marked each perceived opacity using the inbuilt ROI tool and scored their level of confidence using the following scale: 15opacity not visible, 25opacity possibly visible, 35opacity probably visible and 45opacity definitely visible. A true-positive mark-up was declared if the centre of a ROI was ,20 pixels distant from the centre of the true opacity. Observers had between 6 and 20 years’ experience in viewing abdominal CT images (average 12.4 years) and were blinded to the presence and location of the opacity. Images were presented to each observer in a randomised order. Ambient light in the viewing area was between 25 and 40 lux [19], and the display monitor was calibrated prior to each reading session. Statistical analyses The evaluation of specific exposure and slice thickness combinations for each algorithm and the assessment of different algorithms was based on comparisons with the departmental standards of 125 mAs and 5-mm slice thickness setting and the B algorithm, respectively. The comparisons used the following methods: 1. Jackknife alternative free-response receiver operating characteristic (JAFROC) analysis [20] was performed with both readers and cases treated as random samples, and figures of merit (FOMs) were compared using the analysis of variance model embedded within the JAFROC software. 2. Sensitivity was compared using the Wilcoxon matched-pairs signed rank test. 3. Image noise for each exposure, slice thickness and algorithm permutation was measured using the CT number standard deviation within a 40-mm-diameter circular ROI placed within the distal (background only) image at the same x/y location as the opacity. 4. Contrast-to-noise ratio (CNR) for each algorithm, exposure and slice thickness setting was calculated using the following formula: CNR 5
SDbackgroundROI 2 SDopacity SDbackground
where SDbackgroundROI5the standard deviation of CT numbers within a 6-mm diameter (ROI placed
3 of 8 bjr.birjournals.org
Br J Radiol;86:20120500
4 of 8 bjr.birjournals.org
iDose
95% confidence levels are provided in parentheses. Significant differences in FOM compared with FOM for the 125 mAs/5-mm slice thickness setting for each algorithm are denoted by an asterisk (*p,0.05, **p,0.01, ***p,0.001). Significant differences in FOM for the A and iDose4 algorithms compared with the FOM for the B algorithm for each exposure/slice thickness setting are denoted by a hash (#p,0.05, ##p,0.01).
0.5230*** (0.4241, 0.6219) 0.6090*** (0.4937, 0.7243) 0.7480* (0.5790, 0.9170) 0.6250** (0.4884, 0.9616) 1
0.6850** (0.4919, 0.8781)
0.6650** (0.4916, 0.8384) 0.8500 (0.6903, 1.0097) 0.9640 (0.9180, 1.0100) 0.8950 (0.8195, 0.9705) 0.9140 (0.8425, 0.9855)
0.9660 (0.9013, 1.0307)
A
4
3
0.6420** (0.4168, 0.8672) 0.8200 (0.6326, 1.0074)
0.5200*** (0.4202, 0.6198)
5
0.9280 (0.9013, 1.0307)
0.9900 (0.9674, 1.0126)
#
0.6370** (0.4683, 0.8057) 0.7220* (0.5337, 0.9103) 0.6390** (0.4870, 0.7910) 1
0.6700** (0.4910, 0.8490)
0.7570* (0.5327, 0.9813)
0.7260* 0.5584, 0.8936) 0.8339 (0.6193, 1.0487)
0.8599 (0.7058, 1.0417) (0.5089, 0.9010) 0.9130 (0.7342, 1.0918) 3
0.8829 0.7244, 1.0415)
0.7050*
, ##
0.9800 (0.9560, 1.004) 0.9900 (0.9673, 1.013) 5
0.9290 (0.630, 1.046)
0.5840*** (0.4572, 0.6548) 0.5560*** (0.4572, 0.6548) 0.7670* (0.4778, 0.7682) 0.6740** (0.4696, 0.8784) 1
0.6230*** (0.4778, 0.7682)
0.6500* (0.4902, 0.8098) 0.7600* (0.8013, 1.0627) 0.9320 (0.8013, 1.0627) 0.9090 (0.7414, 1.0766) 0.8880 (0.7521, 1.0239) 3 B
0.8160 (0.6656, 0.9664) 0.9310 (0.8286, 1.033) 0.9190 (0.8063, 1.0317) 0.9170 (0.8504, 0.9836)
25 mAs 50 mAs 75 mAs
0.9650 (0.9393, 0.9907)
Significant reductions were also found for sensitivity with the A algorithm at 75 mAs/3 mm (p,0.01) and 50 mAs/5 mm (p,0.05) and for the iDose4 algorithm at 50 mAs/5 mm (p,0.05) and 25 mAs/5 mm (p,0.05) when compared with the B algorithm, unlike the increases in sensitivity recorded at 50 mAs/1 mm (p,0.05) and 25 mAs/3 mm (p,0.05) with the A algorithm and at 75 mAs/5 mm (p,0.05) and 50 mAs/3 mm (p,0.05) when employing the iDose4 algorithm (Table 2).
5
Comparisons between the B algorithm and the A and iDose4 algorithms for each exposure/slice thickness setting The JAFROC FOM was significantly lower for the A algorithm at 75 mAs and 3-mm slice thickness (p,0.01) and for the iDose4 algorithm at 50 mAs and 5-mm slice thickness (p,0.05) (Table 1) compared with the same settings with the B algorithm.
100 mAs
Sensitivity was also significantly reduced from the standard setting for all exposures at 1- and 3-mm slice thicknesses for the A algorithm, and for the 50- and 25-mAs exposures at all slice thicknesses for all algorithms, with the exception of the 50-mAs exposure at 5-mm slice thickness for the B algorithm (Table 2).
125 mAs
RESULTS Comparisons between the 125 mAs/5-mm setting and other exposure/slice thickness combinations for each algorithm The FOM was significantly reduced from the standard combination for all exposure settings at 1-mm slice thickness and for the 25-mAs exposure at all slice thicknesses for all algorithms, with the exception of the 25 mAs/5-mm slice thickness setting for the B algorithm. Significant FOM reductions, compared with the standard combination, were also noted at 50 and 75 mAs using the 3-mm slice thickness for the B and A algorithms, respectively (Table 1).
Slice (mm)
For all statistical tests, differences of p,0.05 were considered significant.
Algorithm
within the background adjacent to the 9.5-mm opacity), SDopacity5the standard deviation of CT numbers within a 6-mm diameter ROI placed centrally within the opacity and SDbackground5image noise as described in (3) above.
Table 1. Jackknife alternative free-response receiver operating characteristic figure of merit (FOM) for each algorithm/exposure/slice thickness combination
K L Dobeli, S J Lewis, S R Meikle et al
Br J Radiol;86:20120500
Dose optimisation for hepatic lesion detection
Table 2. Mean (median) sensitivity for each condition
Algorithm
Slice (mm)
B
iDose4
100 mAs
75 mAs
50 mAs
25 mAs
5
0.94 (1.00)
0.86 (0.80)
0.88 (0.80)
0.88 (0.80)
0.68 (0.60)*
3
0.84 (0.80)
0.82 (0.80)
0.88 (0.80)
0.54 (0.60)**
0.30 (0.30)**
1
0.38 (0.40)**
0.28 (0.20)**
0.58 (0.50)**
0.16 (0)**
5 A
125 mAs
0.98 (1.0)
0.88 (0.80)
0.96 (1.0)
0.26 (0.40)**
0.72 (0.80)**
3
0.84 (0.80)*
0.78 (0.80)**
0.42 (0.40)**
1
0.32 (0.20)**
0.34 (0.30)**
0.44 (0.50)**
,##
,#
0.54 (0.60)**,#
0.72 (0.80)* 0.32 (0.20)**,#
#
0.64 (0.70)**
0.52 (0.60)**
,#
0.14 (0.20)** 0.44 (0.40)**,#
5
0.96 (1.0)
0.88 (0.80)
0.98 (1.0)
3
0.86 (0.90)
0.80 (0.80)
0.94 (1.0)
0.70 (0.80)*,#
0.38 (0.40)**
1
0.26 (0.20)**
0.38 (0.40)**
0.54 (0.60)**
0.26 (0.40)**
0.14 (0.25)**
Significant differences in sensitivity compared with that of the 125 mAs/5-mm slice thickness setting for each algorithm are denoted by an asterisk (*p,0.05, **p,0.01). Significant differences in sensitivity for the A and iDose4 algorithms compared with sensitivity for the B algorithm for each exposure/slice thickness setting are denoted by a hash (#p,0.05, ##p,0.01).
Noise and contrast-to-noise ratio Compared with noise for the B algorithm at each exposure/slice thickness condition, noise for the A and iDose4 algorithms was, on average, approximately 13% and 21% lower, respectively. The details of the noise levels at each setting are provided in Table 3. CNRs were between 12% and 197% higher for the A and iDose4 algorithms than for the B algorithm (Table 3).
DISCUSSION Dose optimisation of hepatic CT protocols is challenging because a complex relationship exists between lesion conspicuity, exposure, slice thickness and reconstruction algorithm. We hypothesised that a smoothing FBP algorithm or a hybrid FBP/iterative algorithm could be utilised to offset noise increases associated with the employment of thinner slices aimed at reducing partial
Table 3. Noise, with contrast-to-noise ratio (CNR) in parentheses, for each algorithm/exposure/slice thickness combination
Exposure (mAs)
125
100
75
50
25
5 of 8 bjr.birjournals.org
Slice (mm)
Algorithm B
A
iDose4
5
5.15 (1.69)
4.31 (1.91)
3.96 (2.06)
3
6.40 (1.26)
5.47 (1.58)
5.06 (1.61)
1
10.61 (0.58)
10.91 (0.91)
8.12 (1.47)
5
5.67 (0.92)
4.76 (1.34)
4.36 (1.34)
3
8.64 (0.93)
6.12 (1.20)
5.66 (1.20)
1
11.89 (0.62)
12.29 (0.92)
11.23 (0.94)
5
6.24 (0.75)
5.29 (1.40)
4.89 (1.40)
3
7.98 (0.90)
6.82 (1.14)
6.30 (1.11)
1
13.42 (0.51)
11.37 (0.59)
12.21 (0.66)
5
7.55 (0.31)
6.39 (0.92)
5.84 (0.92)
3
9.57 (0.89)
8.19 (1.07)
7.55 (1.05)
1
16.80 (0.52)
14.28 (0.66)
13.07 (0.67)
5
10.54 (0.34)
9.00 (0.59)
8.24 (0.63)
3
14.40 (0.41)
12.27 (0.46)
10.59 (0.53)
1
22.49 (0.31)
19.70 (0.40)
18.83 (0.40)
Br J Radiol;86:20120500
K L Dobeli, S J Lewis, S R Meikle et al
volume effects, thus improving lesion detection without increasing exposures. The lowest exposure at which sensitivity was maintained for each reconstruction algorithm at 5-mm slice thickness in the current study was 50 mAs for the standard B algorithm and 75 mAs for the A and iDose4 algorithms, a finding that was supported by the JAFROC data. As the slice thickness was reduced to 3 mm, performance for the B and iDose4 algorithms were comparable; however, the A algorithm fared worse. Further, slice thickness reduction demonstrated that neither of the alternate algorithms were able to compensate for increased noise at 1-mm slice thickness and the lack of significant differences in FOM, and sensitivity compared with the B algorithm (with a single exception in sensitivity for the A algorithm at 50 mAs) implies overall performance for all algorithms at 1-mm slice thickness was similar. The findings for the low-pass algorithm here were not necessarily surprising. Low-pass (smoothing) algorithms reduce noise by filtering out higher frequencies; however, the filtering is indiscriminate and important object boundaries can be smoothed concomitantly [21]. Data presented here for the smoothing algorithm further support this low-pass limitation and emphasise that preservation of interfaces is required for the detection of low-contrast objects. Iterative reconstruction techniques, on the other hand, have the potential to reduce noise while maintaining spatial resolution [22] via accurate modelling of the scanner geometry and/or photon statistics [22–24]. Unfortunately, however, although iterative techniques are ubiquitous in nuclear medicine, their acceptance by radiologists in CT is relatively slow [25], and fully iterative techniques are not yet fast enough for routine clinical use with the large volumes of data generated by MDCT [23–25]. Hybrid approaches that combine an abbreviated form of iterative reconstruction with FBP offer a potential time-effective solution where noise is reduced, important image boundaries maintained and the familiar visual properties (e.g. streaking) are preserved [15, 26, 27]. It is of particular interest, therefore, that, although noise reductions have been shown here by the hybrid algorithm consistent with previous studies [15, 27–31], this noise benefit does not necessarily translate to an improvement in low-contrast
6 of 8 bjr.birjournals.org
object detection, even though conservation of noise textures [26, 28], enhanced lesion conspicuity [27, 32–34] and improved image quality [15, 24, 34–36] have all been reported with hybrid FBP/iterative methods compared with standard FBP reconstruction. This may be explained in part by the fact that iDose4 uses FBP for its initial estimate, and, consequently, the B and iDose4 algorithms will produce similar covariance properties resulting in similar performance for low-contrast lesion detection [37–39]. Our results support previous studies indicating that the covariance properties of images are at least as important for lesion detection tasks as the variance (noise) properties [40]. The authors acknowledge certain limitations with the current study. Firstly, the phantom-based methodology does not facilitate assessment of radiologists’ interactions with patient images. In the clinical environment, a greater reduction in exposure when a hybrid iterative algorithm is used may be accepted since observers may have a greater level of confidence viewing images with less noise. Secondly, we only examined five exposure levels with a single scanner and did not explore the concomitant use of post-processing image filters or other combinations of FBP with iDose4. Thirdly, owing to the linear relationship with exposure and dose, our focus was on mAs rather than kVp reductions, although others [34, 41] have demonstrated improved low-contrast opacity detection with lower kVp. Our approach allowed for more discrete selections of exposure. CONCLUSION Superior performance for hepatic lesion detection has not been shown with either a smoothing FBP algorithm or a hybrid FBP/iterative algorithm compared with a standard FBP technique, even though noise reduction with thinner slices were demonstrated with the alternative approaches. FUNDING This research was supported by the Medical Radiation Technologists’ Board Queensland, the Australian Institute of Radiography, the University of Sydney Faculty of Health Sciences, the Royal Brisbane and Women’s Hospital Department of Medical Imaging Research Fund and Queensland Health.
Br J Radiol;86:20120500
Dose optimisation for hepatic lesion detection
ACKNOWLEGMENTS We thank the 10 observers for their important contribution to this study. Thanks also to Cynthia McCollough for her advice on iterative reconstruction techniques; to
Liam Caffery, Frank Carbon, Nicole Eastgate and Mark Bartlett for their assistance with Digital Imaging and Communications in Medicine issues; and to Peter O’Rourke and Lee Jones for statistical advice.
REFERENCES 1.
2.
3.
4.
5.
6.
7.
European Commission. Council Directive 97/43/Euratom of 30 June 1997, on health protection of individuals against the dangers of ionizing radiation in relation to medical exposure, and repealing Directive 84/466/Euratom. Official Journal of the European Communities: L, Legislation, vol 180. 1997. pp. 22–7. Brenner DJ, Hall EJ. Computed tomography—an increasing source of radiation exposure. N Engl J Med 2007;357:2277–84. Berrington de Gonzalez A, Darby S. Risk of cancer from diagnostic X-rays: estimates for the UK and 14 other countries. Lancet 2004;363:345–51. Brenner D, Elliston C, Hall E, Berdon W. Estimated risks of radiation-induced fatal cancer from pediatric CT. AJR Am J Roentgenol 2001;176:289–96. United Nations Scientific Committee. UNSCEAR. 2000. The United Nations Scientific Committee on the Effects of Atomic Radiation. Health Phys 2000;79:314. U.S. Census Bureau. 108th Congressional district summary files census of population and housing. Washington, DC: U.S. Dept. of Commerce, Economics and Statistics Administration; 2003 [accessed 24 August 2012]. Available from: www.census.gov/population/www/ cen2000/maps/respop.html Shrimpton P. Protection of the patient in X-ray computed tomography.
7 of 8
bjr.birjournals.org
8.
9.
10.
11.
12.
13.
14.
Documents of the NRPB, vol 3. Oxford, UK: National Radiation Protection Board; 1992. p. 1. Aldrich JE, Williams J. Change in patient doses from radiological examinations at the Vancouver General Hospital, 1991–2002. Can Assoc Radiol J 2005;56:94–9. Shrimpton PC, Hillier MC, Lewis MA, Dunn M. National survey of doses from CT in the UK. 2003. Br J Radiol 2006;79: 968–80. Pearce MS, Salotti JA, Little MP, McHugh K, Lee C, Kim KP, et al. Radiation exposure from CT scans in childhood and subsequent risk of leukaemia and brain tumours: a retrospective cohort study. Lancet 2012;380:499–505. Paterson A, Frush DP. Dose reduction in paediatric MDCT: general principles. Clin Radiol 2007; 62:507–17. Alpern MB, Lawson TL, Foley WD, Perlman SJ, Reif LJ, Arevalos E, et al. Focal hepatic masses and fatty infiltration detected by enhanced dynamic CT. Radiology 1986;158: 45–9. Abdelmoumene A, Chevallier P, Chalaron M, Schneider F, Verdun FR, Frascarolo P, et al. Detection of liver metastases under 2 cm: comparison of different acquisition protocols in four row multidetector-CT (MDCT). Eur Radiol 2005;15:1881–7. Joseph PM, Hilal SK, Schulz RA, Kelcz F. Clinical and experimental
15.
16.
17.
18.
19.
20.
21.
investigation of a smoothed CT reconstruction algorithm. Radiology 1980;134:507–16. Hara AK, Paden RG, Silva AC, Kujak JL, Lawder HJ, Pavlicek W. Iterative reconstruction technique for reducing body radiation dose at CT: feasibility study. AJR Am J Roentgenol 2009;193:764–71. Jones EC, Chezmar JL, Nelson RC, Bernardino ME. The frequency and significance of small (less than or equal to 15 mm) hepatic lesions detected by CT. AJR Am J Roentgenol 1992;158:535–9. Baron RL. Understanding and optimizing use of contrast material for CT of the liver. AJR Am J Roentgenol 1994;163:323–31. http://www.healthcare.philips.com [homepage on the internet]. Best, Netherlands: Philips Healthcare; 2011 [cited 24 August 2012]. Available from: http://www.healthcare.philips.com/pwc_hc/main/ shared/Assets/Documents/ct/idose_ white_paper_452296267841.pdf Brennan PC, McEntee M, Evanoff M, Phillips P, O’Connor WT, Manning DJ. Ambient lighting: effect of illumination on soft-copy viewing of radiographs of the wrist. AJR Am J Roentgenol 2007;188:W177–80. Chakraborty DP. Validation and statistical power comparison of methods for analyzing free-response observer performance studies. Acad Radiol 2008;15:1554–66. Funama Y, Awai K, Miyazaki O, Nakayama Y, Goto T, Omi Y, et al.
Br J Radiol;86:20120500
K L Dobeli, S J Lewis, S R Meikle et al
22.
23.
24.
25.
26.
27.
28.
Improvement of low-contrast detectability in low-dose hepatic multidetector computed tomography using a novel adaptive filter: evaluation with a computersimulated liver including tumors. Invest Radiol 2006;41:1–7. Thibault JB, Sauer KD, Bouman CA, Hsieh J. A three-dimensional statistical approach to improved image quality for multislice helical CT. Med Phys 2007;34:4526–44. Silva AC, Lawder HJ, Hara A, Kujak J, Pavlicek W. Innovations in CT dose reduction strategy: application of the adaptive statistical iterative reconstruction algorithm. AJR Am J Roentgenol 2010;194:191–9. Husarik DB, Marin D, Samei E, Richard S, Chen B, Jaffe TA, et al. Radiation dose reduction in abdominal computed tomography during the late hepatic arterial phase using a model-based iterative reconstruction algorithm: how low can we go? Invest Radiol 2012;47:468–74. Wang G, Yu H, De Man B. An outlook on X-ray CT research and development. Med Phys 2008;35: 1051–64. Funama Y, Taguchi K, Utsunomiya D, Oda S, Yanaga Y, Yamashita Y, et al. Combination of a low-tubevoltage technique with hybrid iterative reconstruction (iDose) algorithm at coronary computed tomographic angiography. J Comput Assist Tomogr 2011;35:480–5. Baker ME, Dong F, Primak A, Obuchowski NA, Einstein D, Gandhi N, et al. Contrast-to-noise ratio and low-contrast object resolution on full- and low-dose MDCT: SAFIRE versus filtered backprojection in a low-contrast object phantom and in the liver. AJR Am J Roentgenol 2012;199:8–18. Mi´eville FA, Gudinchet F, Brunelle F, Bochud FO, Verdun FR. Iterative
8 of 8 bjr.birjournals.org
29.
30.
31.
32.
33.
34.
reconstruction methods in two different MDCT scanners: physical metrics and 4-alternative forcedchoice detectability experiments— a phantom approach. Phys Med 2013;29:99–110. Marin D, Nelson RC, Schindera ST, Richard S, Youngblood RS, Yoshizumi TT, et al. Low-tubevoltage, high-tube-current multidetector abdominal CT: improved image quality and decreased radiation dose with adaptive statistical iterative reconstruction algorithm—initial clinical experience. Radiology 2010;254:145–53. Flicek KT, Hara AK, Silva AC, Wu Q, Peter MB, Johnson CD. Reducing the radiation dose for CT colonography using adaptive statistical iterative reconstruction: a pilot study. AJR Am J Roentgenol 2010;195: 126–31. Leipsic J, Labounty TM, Heilbron B, Min JK, Mancini GB, Lin FY, et al. Adaptive statistical iterative reconstruction: assessment of image noise and image quality in coronary CT angiography. AJR Am J Roentgenol 2010;195:649–54. Martinsen AC, Saether HK, Hol PK, Olsen DR, Skaane P. Iterative reconstruction reduces abdominal CT dose. Eur J Radiol 2012;81: 1483–7. Kalra MK, Woisetschlager M, Dahlstr¨om N, Singh S, Lindblom M, Choy G, et al. Radiation dose reduction with Sinogram Affirmed Iterative Reconstruction technique for abdominal computed tomography. J Comput Assist Tomogr 2012; 36:339–46. Schindera ST, Diedrichsen L, M¨uller HC, Rusch O, Marin D, Schmidt B, et al. Iterative reconstruction algorithm for abdominal multidetector CT at different tube voltages: assessment of diagnostic
35.
36.
37.
38.
39.
40.
41.
accuracy, image quality, and radiation dose in a phantom study. Radiology 2011;260:454–62. Funama Y, Awai K, Miyazaki O, Goto T, Nakayama Y, Shimamura M, et al. Radiation dose reduction in hepatic multidetector computed tomography with a novel adaptive noise reduction filter. Radiat Med 2008;26:171–7. Leipsic J, Nguyen G, Brown J, Sin D, Mayo JR. A prospective evaluation of dose reduction and image quality in chest CT using adaptive statistical iterative reconstruction. AJR Am J Roentgenol 2010;195:1095–9. Wernecke K, Rummeny E, Bongartz G, Vassallo P, Kivelitz D, Wiesmann W, et al. Detection of hepatic masses in patients with carcinoma: comparative sensitivities of sonography, CT, and MR imaging. AJR Am J Roentgenol 1991;157:731–9. Naidich DP, Rusinek H, McGuinness G, Leitman B, McCauley DI, Henschke CI. Variables affecting pulmonary nodule detection with computed tomography: evaluation with threedimensional computer simulation. J Thorac Imaging 1993;8:291–9. Myers KJ, Barrett HH, Borgstrom MC, Patton DD, Seeley GW. Effect of noise correlation on detectability of disk signals in medical imaging. J Opt Soc Am A 1985;2:1752–9. Wunderlich A, Noo F. Image covariance and lesion detectability in direct fan-beam X-ray computed tomography. Phys Med Biol 2008; 53:2471–93. Robinson E, Babb J, Chandarana H, Macari M. Dual source dual energy MDCT: comparison of 80 kVp and weighted average 120 kVp data for conspicuity of hypovascular liver metastases. Invest Radiol 2010;45:413–18.
Br J Radiol;86:20120500