Nomological validity of the Net Promoter Index question Birgit Leisen Pollack and Aliosha Alexandrov Department of Marketing and Supply Chain Management, University of Wisconsin Oshkosh, Oshkosh, Wisconsin, USA Abstract Purpose – The purpose of this study is twofold. First, it aims to provide a review of the Net Promoterq Index (NPI), the evidence of its ability to predict financial performance, and the evidence of its superiority to other voice of customer metrics. Second, it seeks to investigate the nomological validity of the Net Promoter question. It aims to view the NP question as an alternative to the traditional word-of-mouth measure, which is one of the components of customer loyalty. The nomological validity of NP was evaluated in a model including customer satisfaction as an antecedent and repurchase intention as a consequence. Design/methodology/approach – The data for empirically addressing a set of hypotheses related to the nomological validity were collected via selfadministered questionnaire. A total of 159 participants completed questions for banking services, 153 individuals completed questions for hairdresser/ barber services, and 132 completed questions for cell phone services. The hypotheses were tested using partial least square analysis. Findings – The results provide evidence for the nomological validity of the NPI question; albeit, the traditional word-of-mouth measure seems to perform equally as well or even better. Practical implications – A set of pros and cons related to NPI are developed. The paper recommends including the NPI in a portfolio of voice of customer metrics but not as a standalone diagnostic tool. Further, given the present state of evidence, it cannot be recommended to use the NPI as a predictor of growth nor financial performance. Originality/value – The paper provides further insights into the validity of the Net Promoter Index as a measure of customer loyalty. Keywords Nomological validity, Satisfaction, Word-of-mouth, Re-purchase intention, Customer satisfaction, Customer loyalty, Banking Paper type Research paper
The loyalty related consumer behaviors trigger revenue and market share growth, decrease customer acquisition costs, improve employee retention which together lead to increases in profit (Reichheld et al., 2000). Some stated “[. . .] we studied a wide array of industries, and found that a 5 percentage point shift in customer retention consistently resulted in 25-100% profit swings” (Reichheld et al., 2000, p. 135). As a consequence of this interest in customer loyalty, a number of loyalty related measures have been proposed and adopted by industry. We refer to these measures as voice of customer (VOC) metrics. Amongst the most popular are service quality assessments along with customer satisfaction and retention related metrics (Gupta and Zeithaml, 2006). For instance, the American Customer Satisfaction Index (ACSI), the Norwegian Customer Satisfaction Barometer (NCSB), and the Swedish Customer Satisfaction Barometer (SCSB) amongst many others have been advanced. Decades have passed and no single measure has been unanimously declared the winner. Instead, debate continues as to what is the best measure or proxy indicator of loyalty. In his Harvard Business Review article “The one number you need to grow” and bestselling book The Ultimate Question, Reichheld (2003, 2006) proclaims that the Net Promoterq Index (NPI) is superior to traditional marketing metrics in predicting the performance and growth of a firm. Therefore, according to the author, the NPI makes other voice of customer measures irrelevant. The index is based on customers’ likelihoods to recommend a firm and is calculated by subtracting the percentage of customers who demote the firm from those who promote the firm. Largely due to its intuitive simplicity, the NPI gained immediate popularity with managers. Firms adopting it include Sony, ING, and Symantec. Satmetrixq, the consulting firm
An executive summary for managers and executive readers can be found at the end of this article.
Introduction Customer loyalty has been one of the most studied marketing topics. Loyalty is a complex psychological construct and defined by Oliver (1999, p. 34) as “a deeply held commitment to rebuy or repatronize a preferred product/service consistently in the future, thereby causing repetitive samebrand or same brand-set purchasing, despite situational influences and marketing efforts having the potential to cause switching behavior.” Such loyalty is largely generated by a customer’s satisfaction level with the offering and directly propels repurchase intentions and word-of-mouth. Both, purchase intentions and word-of-mouth, are considered to be part of the larger loyalty construct as they “signal a motivation to maintain a relationship with the focal firm” and, therefore, are frequently used as measures of its presence (Gupta and Zeithaml, 2006, p. 721). The general concept of loyalty is intuitively appealing to practitioners as most believe that loyalty results in repeat business and referrals, and consequently, translates into improved financial performance (Gupta and Zeithaml, 2006). The current issue and full text archive of this journal is available at www.emeraldinsight.com/0887-6045.htm
Journal of Services Marketing 27/2 (2013) 118– 129 q Emerald Group Publishing Limited [ISSN 0887-6045] [DOI 10.1108/08876041311309243]
118
Nomological validity of the Net Promoter Index question
Journal of Services Marketing
Birgit Leisen Pollack and Aliosha Alexandrov
Volume 27 · Number 2 · 2013 · 118 –129
administering the NPI, has begun to release industry benchmark scores for 170 brands across 17 industry sectors (Satmetrix, 2011). Since its inception, a number of studies have evaluated the claims made by Reichheld (2003, 2006) and concluded that the NPI does not seem to outperform traditional measures in predicting growth nor performance. Some authors caution against using the measure by suggesting it may lead to “flawed strategy that are guided by a myopic focus on customers’ recommend intentions” (Keiningham, Cooil, Aksoy and Andreassen, 2007, p. 378). Given the continuing debate, the first purpose of this study is to provide a review of the NPI, the evidence of its ability to predict financial performance, and the evidence of its superiority to other voice of customer metrics. Most of the studies have investigated the relationship between NPI and growth at the macro level (i.e., firm level). It seems, however, that before growth can occur at the firm level, a positive connection between recommendation intentions and re-purchase needs to be made at the micro level (i.e., customer level). In other words, it needs to be shown that the NPI question has a positive effect on re-purchase at the customer level. To this end, no study, to the best of our knowledge, has investigated the performance of the NPI question in an established network of related constructs. The present study seeks to fill this void. It views the NPI question as an alternative to the traditional word-of-mouth (WOM) measures and relates it to the construct of customer satisfaction as an antecedent, repurchase intentions as a consequence, and word-of-mouth as a correlate. As such, the second purpose of this study is to assess the nomological/ predictive validity of the NPI question. Further, the Net Promoter concept has received very limited attention in the services marketing literature. This despite that roughly 90 percent of the firms reported on in published studies investigated the net promoter index are service firms. Also, 15 out of the 17 industries whose NPI is regularly assessed by Satmetrix are service industries (Satmetrix, 2011). Service are high in credence properties (Zeithaml, 1981), an area where recommendation intentions are particularly relevant (Murray, 1991). The present study seeks to address the nomological validity of this measure in the service industry. The exposition proceeds as follows: first, we review the existing NPI literature and summarize key studies evaluating the construct, its predictive capabilities, and performance in comparison to other voice of customer metrics. Second, we present a nomological framework of the NPI in relation to an established set of related constructs along with a set of hypotheses. Third, we provide a test of the hypotheses and report the findings. Based on the literature and our findings, we conclude with a set of implications.
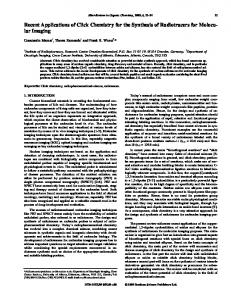
multitude of studies have linked satisfaction to various antecedents and consequences such as repeat purchase intentions and behaviors and word-of-mouth. This established relationship network, which we use to assess the nomological validity of NPI, is presented in Figure 1. Transferring the findings from the individual level up to the firm level, the ACSI is computed from individual customer feedback data for a specific firm (e.g., averaging customer satisfaction scores to arrive at the firm level composite). Then, firm-level satisfaction scores are commonly linked to revenue growth, profit, and shareholder value. Similarly, the share of wallet metric has been investigated at both, the individual and firm level. Most studies have evaluated the NPI at the firm level. As aforementioned, the NPI is said to predict revenue growth. Given the basic revenue equation of revenue ¼ unit sales*price, revenue can grow through either increasing the number of sold units, increasing the price, or a combination of both. Reichheld (2003) seems to focus on increasing the number of units sold. Such an increase in revenue can happen in two ways: current customer return for business and new customers arrive for business. That is, at the individual customer level, customers must engage in repeat purchase/ purchase behavior. Without these collective individual customer level behaviors, revenue at the firm level simply cannot grow. According to Reichheld (2003), individuals expressing a high level of recommendation intentions will not only come back for business but, through their recommendations, entice others to do the same. Thus, positive recommendations should lead to customer retention and customer acquisition at the individual level. Firm level relationships are only present because positive connections can be made at the customer level and, thus, are fundamentally a result of the summed effects from the individual level. The various levels of analysis are presented in Figure 2. While the NPI started out at the firm level and produced mixed reviews in terms of its relationship to growth, its meaningfulness could be substantiated by connections that can be made at the individual level. The empirical part of this research presents a theoretical investigation at the customer level by embedding the net promoter concept into an established network of related constructs. That is, the “ultimate question” is tied to repurchase intentions at the individual level. If confirmed, the results provide a theoretical well-grounded basis for possible relationships at the firm level. Figure 1 Model with word-of-mouth
Theoretical background Levels of analysis of voice of customer metrics The NPI is purported to be an indicator of financial performance because positive recommendations are thought to trigger a chain of events at the individual customer level. VOC metrics are assessed and analyzed at varies levels (Gupta and Zeithaml, 2006). For example, the literature extensively investigates customer satisfaction at the individual level, firm level, and even industry level. At the individual level, a 119
Nomological validity of the Net Promoter Index question
Journal of Services Marketing
Birgit Leisen Pollack and Aliosha Alexandrov
Volume 27 · Number 2 · 2013 · 118 –129
Figure 2 Levels of analysis for recommendation intentions/composites
If there is be a positive relationship between the NPI and growth at the firm level, theoretically a positive relationship between recommendations and repeat purchase at the individual level must exist. In fact, the very existence of these connections at the individual level is the only thing that makes connections at the firm level plausible.
In support of his assertion of predicting growth, Reichheld (2003) provides three graphics contrasting the percentage of net promoters with a three year growth rate of companies in the airline, internet service provider, and car rental industries. He found a significant correlation between the percentage of net promoters and growth irrespective of the size of the company. Replicating Reichheld’s (2003) studies in the UK, Marsden et al. (2005) found significant correlations between the NPI and sales growth. The reported correlations are fairly high and averaged 0.484 across banking, car manufacturing, mobile phone networks and supermarket industries. They further found that a seven point increase in the NPI corresponds to a 1 percent increase in growth. One important deficit of these studies is the implied causality. Both, Reichheld (2003) and Marsden et al. (2005) suggest that the NPI leads to growth, an assertion that cannot be substantiated with correlation analysis. Grisaffe (2007), in raising a series of conceptual issues associated with the NPI, noted that Reichheld (2003) used correlation analyses as the basis for inferring causality. Implicit in Reichheld’s (2003) argument is that a rise in the NPI leads to growth. Grisaffe (2007) noted that Reichheld’s (2003) growth data came from the 1999-2002 time window, whereas the NPI data came from no earlier than 2001. “That means something that happened in the future is being used as cause of something that happened in the past” (Grisaffe, 2007, p. 46). Grisaffe (2007), therefore, questioned the establishment of a causal link between NPI and growth. Similar to Reichheld (2003), Marsden et al. (2005) correlated NPI data collected in 2005 with sales growth data derived from comparing 2003 sales with 2004 sales. Thus, chronologically, sales growth happened first and using a later year NPI to predict it seems like predicting the past with the future. In an investigation of various customer feedback metrics, Morgan and Rego (2006) found that customer satisfaction has the greatest predictive value on future business performance, and that net promoters and average number of WOM recommendations showed no or little predictive value on a series of future business performance measures to include shareholder returns and annual sales growth. Although the net promoter question did not exactly correspond to the one used by Reichheld (2003), in a later study the same authors showed high positive correlation (r ¼ 0:973) between the two measures (Morgan and Rego,
NPI and its critique The NPI, proposed by Reichheld (2003, 2006), is a metric said to be a critical predictor of a firm’s performance and growth. In essence, the NPI measures a customer’s willingness to recommend a firm. Arriving at the NPI involves asking customers about their likelihoods to recommend company X to a friend or colleague. The answers are recorded on a single-item scale from 1 ¼ not at all likely to 10 ¼ extremely likely. Then, the percentage of detractors (respondents giving a score from 0 to 6), are subtracted from the percentage of promoters (respondents giving a score of 9 or 10). The result is the NPI. The passively satisfied (respondents giving a score of 7 or 8) are not explicitly considered in the computation of the index. According to Reichheld (2003, 2006), the net promoters are customers who not only are willing to recommend but also will return for additional business. Reichheld (2003) asserts that the NPI is simpler than traditional voice of customer metrics such as customer satisfaction, superior in predicting a firm’s growth and, therefore, “the one number you need to grow” (Reichheld, 2003, pp. 46, 47). The NPI is said to be this powerful because “when customers act as references, they do more than indicate that they’ve received good economic value from a company; they put their own reputation on the line” (Reichheld, 2003, p. 48). A number of studies, in part through replication, have challenged two key assertions made by Reichheld (2003, 2006): 1 that the NPI is predicting growth; and 2 that the NPI is better than other VOC metrics (Morgan and Rego, 2006; Pingitore et al., 2007; Keiningham, Cooil and Andreassen, 2007; Keiningham, Cooil, Aksoy and Andreassen, 2007; Keiningham et al., 2008). These studies are summarized in Table I along with those supporting the NPI. 120
Nomological validity of the Net Promoter Index question
Journal of Services Marketing
Birgit Leisen Pollack and Aliosha Alexandrov
Volume 27 · Number 2 · 2013 · 118 –129
Table I Key investigations into the Net Promoter Index Author(s)
Study objective
Industry
Examined relationships and method
Reichheld (2003)
Demonstrate relationship between NPI and growth
Airlines, internet service providers, car rentals
Two-dimensional data plotting (implied correlation)
Positive correlation between growth and net promoter index
Marsden et al. (2005)
Evaluate relationship between NPI, negative word-of-mouth and growth
Mobile phone, banking, auto, supermarkets
Two-dimensional data plotting, correlation
Positive correlation between growth and net promoter index (r ¼ 0:484); negative correlation between growth and negative word-ofmouth (r ¼ 20:524)
Morgan and Rego (2006)
Determine the impact of various VOC metrics on a series of future business performance measures
80 firms representing varied industries (39 percent service firms)
Correlation, regression Note: the computation of net promoters is somewhat different from the approach advocated by Reichheld (2003)
Net promoter metric showed no relationship to various future business performance metrics (e.g., annual sales growth); various customer satisfaction metrics, repurchase intentions, and proportion of customers complaining showed a relationship
Pingitore et al. (2007)
Contrast various VOC metrics as to their respective relationships with a number of performance measures
Auto insurance, full-service investment, airlines, car rentals
Correlation analysis
Correlation between VOC metrics and performance measures vary in strength; no uniform superior measure was identified; NPI was not found to outperform all other metrics
Keiningham, Cooil and Andreassen (2007)
Contrast various VOC metrics as to their respective relationships with relative change in revenue
Banking, retail (gasoline & home furnishing), security, transportation
Correlation analysis
Contrast customer satisfaction metric (ACSI) with NPI as to their respective relationships with growth measures
Personal computers, airlines, life insurance, internet service providers
Two-dimensional data plotting (implied correlation)
Correlation between VOC metrics and relative change in revenue vary in strength; no uniform superior measure was identified; NPI was not found to outperform all other metrics Positive correlation between various growth measures and net promoter index; similar positive correlation between various growth measures and customer satisfaction metric (ACSI)
Keiningham, Cooil, Aksoy and Andreassen (2007)
Examine VOC metrics and their respective relationships with actual loyalty behaviors at the customer level
Retail, banking, internet service providers
Correlation analysis, CHAID, regression analysis
Modest correlation between recommendation intentions and actual retention (r , 0:25); a combination of VOC metrics universally outperforms the use of only recommendation intentions when predicting actual loyalty behaviors
Keiningham et al. (2008)
Review of VOC metrics; contrast customer satisfaction metric (ACSI) with NPI as to their respective relationships with growth measures
Personal computers, airlines, life insurance
Two-dimensional data plotting (implied correlation)
Positive correlation between various growth measures and net promoter index; similar positive correlation between various growth measures and customer satisfaction metric (ACSI)
121
Key conclusion(s)
Nomological validity of the Net Promoter Index question
Journal of Services Marketing
Birgit Leisen Pollack and Aliosha Alexandrov
Volume 27 · Number 2 · 2013 · 118 –129
2008). In sum, the present empirical evidence does not allow for any firm conclusion on the predictive ability of the NPI related to financial performance. In fact, the evidence provided by Morgan and Rego (2006) seems to deny this predictive ability. So, at best, the evidence supports a correlation but not causation between the NPI and financial performance. Most of the presented studies question Reichheld’s (2003) assertion of the superiority of the NPI when compared to other voice of customer metrics. Pingitore et al. (2007) contrast various VOC metrics as to their respective relationships with a number of business performance measures. They observed correlations of varying strength and were unable to identify a superior measure. The NPI did not outperform all other metrics. Keiningham et al. (2007b) contrasted various VOC metrics as to their respective relationships with relative change in revenue. Again, the NPI did not outperform all other metrics. Additionally, Keiningham, Cooil and Andreassen (2007b) and Keiningham et al. (2008) contrasted customer satisfaction as measured by the ACSI with NPI as to their respective relationships with growth measures. Using Reichheld’s (2003) methodology, they identified a similar pattern and concluded that the NPI was not superior. Overall, the presented empirical evidence does not support the assertion that the NPI is superior to other voice of customer metrics. Keiningham, Cooil, Aksoy and Andreassen (2007) examined various metrics at the customer level and concluded that a combination of metrics universally outperforms the use of only the recommendation intentions measure when predicting actual loyalty behaviors. In sum, the current literature does not support the NPI as the single best measure.
Nomological network Nomological validity is the extent to which the measurement instrument correlates in theoretically predictable ways with measures of different but related constructs (Nunnally, 1978). The “related” constructs of great interest to marketers are customer satisfaction and loyalty behaviors. Satisfaction is “the consumer’s fulfillment response,” a judgment that a product or service provides a pleasurable level of consumption-related fulfillment, including under- or overfulfillment (Oliver, 1997, p.13). While loyalty is more of a psychological construct, loyal customers typically display at least two specific behaviors: (1) repurchase and (2) spread of favorable word-of-mouth. Numerous studies have shown that both of these behaviors are largely influenced by prior satisfaction (Szymanski and Henard, 2001; Olsen, 2002; Chandrashekaran et al., 2007; Keiningham et al., 2008; Bolten, 1998; Bolton and Lemon, 1999; Meuter et al., 2000). Hence, these two behaviors will set the context for assessing the nomological validity of the NPI. This basic nomological net is presented in Figure 1. Since the NPI is essentially measuring word-of-mouth behavior (Morgan and Rego, 2008), the key objective is to explore if these established links are found when employing the NPI question as an alternative to the more traditional word-of-mouth measures. This alternative nomological net is presented in Figure 3. To this end the following hypotheses are formulated: H1. H2.
The greater the customer satisfaction, the greater (a) WOM and (b) NP. The greater the customer satisfaction, the greater the re-purchase intent.
Although WOM is mostly viewed as a consequence of repurchase intentions and behavior (De Matos and Rossi, 2008), Reichheld (2006) suggests that it may also be viewed as an antecedent. A direct effect of WOM on re-purchase intention can be explained by public commitment. In other words, when customers share their opinion about a brand to other people they become committed to it. Deutsch and Gerard (1955) found that when people write their opinion or share it with others the opinion becomes more resistant to change. Burn and Oskamp (1986) found that people recycle significantly more waste after making a public commitment. Similarly, in negotiations, negotiators become more resistant to concessions if they make a prior public commitment (Levenotoglu and Tarar, 2005). People who describe
NPI as a single-item measure A certain advantage of the NPI is its simplicity as a singleitem measure. The use of single-item measures has been gaining popularity in the marketing discipline. NPI was introduced in the middle of an ongoing debate, which facilitated its adoption. The dominant paradigm of multipleitems scale development in marketing, as advanced by Churchill (1979), states that unobservable concepts should be measured by multiple-item measures that represent the manifestation of the unobservable concept. Some arguments for the use of multiple-item measures are that they have better reliability (Churchill, 1979; Peter, 1979) and capture more information and, thus, exhibit higher content validity (Baumgartner and Homburg, 1996). This tradition, however, was challenged by several authors. Drolet and Morrison (2001) discuss the cost of multiple-item scales and demonstrate that adding additional items to a measure does not lead to more information captured. They recommend the utilization of multi-item measures with fewer items or singleitem measures. Additional support for single-item measures comes from Rossiter (2002, 2005, 2008) who discusses some redundancies and potential disadvantages of multiple-item measures. Bergkvist and Rossiter (2007) demonstrate that the predictive validity of single-item measures is comparable to that of multiple-item measures and encourage the use of single-item measures where appropriate. Thus, from a methodological perspective, the current literature supports the NPI as a single-item measure. Some, however, caution that the use of a single item may require significantly larger samples (Pingitore et al., 2007).
Figure 3 Model with Net Promoter question
122
Nomological validity of the Net Promoter Index question
Journal of Services Marketing
Birgit Leisen Pollack and Aliosha Alexandrov
Volume 27 · Number 2 · 2013 · 118 –129
themselves as more sociable increase their social behavior over time (Schienker et al., 1994). Customers who complain to a marketer about a brand vent their dissatisfaction, while customers who complain to other people (i.e., public commitment) do not experience reduction of their dissatisfaction (Nyer and Gopinath, 2005). Overall, the literature on public commitment suggests that customers who recommend a brand to other people will commit to their opinion, and therefore, will be more likely to repurchase the brand in the future. To this end the following hypothesis is formulated:
method. Specifically, we use the SMARTPLS 2.0 software by Ringle et al. (2005).
H3.
Measurement results Pre-existing measures were used for assessing the constructs of the Net Promoter (NP), customer satisfaction, repeat purchase intentions, and word-of-mouth. The questionnaire consisted of the one NP item adopted from Reichheld (2003), three questions related to the respondents’ overall satisfaction, three items measuring word-of-mouth, and three items measuring repurchase intent. The two loyalty behaviors (i.e., repeat purchase intentions and word-of-mouth) were adopted from Zeithaml et al. (1996). With the exception of the NP question, all items were measured using a Likert-type scale (e.g., 1 ¼ strongly disagree, 7 ¼ strongly agree). The descriptive statistics and the measurement properties of the constructs are shown in Tables II and III. The scales measuring satisfaction, word-of-mouth (WOM), and re-purchase intent exhibit high levels of internal consistency with Cronbach’s alpha levels being above 0.9 (Nunnally, 1978). All items loaded as expected, and their explained variances were higher than 0.50, indicating convergent validity (Fornell and Larcker, 1981). Additionally, indicating discriminant validity, the AVE for all measures was greater than the squared correlations between the variable and any other variable in the model (Fornell and Larcker, 1981). Next, we examined the measurement properties of the NPI question in relation to the WOM measure. Theoretically, WOM and NPI measure similar phenomena and are expected to be highly correlated. On the other hand, WOM as a multiple-item measure captures more information than NP question as a single-item. In addition, single-item measures are less stable (Diamantopoulos et al., 2012) compared to multiple-item measures. Therefore, there are reasons to expect that the two measures may not be identical. The correlation analyses presented in Table II revealed significant and positive relationships between the NP question and the word-of-mouth composite across the industries (r ¼ 0:78 for banking services, r ¼ 0:86 for phone services, r ¼ 0:82 for hairdresser/barber services). Their shared variance ranges between 61 percent and 74 percent (i.e., the squared correlations), which is high, but still does not make the measures identical. To examine if WOM and the NP question discriminate, we performed confirmatory factor analysis. Despite the small sample size, we decided to use LISREL 8.80 because SMARTPLS 2.0 does not allow for a separate analysis of the measurement model. NPI was assessed in a model including all multiple-item measures. The error variance of NP was fixed to 0.15 because it was unrealistic to expect that a measurement has no error (Williams and Hazer, 1986). The results indicated an acceptable fit of the measurement model, with the exception for RMSEA. The fit was similar for all industries. For example, for the banking industry the fit df ¼ 30, p ¼ 0:00, NFI ¼ 0:98, was: X 2 ¼ 74:28, NNFI ¼ 0:98, CFI ¼ 0:99, RMSEA ¼ 0:098. However, due to the small sample size, the fit indices from the tests should be interpreted with caution. Also, the high average variance extracted due to the good quality of the measures could affect unfavorably the fit of a model (Fornell and Larcker, 1981). Further, the results from the confirmatory factor analysis revealed correlations of 0.81, 0.88, and 0.85 between the NP
The greater (a) WOM and (b) NP, the greater the repurchase intent.
Methodology Sample The data for empirically addressing the hypothesized relationships were collected using a self-administered questionnaire. The questionnaire was distributed to a convenience sample of students enrolled at a Midwest university. A total of 159 survey participants completed questions for banking services, 153 individuals completed questions for hairdresser/barber services and 132 completed questions for cell phone services. The most frequently used cellular companies are Verizon (n ¼ 43), AT&T (n ¼ 19), Sprint (n ¼ 31), and US Cellular (n ¼ 34). The most frequently used banks are US Bank (n ¼ 46) and Associated Bank (n ¼ 19). While student samples are not representative of the entire population, the samples are adequate for theory testing purposes since the participating students are customers of the services under investigation (Calder et al., 1981). Overview of analysis The viability of the models in Figures 1 and 3 was tested with structural equation modeling. There are two methods for structural equation modeling: the covariance method and the partial least squares (PLS) method. The covariance methodology is suitable for testing hypothesized theories because it provides goodness-of-fit statistics. It also, however, requires adherence to assumptions about the required degrees of freedom, the distribution of variables (i.e., multivariate normality) and a sample size of at least 200 (Barrett, 2006). PLS methods are suitable for variance maximization, do not make assumptions about the distribution of the data, and are non-parametric in nature. Additionally, the required sample size for PLS is smaller (Chin et al., 2003), which does not imply that PLS is less robust than covariance methods (Cassel et al., 1999). The PLS methodology is accepted by critical editors and other arbiters of research methods and has been used in leading academic journals like the Journal of Marketing (e.g., Hennig-Thurau et al., 2007), MIS Quarterly (e.g., Brown and Venkatesh, 2005), the Journal of Advertising Research (e.g., Drengner et al., 2008), the Strategic Management Journal (e.g., Hulland, 1999), the Journal of Marketing Research (e.g., Fornell and Bookstein, 1982), amongst others. Thus, given that the theoretical model tested is based on already established theories, the objectives of this research, and the sample sizes in this study are less than those required for covariance methods, we employ the PLS 123
Nomological validity of the Net Promoter Index question
Journal of Services Marketing
Birgit Leisen Pollack and Aliosha Alexandrov
Volume 27 · Number 2 · 2013 · 118 –129
Table II Descriptive statistics Mean
Std dev.
Correlations
Banking service (n5159) SAT WOM NP RPI
4.66 4.30 6.93 4.68
1.07 1.25 2.30 1.16
1.00 0.74 0.69 0.84
1.00 0.78 0.76
1.00 0.75
1.00
Cell phone service (n5153) SAT WOM NP RPI
3.81 3.85 6.18 4.06
1.24 1.35 2.46 1.30
1.00 0.88 0.78 0.79
1.00 0.86 0.84
1.00 0.82
1.00
Hairdresser/barber service (n5132) SAT WOM NP RPI
4.85 4.83 7.32 4.84
1.06 1.15 2.50 1.19
1.00 0.83 0.69 0.85
1.00 0.82 0.83
1.00 0.72
1.00
Notes: SAT – satisfaction with the service, WOM – word-of-mouth, NP – Net Promoter question, RPI – re-purchase intention; all correlations are significant at p , 0:01; all descriptive results are based on summated scores
Table III Measurement properties of the scales
Constructs
Satisfaction (SAT) 1. I am completely satisfied with them 2. I am very pleased with them 3. I am absolutely delighted with them Word-of-mouth (WOM) 1. I say positive thing about them to other people 2. I recommend them to someone who seeks __ service 3. I encourage friends and relatives to do business with them Re-purchase intent (RPI) 1. I consider them my first choice to buy __ related service 2. I will do more business with them in the next few years 3. I will continue to do more business with them in the next few years
Banking service Factor F2 loading a AVE
Cell phone service Factor F2 loading a AVE
0.94 0.90 0.55-0.71 0.96 0.96 0.93
Hairdresser/barber service Factor F2 loading a AVE
0.95 0.91 0.64-0.77 0.95 0.96 0.94
0.95 0.90 0.55-0.58
0.97 0.95 0.71-0.72 0.97 0.98 0.97
0.96 0.93 0.71-0.77
0.96 0.93 0.69-0.71
0.93
0.96
0.94
0.97
0.96
0.97
0.95
0.98
0.97
0.91 0.85 0.58-0.71
0.95 0.90 0.64-0.71
0.95 0.92 0.69-0.72
0.89
0.93
0.93
0.95
0.96
0.97
0.96
0.97
0.93 2
Notes: a – Cronbach’s alpha, AVE – average variance extracted, and F – range of shared variance; All factor loadings are significant with t-values . 2.58
WOM measure. The results revealed a significant deterioration in X2 for the banking and phone services, but a non-significant difference for the hairdresser service. In other words, NPI and WOM measures discriminated for the banking and phone industry, but did not discriminate for the hairdresser industry. Therefore, the results from the second test were mixed. The conclusion that can be made is that the discriminant validity of the NP question and WOM may depend on the industry, and possibly on other contextual factors. This finding is revealing and should be subjected to future research.
question and WOM for the respective service industries. However, based on Fornell and Larcker (1981) criteria the two measures did exhibit discriminant validity. The range of the extracted variances of WOM and the NP question were higher than their shared variance. The results were identical for all industries. To verify this somewhat unexpected finding, we performed additional analysis based on nested models. Following Hughes et al. (1986), we compared the original measurement model with a model where the NP question was forced to load on the 124
Nomological validity of the Net Promoter Index question
Journal of Services Marketing
Birgit Leisen Pollack and Aliosha Alexandrov
Volume 27 · Number 2 · 2013 · 118 –129
Results
three service industries (b ¼ 0:30, t ¼ 4:48 for banking services; b ¼ 0:51, t ¼ 4:13 for phone services; b ¼ 0:26, t ¼ 2:29 for hair dresser/barber services). We performed additional analysis to validate the results obtained via the PLS method. Alternatively, we employed the covariance method, and the viability of the research model was tested again using LISREL 8.80. The results were almost identical to those in Table IV and Table V. For example, for the phone industry in the model with WOM, the effect of SAT on WOM was b ¼ 0:91; t ¼ 13:11, the effect of SAT on RPI was b ¼ 0:29; t ¼ 2:12, and the effect of WOM on RPI was b ¼ 0:58; t ¼ 4:17. The explained variances in WOM and RPI were 83 percent and 73 percent respectively. The fit of the model was acceptable (X 2 ¼ 99:49, df ¼ 24, p ¼ 0:00, NFI ¼ 0:97, NNFI ¼ 0:97, CFI ¼ 0:98, RMSEA ¼ 0:14). The somewhat higher level of RMSEA could be attributed to the reasons discussed in the measurement section. For the model with the NP question, the results for the banking industry also were similar to those obtained through the PLS method. The effect of SAT on NP was b ¼ 0:80; t ¼ 11:66, the effect of SAT on RPI was b ¼ 0:41; t ¼ 4:83, and the effect of NP on RPI was b ¼ :50; t ¼ 6:02. The explained variances in WOM and RPI were 76 percent and 65 percent respectively. The fit of the model was acceptable (X 2 ¼ 23:57, df ¼ 12, p ¼ 0:02, NFI ¼ 0:99, NNFI ¼ 0:99, CFI ¼ 0:99, RMSEA ¼ 0:079). The results from the other industries were similar, and overall, the validation test confirmed the results obtained through PLS.
Tests of hypotheses The hypotheses were tested using partial least square analysis. Table IV and Table V contain a summary of the results along with the explained variances in the dependent variables. Confirming H1a, the analyses revealed significant and positive relationships between customer satisfaction and the traditional word-of-mouth measure (b ¼ 0:74, t ¼ 11:98, R 2 ¼ 0.54 for banking services; b ¼ 0.88, t ¼ 35.10, R2 ¼ 0.77 for phone services; b ¼ 0:84, t ¼ 18.92, R2 ¼ 0.70 for hair dresser/barber services). In comparison and confirming H1b, the analyses revealed similar significant and positive relationship patterns between customer satisfaction and the NP question across the three service industries (b ¼ 0:70, t ¼ 10:71, R2 ¼ 0:48 for banking services; b ¼ 0:78, t ¼ 12:94, R2 ¼ 0:60 for phone services; b ¼ 0:69, t ¼ 8:96, R2 ¼ 0:48 for hair dresser/barber services). Of note, the R2 values for the equation using the traditional word-ofmouth measures are higher across the three industries. As expected and confirming H2, the analyses revealed significant and positive relationships between customer satisfaction and re-purchase intention across the three service industries. For the model with the word-of-mouth measure, the path coefficients were b ¼ 0:63, t ¼ 8:92 for banking services; b ¼ 0:24, t ¼ 2:40 for phone services; b ¼ 0:50, t ¼ 3:37 for hair dresser/barber services. For the model with the net promoter measure, the path coefficients were b ¼ 0:63, t ¼ 10:08 for banking services; b ¼ 0:40, t ¼ 3:29 for phone services; b ¼ 0:67, t ¼ 6:15 for hair dresser/barber services. With respect to H3a, the analyses revealed significant and positive relationships between the traditional word-of-mouth measure and repeat purchase intentions (b ¼ 0:30, t ¼ 3:91 for banking services; b ¼ 0:63, t ¼ 4:21 for phone services; b ¼ 0:41, t ¼ 2:73 for hair dresser/barber services). In comparison and confirming H3b, the analyses revealed similar significant and positive relationship patterns between the NP question and repeat purchase intentions across the
Exploratory firm-level analysis To render an initial exploratory assessment of the connection between the actual NPI and repurchase intentions at the firm level, the NPI was computed for the most frequently mentioned cell phone companies (Verizon, AT&T, Sprint, US Cellular) and banks (US Bank, Associated Bank). To arrive at the firm level NPI, the percentage of detractors (respondents giving a score from 0 to 6) were subtracted from the percentage of promoters (respondents giving a score of 9
Table IV Test results for model with WOM
Structural model parameter
H1a H2 H3a
(Supported) (Supported) (Supported)
SAT ! WOM SAT ! RPI WOM ! RPI
Banking service Path coefficients R2 0.74 0.63 0.30
0.54 0.75
Cell phone service Path coefficients R2 0.88 0.24 0.63
0.77 0.72
Hairdresser/barber service Path coefficients R2 0.84 0.50 0.41
0.70 0.77
Notes: SAT – satisfaction with the service; WOM – word-of-mouth; RPI – re-purchase intention; all path coefficients are significant at t . 2:5
Table V Test results for model with NP
Structural model parameter
H1b H2 H3b
(Supported) (Supported) (Supported)
SAT ! nP SAT ! RPI NP ! RPI
Banking service Path coefficients R2 0.70 0.63 0.30
0.48 0.76
Cell phone service Path coefficients R2 0.78 0.40 0.51
0.60 0.74
Hairdresser/barber service Path coefficients R2 0.69 0.67 0.26
Notes: SAT – satisfaction with the service, NP – Net Promoter question, RPI – re-purchase intention; All path coefficients are significant at t . 2:58
125
0.48 0.75
Nomological validity of the Net Promoter Index question
Journal of Services Marketing
Birgit Leisen Pollack and Aliosha Alexandrov
Volume 27 · Number 2 · 2013 · 118 –129
or 10) for each firm. Also, the average word-of-mouth and repurchase intentions were computed for each firm. The results are reported in Table VI. Results show initial evidence of a relationship between the NPI and the mean re-purchase intentions at the firm level. As the NPI increases so does the mean repurchase intentions for the six firms. The correlation between NPI and mean repurchase intentions is 0.88 (significant at a , 0:05). A similar positive relationship seems to exist between WOM and mean repurchase intentions. As the average WOM increases so does the mean repurchase intentions for the six firms. The correlation between WOM and mean repurchase intentions is 0.95 (significant at a , 0:05). Note that the correlation coefficients are based upon only six observations. However, given the large effect size, the power of the test (i.e., ability of test to detect effects of 0.88 or above) is at 0.8. Nonetheless, the results should be viewed as very exploratory in nature; albeit they confirm the theoretical reasoning presented in this research.
satisfaction on re-purchase intention is stronger in the model with NP. Cumulatively, the results indicate that the NP question seems to perform well in the nomological network; albeit the traditional word-of-mouth measure seems to perform equally as well or even better.
Managerial implications and future research To summarize, the key conclusions from the review of the current literature are: . The present empirical evidence does not allow for any firm conclusion on the predictive ability of the NPI related to financial performance. . The present evidence does not support the assertion of the NPI’s superiority to other voice of customer metrics. The current evidence suggests that a combination of metrics is best at predicting actual loyalty behaviors (Keiningham, Cooil, Aksoy and Andreassen, 2007). Based on the presented literature and empirical findings of this study, we now present a set of pros and cons for the NPI. The clear pros of the NPI are that it is easy to understand, administer, use, and track and compare against industry benchmarks. The cons are that: the NPI may not perform quite as well as traditional measures in assessing loyalty (e.g., word-ofmouth); it is not truly identical to WOM; there is no empirical evidence of its predictive ability of growth and financial performance; and the data collection may require larger samples (Pingitore et al., 2007). Based on the presented evidence, we recommend including the NPI in a portfolio of voice of customer metrics. We do not recommend for it to be used as a standalone diagnostic tool. While it is easy to use, it has not been shown to outperform other customer input approaches. Further, given the present evidence, we cannot recommend to use the NPI as a predictor of growth nor financial performance. The literature, at best, suggests that there is a relationship between NPI and growth, but does not support the assertion of causation (i.e., increase in NPI leads to increase in growth). In terms of future research, perhaps the most pressing issue is to provide clear empirical evidence of the predictive ability of the NPI. While the existing literature along with the present research provides some support for the NPI as a voice of customer metric, the effect it has on growth and other financial performance measures is under researched. Specifically, the NPI needs to be examined in relation to future growth if it should be recognized as a predictor of it. Here, longitudinal study or time series analysis should be employed as these methods recognize the sequencing of events (e.g., an increase in NPI is followed by an increase in growth). Without this demonstration, doubt about the predictive capabilities will likely remain. Proponents of the NPI advise managers to increase the score to achieve growth, but the literature does not provide much guidance on how to do this. More research is needed to understand what drives NPI, and to what extent managers can control it. Factors like providing better services and products along with increasing overall satisfaction are the most frequently cited drivers under managerial control. However, there are industry related factors outside the control of the firm, which also can impact the NPI. As a result
Conclusion The objective of the empirical study is to evaluate the performance of the NP question as a substitute for an established WOM construct within a nomological network. The correlation analysis reveals high and significant correlations between the two measures. Although these are high values, they demonstrate that the two concepts are similar but not identical. Similar results are revealed in the model, which was tested for three services. Based on the test results in Table IV and Table V, several conclusions can be made. First, the explained variance in NP by satisfaction with the service is lower compared to the explained variance in WOM. This discrepancy is most pronounced in the hairdresser/barber industry, where only 48 percent of the variance is explained in NP compared to 70 percent of the variance in WOM. The other two services, banking and cell phone, reveal similar results. Therefore, NP does not seem to be related in the same way to satisfaction as WOM does. Second, the effects of NP on re-purchase intention seem to be generally lower compared to the effects of WOM. Again, the largest difference is in the hairdresser/barber industry. The phone service reveals smaller difference, and there is no difference in the banking service. Third, partially because of the abovementioned differences, NP affects indirectly the effect of satisfaction on re-purchase intention. While there is no difference in the banking service, there are substantial differences in the other two services, where the effect of Table VI Exploratory investigation of the NPI link and return intentions
NPI
Mean WOM
Mean repurchase intentions
Cell phone service Verizon (n 5 43) AT&T (n 5 19) Sprint (n 5 31) US Cellular (n 5 50)
2 10.6 2 27.7 2 39 2 34
4.1 3.8 3.7 3.9
4.4 4.2 3.7 4.1
Banking service US Bank (n 5 46) Associated Bank (n 5 19)
2 18.1 33.3
4.1 4.3
4.5 4.8
Firm
126
Nomological validity of the Net Promoter Index question
Journal of Services Marketing
Birgit Leisen Pollack and Aliosha Alexandrov
Volume 27 · Number 2 · 2013 · 118 –129
some industries may find it more difficult to increase the NPI than others. For example, in service industries high on credence qualities, customers may be more reluctant to share their opinion simply because they may not be able to judge the quality of the received service. In addition, service quality is more volatile than product quality, which together with the fact that unhappy customer share their opinion more frequently than happy customers, suggests that service oriented industries will naturally tend to have lower NPSw than product oriented industries. This seems to be particularly the case for services with little tangible outcomes (i.e., pure services). The limited publicly available data on the Satmetrixq website reveals similar pattern. The industries with the lowest average NPSw are: health insurance (4 percent), internet service (4 percent), life insurance (9 percent), cable service (9 percent), and credit cards (13 percent). In contrast, the industries with the highest scores are: department/specialty stores (56 percent), online shopping (56 percent), grocery/supermarket (49 percent), and hardware/home supply (48 percent). Overall, there is a need for a better understanding on what managers can and cannot do to increase NPI. Springing somewhat from the previous issue, are the cost associated with increasing the NPI. Given that customer satisfaction is the key driver of spreading favorable word-ofmouth, increasing the percentage of net promoters will likely involve a significant cost increase as a result of product or service improvements. Thus, coupled with the potential limits in some industries, increasing the NPI may lead to an increase in revenue growth, it does not necessarily lead to an increase in profit. The cost of improving on the NPI may offset the additional revenue obtained by doing so. Consider a bank with a current NPI at the industry benchmark. What actions could the bank take to have more customers rating them at 9 or 10 on the net promoter scale and/or fewer customers rating them at a 6 or below? An increase in NPI could be achieved by lowering interest rates for lending services below those of the competitors (assuming people will more highly recommend the bank with the most favorable rates), increasing interest rates on deposits, eliminating or reducing fees for services, etc. All of these actions have revenue and cost implications and, therefore, increasing the NPI ad infinitum may prove detrimental to the financial situation of the institution. This suggests that there may be a point of diminishing returns that should not be crossed.
Bolton, R.N. and Lemon, K.N. (1999), “A dynamic model of customers’ usage of services: usage as an antecedent and consequence of satisfaction”, Journal of Marketing Research, Vol. 36 No. 2, pp. 171-86. Brown, S.A. and Venkatesh, V. (2005), “Model of adoption of technology in households: a baseline model test and extension incorporating household life cycle”, MIS Quarterly, Vol. 29 No. 3, pp. 399-426. Burn, S.M. and Oskamp, S. (1986), “Increasing community recycling with persuasive communication and public commitment”, Journal of Applied Social Psychology, Vol. 16 No. 1, pp. 29-41. Calder, B.J., Phillips, L.W. and Tybout, A.M. (1981), “Designing research for application”, Journal of Consumer Research, Vol. 8 No. 2, pp. 197-207. Cassel, C., Hackl, P. and Westlund, A.H. (1999), “Robustness of partial least-squares method for estimating latent variable quality structures”, Journal of Applied Statistics, Vol. 26 No. 4, pp. 435-46. Chandrashekaran, M., Rotte, K., Tax, S.S. and Grewal, R. (2007), “Satisfaction strength and customer loyalty”, Journal of Marketing Research, Vol. 44 No. 1, pp. 153-63. Chin, W.W., Marcolin, B.L. and Newsted, P.R. (2003), “A partial least squares latent variable modeling approach for measuring interaction effects: results from a Monte Carlo simulation study and an electronic-mail emotion/ adoption study”, Information Systems Research, Vol. 14 No. 2, pp. 189-217. Churchill, G.A. Jr (1979), “A paradigm for developing better measures of marketing constructs”, Journal of Marketing Research, Vol. 16 No. 1, pp. 64-73. De Matos, C.A. and Rossi, C.A.V. (2008), “Word-of-mouth communications in marketing: a meta-analytic review of the antecedents and moderators”, Journal of the Academy of Marketing Science, Vol. 36 No. 4, pp. 578-96. Deutsch, M. and Gerard, H.B. (1955), “A study of normative and informational social influences upon individual judgment”, The Journal of Abnormal and Social Psychology, Vol. 51 No. 3, pp. 629-36. Diamantopoulos, A., Sarstedt, M., Fuchs, C., Wilczynski, P. and Kaiser, S. (2012), “Guidelines for choosing between multi-item and single-item scales for construct measurement: a predictive validity perspective”, Journal of the Academy of Marketing Science, Vol. 40 No. 3, pp. 434-49. Drengner, J., Gaus, H. and Jahn, S. (2008), “Does flow influence the brand image in event marketing”, Journal of Advertising Research, Vol. 48 No. 1, pp. 138-47. Drolet, A.L. and Morrison, D.G. (2001), “Do we really need multiple-item measures in service research?”, Journal of Service Research, Vol. 3 No. 3, pp. 196-204. Fornell, C. and Bookstein, F.L. (1982), “Two structural equation models: LISREL and PLS applied to consumer exit-voice theory”, Journal of Marketing Research, Vol. 19 No. 4, pp. 440-52. Fornell, C. and Larcker, D.F. (1981), “Evaluating structural equation models with unobservable variables and measurement error”, Journal of Marketing Research, Vol. 18 No. 1, pp. 39-50. Grisaffe, D.B. (2007), “Questions about the ultimate question: conceptual considerations in evaluating Reichheld’s net promoter score (NPS)”, Journal of Consumer Satisfaction, Dissatisfaction and Complaining Behavior, Vol. 20, pp. 36-53.
References Barrett, P. (2006), “Structural equation modeling: adjudging model fit”, Personality and Individual Differences, Vol. 42 No. 5, pp. 815-24. Baumgartner, H. and Homburg, C. (1996), “Applications of structural equation modeling in marketing and consumer research: a review”, International Journal of Research in Marketing, Vol. 13 No. 2, pp. 139-61. Bergkvist, L. and Rossiter, J.R. (2007), “The predictive validity of multiple-item versus single-item measures of the same constructs”, Journal of Marketing Research, Vol. 44 No. 2, pp. 175-84. Bolten, R.N. (1998), “A dynamic model of the duration of the customer’s relationship with a continuous service provider: the role of satisfaction”, Marketing Science, Vol. 17 No. 1, pp. 45-65. 127
Nomological validity of the Net Promoter Index question
Journal of Services Marketing
Birgit Leisen Pollack and Aliosha Alexandrov
Volume 27 · Number 2 · 2013 · 118 –129
Gupta, S. and Zeithaml, V. (2006), “Customer metrics and their impact on financial performance”, Marketing Science, Vol. 25 No. 6, pp. 718-39. Hennig-Thurau, T., Henning, V. and Sattler, H. (2007), “Consumer file sharing of motion pictures”, Journal of Marketing, Vol. 71 No. 4, pp. 1-18. Hughes, M.A., Price, R.L. and Marrs, D.W. (1986), “Linking theory construction and theory testing: models with multiple indicators of latent variables”, Academy of Management Review, Vol. 11 No. 1, pp. 128-44. Hulland, J. (1999), “Use of partial least squares (PLS) in strategic management research: a review of four recent studies”, Strategic Management Journal, Vol. 20 No. 2, pp. 195-204. Keiningham, T.L., Aksoy, L., Cooil, B. and Andreassen, T.W. (2008), “Linking customer loyalty to growth”, Sloan Management Review, Vol. 49 No. 4, pp. 51-7. Keiningham, T.L., Cooil, B., Andreassen, T.W. and Aksoy, L. (2007), “A longitudinal examination of Net Promoter and firm revenue growth”, Journal of Marketing, Vol. 71 No. 3, pp. 39-51. Keiningham, T.L., Cooil, B., Aksoy, L., Andreassen, T.W. and Weiner, J. (2007), “The value of different customer satisfaction and loyalty metrics in predicting customer retention, recommendation, and share-of-wallet”, Managing Service Quality, Vol. 17 No. 4, pp. 361-84. Levenotoglu, B. and Tarar, A. (2005), “Prenegotiation public commitment in domestic and international bargaining”, American Political Science Review, Vol. 99 No. 3, pp. 419-33. Marsden, P., Samson, A. and Upton, N. (2005), “Advocacy drives growth: customer advocacy drives UK business growth”, available at: http://www2.lse.ac.uk/intranet/LSE Services/ERD/pressAndInformationOffice/PDF/Advocacy DrivesGrowth_5-9-05.pdf (accessed November 11, 2011). Meuter, M.L., Ostrom, A.L., Roundtree, R.I. and Bitner, M. (2000), “Self-service technologies: understanding customer satisfaction with technology-based service encounters”, Journal of Marketing, Vol. 64 No. 3, pp. 50-64. Morgan, N.A. and Rego, L.L. (2006), “The value of different customer satisfaction and loyalty metrics in predicting business performance”, Marketing Science, Vol. 25 No. 5, pp. 426-39. Morgan, N.A. and Rego, L.L. (2008), “Can behavioral WOM measures provide insight into the Net Promoter concept of customer loyalty?”, Marketing Science, Vol. 27 No. 3, pp. 533-4. Murray, K.B. (1991), “A tests of services marketing theory: consumer information acquisition activities”, Journal of Marketing, Vol. 55 No. 1, pp. 10-25. Nunnally, J.C. (1978), Psychometric Theory, McGraw Hill, New York, NY. Nyer, P.U. and Gopinath, M. (2005), “Effects of complaining versus negative word of mouth on subsequent changes in satisfaction: the role of public commitment”, Psychology and Marketing, Vol. 22 No. 12, pp. 937-53. Oliver, R.L. (1997), Satisfaction: A Behavioral Perspective on the Consumer, McGraw-Hill, New York, NY. Oliver, R.L. (1999), “Whence consumer loyalty”, Journal of Marketing, Vol. 63 No. 4, pp. 33-44. Olsen, S.O. (2002), “Comparative evaluation and the relationship between quality, satisfaction, and repurchase loyalty”, Journal of the Academy of Marketing Science, Vol. 30 No. 3, pp. 240-9.
Peter, P.J. (1979), “Reliability: a review of psychometric basics and recent marketing practices”, Journal of Marketing Research, Vol. 16 No. 1, pp. 6-17. Pingitore, G., Morgan, N.A., Rego, L.L., Gigliotti, A. and Meyers, J. (2007), “The single-question trap”, Marketing Research, Vol. 19 No. 2, pp. 8-13. Reichheld, F.F. (2003), “The one number you need to grow”, Harvard Business Review, Vol. 81 No. 12, pp. 46-54. Reichheld, F.F. (2006), The Ultimate Question, Harvard Business School Press, Boston, MA. Reichheld, F.F., Markey, R.G. Jr and Hopton, C. (2000), “The loyalty effect – the relationship between loyalty and profits”, European Business Journal, Vol. 12 No. 3, pp. 134-9. Ringle, C.M., Wende, S. and Wills, A. (2005), “SmartPLS 2.0 (beta)”, available at: www.smartpls.de Rossiter, J.R. (2002), “The C-OAR-SE procedure for scale development in marketing”, International Journal of Research in Marketing, Vol. 19 No. 4, pp. 305-35. Rossiter, J.R. (2005), “Reminder: a horse is a horse”, International Journal of Research in Marketing, Vol. 22 No. 1, pp. 23-5. Rossiter, J.R. (2008), “Content validity of measures of abstract constructs in management and organizational research”, British Journal of Management, Vol. 19 No. 4, pp. 380-8. Satmetrix (2011), “USAA, JetBlue Airways, Symantec, Trader Joe’s, Vanguard & Amazon.com among the highest in customer loyalty in Satmetrix 2011 net promoter benchmarks”, available at: www.netpromoter.com/ resources/article23.jsp (accessed November 9, 2011). Schienker, B.R., Dlugolecki, D.W. and Doherty, K. (1994), “The impact of self-presentations on self-appraisals and behavior: the power of public commitment”, Personality and Social Psychology Bulletin, Vol. 20 No. 1, pp. 20-33. Szymanski, D.M. and Henard, D.H. (2001), “Customer satisfaction: a meta-analysis of the empirical evidence”, Journal of the Academy of Marketing Science, Vol. 29 No. 1, pp. 16-35. Williams, L.J. and Hazer, J.T. (1986), “Antecedents and consequences of satisfaction and commitment in turnover models: a reanalysis using latent variable structural equation methods”, Journal of Applied Psychology, Vol. 71 No. 2, pp. 219-31. Zeithaml, V.A. (1981), “How consumer evaluation processes differ between goods and services”, in Donnelly, J.H. and George, W.R. (Eds), Marketing Services, American Marketing Association, Chicago, IL. Zeithaml, V.A., Berry, L.L. and Parasuraman, A. (1996), “The behavioral consequences of service quality”, Journal of Marketing., Vol. 60 No. 2, pp. 31-46.
Corresponding author Birgit Leisen Pollack can be contacted at:
[email protected]
Executive summary and implications for managers and executives This summary has been provided to allow managers and executives a rapid appreciation of the content of the article. Those with a particular interest in the topic covered may then read the article in toto to take advantage of the more comprehensive description of the research undertaken and its results to get the full benefit of the material present. 128
Nomological validity of the Net Promoter Index question
Journal of Services Marketing
Birgit Leisen Pollack and Aliosha Alexandrov
Volume 27 · Number 2 · 2013 · 118 –129
The management tool Net Promoterq has been hailed as superior to traditional marketing metrics in predicting a firm’s performance and growth. It is even claimed that the Net Promoter index (NPI) makes other “voice of customer” measures irrelevant. But is it? Does it? The index is based on customers’ likelihood of recommending a firm and is calculated by subtracting the percentage of customers who demote the firm from those who promote it. Largely due to its intuitive simplicity, the NPI gained immediate popularity with managers. Firms adopting it include Sony and ING. However, despite the claims, a number of studies have concluded that the NPI does not seem to outperform traditional measures in predicting growth nor performance. Some authors caution against using the measure by suggesting it may lead to “flawed strategy that are guided by a myopic focus on customers’ recommend intentions”. Given the continuing debate, Birgit Leisen Pollack and Aliosha Alexandrov provide a review of the Net Promoter index, the evidence of its ability to predict financial performance, and the evidence of its superiority to other voice of customer metrics. In “Nomological validity of the Net Promoter index question” they also investigate the nomological validity of the Net Promoter question, viewing it an alternative to the traditional word-of-mouth measure, which is one of the components of customer loyalty. The general concept of loyalty is intuitively appealing to practitioners as most believe that it results in repeat business and referrals and ultimately improved financial performance. The loyalty-related consumer behaviors trigger revenue and market-share growth, decrease customer acquisition costs, improve employee retention which together lead to increases in profit. As a consequence, a number of loyalty-related measures have been proposed and adopted by industry – referred to as voice of customer (VOC) metrics. Amongst the most popular are service quality assessments along with customer satisfaction and retention related metrics, for instance, the American Customer Satisfaction Index, the Norwegian Customer Satisfaction Barometer and the Swedish Customer Satisfaction Barometer amongst many others have been advanced. Decades have passed and no single measure has been unanimously declared the winner. Instead, debate continues as to what is the best measure or proxy indicator of loyalty. The current study says that the evidence so far does not allow for any firm conclusion on the predictive ability of the NPI related to financial performance. It does not support the assertion of the NPI’s superiority to other voice of customer
metrics, and the current evidence suggests that a combination of metrics is best at predicting actual loyalty behaviors. The clear pros of the NPI are that it is: . easy to understand; . easy to administer; . easy to use; and . easy to track and compare against industry benchmarks. The cons are that: . the NPI may not perform quite as well as traditional measures in assessing loyalty (e.g., word-of-mouth); . it is not truly identical to WOM; . there is no empirical evidence of its predictive ability of growth and financial performance; and . the data collection may require larger samples. The authors recommendation is that NPI be included in a portfolio of “voice of customer” metrics, rather than as a stand-alone diagnostic tool. While it is easy to use, it has not been shown to outperform other customer input approaches. The authors cannot recommend the use of the NPI as a predictor of growth nor financial performance. The literature, at best, suggests that there is a relationship between NPI and growth, but does not support the assertion of causation (i.e. increase in NPI leads to increase in growth). Proponents of the NPI advise managers to increase the score to achieve growth, but the literature does not provide much guidance on how to do this. More research is needed to understand what drives NPI, and to what extent managers can control it. Factors like providing better services and products along with increasing overall satisfaction are the most-frequently cited drivers under managerial control. However, there are industry -related factors outside the control of the firm which also can impact the NPI. As a result some industries may find it more difficult to increase the NPI than others. For example, in service industries high on credence qualities, customers may be more reluctant to share their opinion simply because they may not be able to judge the quality of the received service. In addition, service quality is more volatile than product quality, which together with the fact that unhappy customers share their opinion more frequently than happy customers, suggests that service oriented industries will naturally tend to have lower Net Promoter Score (NPS) than product oriented industries. This seems to be particularly the case for services with little tangible outcomes (i.e., pure services). (A pre´cis of the article “Nomological validity of the Net Promoter Index question”. Supplied by Marketing Consultants for Emerald.)
To purchase reprints of this article please e-mail:
[email protected] Or visit our web site for further details: www.emeraldinsight.com/reprints
129