Hindawi Publishing Corporation Journal of Nanomaterials Volume 2014, Article ID 310601, 5 pages http://dx.doi.org/10.1155/2014/310601
Research Article Nonnegative Matrix Factorization Numerical Method for Integrated Photonic Cavity Based Spectroscopy Zhengyu Huang,1,2 Dayuan Xiong,3 Guixu Zhang,2 Yiqin Shi,1 Changning Hao,1 and Junli Duan1 1
Department of Gerontology, Xinhua Hospital, Shanghai Jiaotong University, Shanghai 200092, China Department of Computer Science, East China Normal University, 500 Dongchuan Road, Shanghai 200235, China 3 Key Laboratory of Polarized Materials and Devices, East China Normal University, Shanghai 200241, China 2
Correspondence should be addressed to Changning Hao;
[email protected] and Junli Duan;
[email protected] Received 29 November 2013; Accepted 7 January 2014; Published 13 February 2014 Academic Editor: Wen Lei Copyright © 2014 Zhengyu Huang et al. This is an open access article distributed under the Creative Commons Attribution License, which permits unrestricted use, distribution, and reproduction in any medium, provided the original work is properly cited. Nonnegative matrix factorization numerical method has been used to improve the spectral resolution of integrated photonic cavity based spectroscopy. Based on the experimental results for integrated photonic cavity device on Optics Letters 32, 632 (2007), the theoretical results show that the spectral resolution can be improved more than 3 times from 5.5 nm to 1.8 nm. It is a promising way to release the difficulty of fabricating high-resolution devices.
1. Introduction Miniature spectrometers are important for a wide variety of applications such as biomedical, chemical, remote sensing, and environmental engineering [1, 2]. The photonic device is the key to improve the performance of miniature spectrometer. One of the photonic devices is the wavelength division device. The integrated photonic cavity is one of the available options for wavelength division device. The integrated photonic cavity based wavelength division devices can match the detector completely and simplify the spectrometers extremely, which can leave the moving parts away and have very high reliability [1–5]. Moreover, the integrated photonic cavity based spectrometer has the ability to capture the target spectrum in real time, without any scanning time, which is an excellent property for certain specific applications especially in remote sensing, gas detection, biological, biochemical, geology exploring, and field investigating. It has been demonstrated that the integrated photonic cavity can be used to obtain a high spectral resolution by a chip with 128 filter channels [1, 2], which is one of the most promising miniature spectrometer types. An interesting problem is to improve the spectral resolution by numerical model on this concept of high-resolution
miniature spectrometer. Since the filtering properties of the integrated photonic cavity may not be ideal, the transmission spectrum of each photonic cavity channel may have large ripples on pass- and stopbands and poor stopband attenuation [6]. Moreover, the transmission spectrum of each channel may overlap with each other and the peak intensity of each channel may differ. All of those problems will lead to the widening and deformation of input signal spectrum, which will reduce the spectral resolution of the integrated photonic cavity based spectrometer. In order to improve the spectral resolution of the integrated photonic cavity, one method is to fabricate more narrowband integrated photonic cavity devices, but that is an extremely difficult and expensive work. Digital signal processing is another low-cost way to improve the spectral resolution. Several approaches have recently been exploited, such as sparse nature of signals [7], adaptive regularization [8], and filters with random transmittance [9]. As a new method to reconstruction of image, the nonnegative matrix factorization (NMF) has been developed, which uses nonnegativity constraints and results in a parts-based representation [10]. In this work, we will utilize NMF numerical method for spectrum reconstruction to improve the resolution of integrated photonic cavity based spectroscopy.
2
Journal of Nanomaterials
2. Simulation Models Our goal is to investigate the effect in terms of resolution improvement by using NMF numerical method. Using the concept of high-resolution miniature spectrometer [1, 2], the mathematical description of experimental measurement can be expressed as 𝑌 (𝜆 𝑗 ) = ∫ 𝑇𝑗 (𝜆) 𝑋 (𝜆) 𝑑𝜆 ≈ ∑𝑇𝑗 (𝜆 𝑖 ) 𝑋 (𝜆 𝑖 ) Δ𝜆, 𝑖
(1)
where 𝜆 is wavelength, 𝑌(𝜆 𝑗 ) are the output signal spectrum measured by the miniature spectrometer, 𝑇𝑗 (𝜆 𝑖 ) is the intrinsic transmission property of the 𝑗th channel filter in the 128-channel device which is measured by a standard precision spectrometer, and 𝑋(𝜆 𝑖 ) is the target spectrum, 𝑗 = 1, 2, 3, . . . , 128. For the whole wave band covered by integrated photonic cavity, from 𝜆 1 to 𝜆 128 , the above integral can be discretized into a system of linear equations, which can be expressed in matrix form as follows: 𝑇11 𝑌1 [𝑌2 ] [𝑇21 [ ] [ [ .. ] [ .. [.] [ . [ ]=[ [ 𝑌𝑖 ] [ 𝑇𝑖1 [ ] [ [ .. ] [ . [ . ] [ .. [𝑦𝑛 ] [𝑇𝑛1
𝑇12 𝑇22 .. . 𝑇𝑖2 .. . 𝑇𝑛2
⋅⋅⋅ ⋅⋅⋅ .. . ⋅⋅⋅ .. . ⋅⋅⋅
𝑇1𝑗 𝑇2𝑗 .. . 𝑇𝑖𝑗 .. . 𝑇𝑛𝑗
⋅⋅⋅ ⋅⋅⋅ .. . ⋅⋅⋅ .. . ⋅⋅⋅
𝑇1𝑚 𝑋1 𝑇2𝑚 ] [ 𝑋2 ] ] [ ] .. ] [ .. ] [ ] . ] ] ⋅ [ . ]. [ ] 𝑇𝑖𝑚 ] ] [ 𝑋𝑗 ] [ . ] .. ] . ] [ .. ] 𝑇𝑛𝑚 ] [𝑋𝑚 ]
(2)
For convenience, the above matrix form can be expressed as a concise form: 𝑌 = 𝑇 × 𝑋,
(3)
where 𝑌 is a 𝑛 × 1 matrix, 𝑛 is the numbers of channels, 𝑇 is a 𝑛 × 𝑚 matrix, 𝑚 > 𝑛 is an ill-conditioned matrix, 𝑚 is the spectrum data point number of 𝑇 and 𝑋, and 𝑋 is a 𝑚 × 1 matrix. From the point of digital signal processing, 𝑌 is the output signal, 𝑇 is the transfer function, and 𝑋 is the input signal. The reconstruction of the input signal is a linear inverse problem which we intend to solve. Since 𝑇 is an ill-conditioned matrix, recovering the original input signal spectrum becomes a large discrete ill-posed problem. In fact, in this work, 𝑚 > 𝑛, which means the output signal; has less detailed information than the input signal, so the spectrum reconstruction is an underdetermined systems. NMF numerical method is proposed to solve the problem and improve the resolution of integrated photonic cavity based spectroscopy. In this work, we chose 𝑚 = 1990, which is considerably larger than 𝑛 = 128; so it is difficult to get 𝑋 from measured 𝑌 and 𝑇 matrix. Then NMF constructs approximate factorizations of the form 𝑇 ≈ 𝑊𝐻 or 𝑟
𝑉𝑖𝑢 ≈ (𝑊𝐻)𝑖𝑢 = ∑ 𝑊𝑖𝑎 𝐻𝑎𝑢 . 𝑎=1
(4)
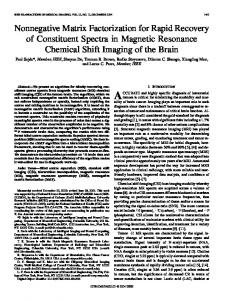
Transmission
The experimental results of the chip integrated with 128 filter channels [1, 2] are used in our numerical calculation. The resolution improving effect has been investigated.
0.65 0.60 0.55 0.50 0.45 0.40 0.35 0.30 0.25 0.20 0.15 0.10 0.05 0.00 720
740
760
780 800 820 Wavelength (nm)
840
860
880
Figure 1: Experimental spectra of the 128-channel integrated filter array cited from [1, 2]. It is used to form matrix 𝑇.
The 𝑟 columns of 𝑊 are called basis spectra. Each column of 𝐻 is called an encoding and is in one-to-one correspondence with a spectrum in 𝑇. An encoding consists of the coefficients by which the group of filter spectra represented by matrix 𝑇 is represented with a linear combination of basis spectra. The dimensions of the matrix factors 𝑊 and 𝐻 are 𝑛 × 𝑟 and 𝑟 × 𝑚, respectively. The rank 𝑟 of the factorization is generally chosen so that (𝑛 + 𝑚) × 𝑟 < 𝑛 × 𝑚, and the product 𝑊𝐻 can be regarded as a compressed form of the data in 𝑇. Obtaining the 𝑊 and 𝐻, we can have the reconstructed spectrum 𝑋 by 𝑌 and 𝑊𝐻 as follows: 𝑋=
1 𝑇 𝑇 𝑇 −1 𝑇 1 −1 𝑇 𝑌= 𝐻 (𝑊 𝑇𝐻 ) 𝑊 𝑌. Δ𝜆 Δ𝜆
(5)
NMF numerical method does not allow negative entries in the matrix factors 𝑊 and 𝐻. These non-negativity constraints permit the combination of multiple basis spectra to represent a spectrum. But only additive combinations are allowed, because the nonzero elements of 𝑊 and 𝐻 are all positive. Therefore, the non-negativity constraints are compatible with the intuitive notion of combining parts to form a whole, which is how NMF learns a parts-based representation.
3. Result and Discussion The experimental spectral results of 128 integrated photonic cavities device reported by Wang et al. [1, 2] were chosen as the basis spectra of our model, which is the highest integration of filter array reported to our knowledge. The transmission spectra of 128 integrated photonic cavities device are shown in Figure 1. The matrix 𝑇 in our calculation is generated from these spectra. The spectrum of every channel is one line in matrix 𝑇. Their passbands distribute in the range of 722.0 ∼ 880.0 nm with a bandwidth from 1.7 to 3.8 nm and an average channel interval of 1.2 nm [1, 2]. The resolution limit is 5.5 nm.
Journal of Nanomaterials
3
80 Intensity (a.u.)
70 Intensity (%)
60 50 40 30 20 10 720
740
760
780 800 820 Wavelength (nm)
840
860
880
Target Our method Conventional method
Figure 2: Comparison of resolution ability for integrated photonic cavity spectrometer itself [1, 2] and accompanied with our method.
To demonstrate the function of the NMF numerical method, we reconstruct the target spectrum on Optics Letters 32, 632 (2007) [1, 2] first. As shown in Figure 2 cited from Wang et al. 2007, the target spectrum (solid line) measured by a commercial Lambda 900 UV-Vis-NIR Spectrometer has two main feature structures; one is a two-peak structure with interval of 7 nm and another is a narrowband peak with FWHM (full width half maximum) of 3 nm. The conventional method used in the reference is normalization processing about the output spectrum from the 128-channel integrated filter array by the peak of each channel (line with empty circles). It is obvious that in the conventional method the spectrum was broadened and distorted, while the contrast of the two-peak structure was also attenuated. Using our NMF numerical method, the reconstructed spectrum (line with hollow triangles) is perfectly in agreement with the target spectrum, the FWHM of the narrowband peak is recovered to 3 nm, and the contrast of the two-peak structure is almost recovered too. To evaluate the suitability of the NMF numerical method, several typical targets spectra with different structures were reconstructed by the NMF numerical method, including a typical two-peak structure spectrum, a typical fluorescence spectrum with sharp ascending and slowly descending branch, and a typical infrared transmission spectroscopy with characteristic absorption peaks. In Figures 3, 4, 5, and 6, “Target” is the input original target spectrum (solid line), “Our method” is reconstruction spectrum by the NMF numerical method (dash line with empty triangle), and “Conventional method” is normalization processing about the output spectrum from the 128-channel integrated filter array by the peak of each channel (line with empty circles). Contrastive analysis of the three curves was given as follows. For a target spectrum with two-peak structure whose interval is 8 nm, both the integrated photonic cavity spectrometer itself and that accompanied with our method can distinguish two peaks as shown in Figure 3. Although the
750 760 770 780 790 800 810 820 830 840 850 Wavelength (nm) Target Our method Conventional method
Figure 3: The reconstruction of a typical two-peak structure with interval of 8 nm.
Intensity (a.u.)
0
760
765
770
775 780 Wavelength (nm)
785
790
Target Our method Conventional method
Figure 4: The reconstruction of a typical fluorescence spectrum with sharp edges and asymmetric peak structure.
above integrated filter array can distinguish two peaks, the measured spectrum is obviously distorted and the bandwidth is broadened for the sparse output signal date and limited spectral resolution. With the help of NMF numerical method, the spectral resolution is improved and more detail informations are recovered; so it becomes in good agreement between the original target spectrum (solid line) and reconstructed spectrum (line with hollow triangles); especially the bandwidth and contrast of the two-peak structure are improved obviously. For a typical fluorescence spectrum with sharp ascending and slowly descending branch [11], as shown in Figure 4, since only 6 filter channels cover the sharp ascending branch, it was deformed to a gentle slope and the peak shape was also distorted by the conventional method (line with empty circles). Using our NMF numerical method, the spectral resolution is improved and more date points recovered in the
Journal of Nanomaterials
Intensity (a.u.)
4
850
855
860 865 Wavelength (nm)
870
875
Target Our method Conventional method
reported in [1, 2]; the integrated photonic cavity spectrometer itself cannot distinguish the two-peak structure any more. However, it can still be distinguished clearly with our method. We find that the resolution limit is extended to 1.8 nm by using NMF numerical method. As shown in Figure 3, two peaks with interval of 1.8 nm can still be distinguished by our method. The target spectrum and reconstructed spectrum are presented by black and red lines, respectively. The two peaks are clearly distinguished. However, the peak position and spectrum line shape around peak position have shown the observable error. These results indicate that the spectral resolution is improved from 5.5 nm to 1.8 nm in the aid of nonnegative matrix factorization.
4. Conclusion
Figure 5: The reconstruction of a typical infrared transmission spectroscopy with characteristic absorption peaks.
In this work, NMF method has been used to improve the spectral resolution of integrated photonic cavity based spectroscopy. The numerical results show that it will agree with the original target better with the aid of NMF method. The spectral resolution can be improved from 5.5 nm to 1.8 nm, 3 times better than without the aid of NMF method.
Intensity (a.u.)
Conflict of Interests The authors declare that they have no conflict of interests regarding the publication of this paper.
Acknowledgments
790 792 794 796 798 800
802 804 Wavelength (nm)
806
808
810
Target Our method Conventional method
Figure 6: Comparison of resolution ability for target spectrum and the reconstructed spectrum by NMF method. The peak interval of the target is 1.8 nm.
reconstructed spectrum (line with hollow triangles), which becomes in good agreement with the original target spectrum (solid line). Similarly, for a typical infrared transmission spectroscopy with characteristic absorption peaks, the filter channels covering the absorption peaks are limited, leading to serious information loss and distorted spectral structures. As shown in Figure 5, it can also be recovered by using NMF numerical method. To evaluate the resolution limit of the 128 integrated photonic cavities device using NMF numerical method, a series of two-peak structure spectra with different interval were reconstructed, especially when the peak interval of target decreases to smaller than 5.5 nm, which is beyond the resolution limit of 128 integrated photonic cavities device
This work was supported by the Shanghai Science and Technology Foundations (11nm0502100, 12nm0502900, and 11nm0503600) and partially supported by the National Nature Science Foundation of China (no. 61106092 and no. 11374213).
References [1] S. W. Wang, C. Xia, X. Chen et al., “Concept of a high-resolution miniature spectrometer using an integrated filter array,” Optics Letters, vol. 32, no. 6, pp. 632–634, 2007. [2] S. W. Wang, M. Li, C. Xia, H. Wang, X. Chen, and W. Lu, “128 channels of integrated filter array rapidly fabricated by using the combinatorial deposition technique,” Applied Physics B, vol. 88, no. 2, pp. 281–284, 2007. [3] S. W. Wang, X. Chen, W. Lu, L. Wang, Y. Wu, and Z. Wang, “Integrated optical filter arrays fabricated by using the combinatorial etching technique,” Optics Letters, vol. 31, no. 3, pp. 332– 334, 2006. [4] S. W. Wang, D. Liu, B. Lin, X. Chen, and W. Lu, “16 × 1 Integrated filter array in the MIR region prepared by using a combinatorial etching technique,” Applied Physics B, vol. 82, no. 4, pp. 637–641, 2006. [5] S. W. Wang, D. Liu, B. Lin et al., “Realization of integrated narrow bandpass filters in the infrared region,” International Journal of Infrared and Millimeter Waves, vol. 25, no. 11, pp. 1677– 1683, 2004. [6] C. C. Chang, N. T. Lin, U. Kurokawa, and B. I. Choi, “Spectrum reconstruction for filter-array spectrum sensor from sparse
Journal of Nanomaterials
[7]
[8]
[9]
[10]
[11]
template selection,” Optical Engineering, vol. 50, no. 11, Article ID 114402, 2011. J. Oliver, W. Lee, S. Park, and H. N. Lee, “Improving resolution of miniature spectrometers by exploiting sparse nature of signals,” Optics Express, vol. 20, no. 3, pp. 2613–2625, 2012. U. Kurokawa, B. I. Choi, and C. C. Chang, “Filter-based miniature spectrometers: spectrum reconstruction using adaptive regularization,” IEEE Sensors Journal, vol. 11, no. 7, pp. 1556– 1563, 2011. J. Oliver, W. B. Lee, and H. N. Lee, “Filters with random transmittance for improving resolution in integrated photonic cavity based spectroscopy,” Optics Express, vol. 21, no. 4, pp. 3969–3989, 2013. D. D. Lee and H. S. Seung, “Learning the parts of objects by non-negative matrix factorization,” Nature, vol. 401, no. 6755, pp. 788–791, 1999. W. Lu, Y. M. Mu, X. Q. Liu et al., “Direct observation of abovequantum-step quasibound states in GaAs/AlxGa1-xAs/vacuum heterostructures,” Physical Review B, vol. 57, no. 16, pp. 9787– 9791, 1998.
5
Journal of
Nanotechnology Hindawi Publishing Corporation http://www.hindawi.com
Volume 2014
International Journal of
International Journal of
Corrosion Hindawi Publishing Corporation http://www.hindawi.com
Polymer Science Volume 2014
Hindawi Publishing Corporation http://www.hindawi.com
Volume 2014
Smart Materials Research Hindawi Publishing Corporation http://www.hindawi.com
Journal of
Composites Volume 2014
Hindawi Publishing Corporation http://www.hindawi.com
Volume 2014
Journal of
Metallurgy
BioMed Research International Hindawi Publishing Corporation http://www.hindawi.com
Volume 2014
Nanomaterials
Hindawi Publishing Corporation http://www.hindawi.com
Volume 2014
Submit your manuscripts at http://www.hindawi.com Journal of
Materials Hindawi Publishing Corporation http://www.hindawi.com
Volume 2014
Journal of
Nanoparticles Hindawi Publishing Corporation http://www.hindawi.com
Volume 2014
Nanomaterials Journal of
Advances in
Materials Science and Engineering Hindawi Publishing Corporation http://www.hindawi.com
Volume 2014
Journal of
Hindawi Publishing Corporation http://www.hindawi.com
Volume 2014
Journal of
Nanoscience Hindawi Publishing Corporation http://www.hindawi.com
Scientifica
Hindawi Publishing Corporation http://www.hindawi.com
Volume 2014
Journal of
Coatings Volume 2014
Hindawi Publishing Corporation http://www.hindawi.com
Crystallography Volume 2014
Hindawi Publishing Corporation http://www.hindawi.com
Volume 2014
The Scientific World Journal Hindawi Publishing Corporation http://www.hindawi.com
Volume 2014
Hindawi Publishing Corporation http://www.hindawi.com
Volume 2014
Journal of
Journal of
Textiles
Ceramics Hindawi Publishing Corporation http://www.hindawi.com
International Journal of
Biomaterials
Volume 2014
Hindawi Publishing Corporation http://www.hindawi.com
Volume 2014