NSOM: A Tool To Detect Denial Of Service Attacks Using Self-Organizing Maps Khaled Labib and V. Rao Vemuri Department of Applied Science University of California, Davis U.S.A.
[email protected] and
[email protected]
Abstract. An implementation of a network based Intrusion Detection System using a SelfOrganizing Map (SOM) as a clustering tool is described. The system uses a SOM to classify Ethernet data in real-time. A graphical tool constantly displays the clustered data to reflect network activities. The impact of using different techniques for data collection, data preprocessing and classifier design is discussed. The system shows promise in its ability to classify regular traffic verses irregular traffic as a result of a Denial of Service (DoS) attack on a given host. I. Introduction With the growing rate of interconnections among computer systems, network security is becoming a major challenge. In order to meet this challenge, Intrusion Detection Systems (IDS) are being designed to protect the availability, confidentiality and integrity of critical networked information systems. Automated detection and immediate reporting of intrusion events are required in order to provide a timely response to attacks. Early in the research into IDS, two major approaches known as anomaly detection and signature detection were arrived at. The former relies on flagging behaviors that are abnormal and the later flagging behaviors that are close to some previously defined pattern signature of a known intrusion [1]. NSOM, the Network-based Self-Organizing Map presented in this paper, is an anomaly detection system for detecting Denial of Service attacks.
In a Denial of Service (DoS) attack, the attacker makes some computing or memory resource too busy, or too full, to handle legitimate users’ requests. There is a wide variety of DoS attacks. Some DoS attacks (like mailbomb, neptune, or smurf) abuse a perfectly legitimate feature of the networking protocol. Some others (like teardrop, Ping of Death) create malformed packets to confuse the TCP/IP stack of the victim machine that is trying to reconstruct the packet. Some others (like apache2, back, and syslogd) exploit bugs in a particular network daemon. A more serious form of DoS attacks uses thousands of compromised computer systems in a distributed environment to attack one or more machines and entirely consume their resources quickly. This type of attack is referred to as Distributed Denial of Service (DDoS) attack. Despite the fact that most recent IDS’s and routers employ mechanisms for detecting DoS attacks, very few attempt to address the detection of DDoS attacks. This is due to the fact that in DDoS attacks, the IDS or the router would not be able to easily distinguish between legitimate users accessing the system with very different Internet Protocol (IP) addresses and an organized distributed attack from thousands of machines. This problem is further exacerbated when the attackers use IP spoofing to redirect a large number of responses from the compromised systems back to the victim. This has the effect of flooding the victim with packets while hiding the identity of the attacking systems. Even though NSOM attempts to detect DoS attacks, the authors believe that it could be used to detect DDoS attacks reliably since the
clustering features of the SOM remains applicable between the two attack types. To test the ability of NSOM to detect DDoS attacks, a lab setup is currently under planning. This setup will utilize a network simulation platform to simulate DDoS attacks and will allow for examining the behavior of NSOM when subjected to such attacks. Both DoS attacks and its distributed variant are still widely employed by attackers worldwide despite being old and well known techniques. They are considered to be simple to launch and very effective in causing critical servers to deny service to its legitimate users or causing them to completely crash. The focus of this paper is to create a prototype system, NSOM, to classify network traffic in real-time. The system is implemented as a combination of C and TCL/TK, (the Tool Command Language with a graphical user interface Tool Kit). Network data is constantly collected from a network port. This data is preprocessed and features suitable for classification are selected. The classification process is then started - a chunk of packets at a time - and then the resulting classification is sent to a graphical tool that displays the activities that are taking place on the network port dynamically as more packets are received. The hypothesis is that routine traffic that represents normal behavior for a given host would be clustered around one cluster center of the Self-Organizing Map (SOM) and any irregular traffic representing abnormal and possibly a DoS attack would be clustered outside of the normal clustering. The clustering process is a mapping process of the input traffic to output clusters through which any topological relations among the features of the input stream are preserved. This clustering process is achieved using a SOM. The Self-Organizing Map [2] is a neural network model for analyzing and visualizing high dimensional data. It belongs to the category of competitive learning networks. The SOM is based on unsupervised learning to map nonlinear statistical relationships between highdimensional input data into a two-dimensional lattice. This mapping is topology preserving. The property of topology preserving means that points near each other in the input space are mapped to nearby map units in the SOM.
The remainder of the paper is organized as follows. In Section II, related work in the field is reviewed. In Section III, the merit of selecting SOM is discussed. In Section IV, the process of data collection and preprocessing is described in details. In Section V, the structure used for the SOM is presented. In Section VI, the results obtained from the experiment are shown and Section VII is the conclusion. II. Related Work There are some studies that attempt to apply Self Organizing Maps as a tool to address network intrusion detection in general, and denial of service attack detection in particular. A system developed by Lichodzijewski et al [3] applies hierarchical unsupervised neural networks (Self-Organizing Feature Maps) to the intruder detection problem. Specific emphasis is given to the representation of time and the incremental development of the hierarchy. Many anomaly detection systems utilize ANNs (Artificial Neural Networks). For example, in HyperView [4], a sample of the system’s normal traffic is fed to an ANN, which subsequently learns to recognize certain features in this sample of normal traffic. New traffic, including possible attacks, is then applied to the ANN and the learned system recognizes abnormal traffic from normal one. Other systems utilize descriptive statistics by collecting uni-modal statistics from certain system parameters into a profile, and construct a distance vector for the observed traffic and the profile. If the distance is large enough the system raises an alarm. Examples of these systems are NIDES [5], EMERALD [6] and Haystack [7]. A system developed by Rhodes et al [8] uses multiple self-organizing maps for intrusion detection. They use a collection of more specialized maps to process network traffic for each layered protocol separately. They suggest that each neural network becomes a kind of a specialist, trained to recognize the normal activity of a single protocol. Another approach that differs from anomaly detection and misuse detection considers human factors to support the exploration of network traffic [9]. They use self-organizing maps to project the network events on a space appropriate
for visualization, and achieve their exploration using a map metaphor.
receivers and the protocols are preserved by the mapping.
Both of [8] and [9] use static logs and do not address the real-time issues that are addressed in the design of NSOM, like performance and classification speed. Real-time performance can be best achieved by minimizing the processing of data, and therefore using simpler designs. They also do not describe how to handle the problem of representing time in their work. Time representation is believed to be an important element when analyzing network traffic considering that DoS attacks take place using a number of successive packets that are targeted towards a host in a finite time span.
There are two steps in the training process for a SOM. First, a winner h c(t,k) (AKA. Best Matching Unit) is searched, which minimizes the following Euclidean distance measured between input vector data sample x and the map unit mk, where the map units are the neurons represented by the white circles in Figure 5:
III. Why SOM ? Unsupervised learning using SOMs provide a simple and efficient way of classifying data sets. To process real-time data for classification, SOMs are best suited due to their high speed and fast convergence rates as compared to other learning techniques. Also SOMs preserve topological mappings between input and output representations as described earlier, a feature which is desired when classifying normal verses abnormal behavior for network data. For example, if a set of features at the input to the classifier are related to each other via a specific distance measure, then a mapping that preserves the topology between the input and output feature vectors would produce a set of output features that are also analogously related to each other in the output map. In the case of NSOM which uses the sender and receiver IP addresses along with the protocol types as the primary features, the relationships between senders,
c = arg min k x − m k Then, the map units in the neighborhood of the winner unit are updated according to a neighborhood function. This update step can be carried out by applying the following formula:
[
]
m k (t + 1) = m k (t ) + α (t )h c (t , k ) x(t ) − mk (t ) where the last term in the square brackets is proportional to the squared Euclidean distance :
(
)
d x , mk = x − mk
2
The learning rate:
α (t ) ∈ [0,1] must be a decreasing function of time and the neighborhood function h c(t,k) is a non-increasing function around the winner unit. Figure 1 depicts a flow chart implementation of NSOM. The diagram shows the different steps the system performs to achieve real time classification of network traffic.
has tens of other hosts, which are running several daemons such that data and control frames are constantly flowing across the subnet. Control frames are mostly Internet Control Message Protocol (ICMP) packets. The popular Linux tool called “tcpdump” was used for the purpose of data collection and filtering on the victim. Tcpdump is a powerful tool that allows us to put the Ethernet controller in a promiscuous mode to monitor all packet activities on the subnet. Its powerful filtering capabilities can also be used to filter out unwanted traffic and isolate broadcast, multicast and control frames. Figure 2 depicts the network setup used to test NSOM.
Figure 1: Block Diagram of NSOM IV. Data Collection and Preprocessing The test bed for this experiment (see Figure 2) is comprised of a PC (host 1) running Linux that is connected to a local network via an Ethernet controller. The subnet that host 1 is connected to
Figure 2: Subnet For Testing NSOM Tcpdump was used to collect all network traffic to or from the host, discarding packets that are intended for other hosts. Tcpdump is run as a background process, which dumps the information it collects into a file on a regular basis. Every time n packets were collected they
When writing the packets to the disk in each processing cycle, the information written is minimized using special tcpdump flags and command line options. The command used is: tcpdump -c 50 -w dump host victim-machine After storing the packet information onto disk, a choice had to be made as to what information from this file to use for the SOM classifier. The choice of which traffic features to represent and how to translate them in a form suitable for the SOM, will unavoidably involve highlighting certain aspects of the network activity while making others invisible to the classifier [8]. Tcpdump stores a lot of information regarding each packet including its arrival time, source and destination IP addresses, all encapsulated protocols used within the IP protocol. It also identifies certain protocol packets such as SYN and FIN indicating packets sequence numbers and whether fragmentation is allowed or not. Only a portion of the information received was selected to serve as a feature list for the packet, as follows: For each Ethernet packet received { - Extract the IP address of the destination: Use the least significant two numbers only for classification
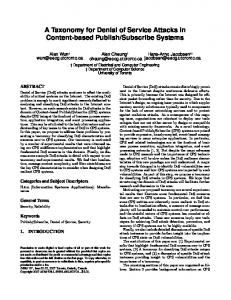
- Extract the IP address of the source: Use the least significant two numbers only for classification - Extract the protocol type } The IP addresses for both the destination and source are in the form of 4 decimal numbers separated by dots. (e.g. 196.138.45.3). Only the least significant two nibbles of the IP address were selected to represent either the source or the destination, instead of using the whole IP number. This is because the network that the host system is connected to is a Class C network, where the upper two nibbles are always the same. Since the upper two nibbles do not change for the subnet used in the experiment, it was decided not to use them since they could potentially pollute the classification results as being redundant background presented to the classifier. NSOM sources could be configured to allow including the entire IP address if this behavior is desired. Using the entire four nibbles from the source and destination IP addresses is required for hosts that receive traffic from various heterogeneous sources, like those hosts connected directly to the Internet. Figure 3 shows the rate of packet collection under different traffic loads. For n = 50 packets, and under light traffic typically represented by control packets, it takes roughly 8 minutes to collect the n packets. Under heavy traffic simulating a DoS attack, it takes only a few seconds to collect the n packets.
14
Time in minutes
are stored in a file for further preprocessing and classification as described below, and then the process is repeated. All the different system parameters such as the number of packets to collect per processing cycle, input vector width, number of input vectors and other parameters associated with the classifier, are easily configurable in the NSOM source code header files to be customized for any given host. A value of n = 50 packets was used here since this was the most suitable number to use given the amount of traffic involving the host system in the subnet. The average number of packets received by a host on the subnet is about 1 packet per second under minimum load. This value of n constitutes the “window” that packets are analyzed through. If this value is too small, then there is a potential risk of losing important relationships between the packets that would otherwise show specific important patterns characteristics. If the value is too large, then the real-time effect could be lessened due to the fact that the graphical updates would be less frequent, especially for hosts with light traffic.
12 10 8 Light Traffic 6
Heavy Traffic
4 2 0 5
10
25
50
75
Number of collected packets
Figure 3: Rate of packet collection
Another important feature of a packet is the protocol type. Protocol type can include either TCP or UDP. Several different protocols that are based on TCP and UDP, such as ICMP, ARP and RARP are supported. Since all protocol type names are decoded by tcpdump as text, the text is converted to a decimal number by adding the ASCII values of all its characters, and 5 characters, at most, from each protocol type name are used for the representation. For example, the TCP protocol consists of three letters: t, c and p. The ASCII value of the three letters which are 116, 99 and 112 respectively are added to form the protocol value of 327. This provides a uniform representation of the protocol type eliminating the need to know the protocol number apriori. The effect of dynamically assigning IP numbers to different hosts using DCHP or a similar protocol will have a minimal impact on the clustering process, since hosts typically request a new dynamic IP address upon power up and maintain this address for a long period of times, typically weeks, before they are powered down again. So the rate by which a dynamic IP address changes for a given host is very low as compared to the frequency of updates in this implementation which is in the order of minutes and seconds. Figure 4 shows a sample output from tcpdump for the traffic on the subnet. The figure shows source and destination IP addresses and the protocol type for each packet. 219.253.138.20.123 > 219.253.166.63.123: udp 48 219.253.166.63 > 219.253.138.20: icmp: 219.253.166.63 udp port 123 unreachable (DF) arp who-has 219.253.138.1 tell 219.253.138.20 arp reply 219.253.138.1 is-at 0:0:c:7:ac:0 219.253.138.20.123 > 196.216.63.1.123: udp 48 219.253.138.20.123 > 196.216.63.2.123: udp 48 219.253.138.20.123 > 219.253.166.63.123: udp 48 219.253.133.46 > 219.253.138.20: icmp: echo request (DF) 219.253.138.20 > 219.253.133.46: icmp: echo reply 219.253.133.46 > 219.253.138.20: icmp: echo request (DF) 219.253.138.20 > 219.253.133.46: icmp: echo reply 219.253.133.46 > 219.253.138.20: icmp: echo request (DF) 219.253.138.20 > 219.253.133.46: icmp: echo reply
Figure 4: Sample output from tcpdump showing UDP, ARP and ICMP packets Data Normalization The feature vector of a packet consists of five features representing partial destination and
source addresses and the protocol type as described earlier. That is, two nibbles from the sender IP address, two from the receiver IP address and one for the protocol type. Choosing more features beyond the protocol type would require decoding the fields for each encapsulated protocol which increases computational requirements that are critical for real-time processing and affects the convergence speed and stability of the SOM. Due to the large variations of these numbers, each vector was initially normalized such that its components are in the range of [-1,1]. This makes it more suitable for SOM applications. The standard normalization given by:
nv[i ] =
v[i ]
∑ v[k ]
2
K
is used for this purpose. Here nv[i] is the normalized value of feature (i), v[i] is the feature value of i, and k is the number of features in a vector. Time Representation Even though packet arrival and departure times were explicitly available before the data was preprocessed, it was decided not to use explicit time representation. Rather, an implicit time representation scheme was used. In this scheme, n successive packet features are gathered to form one input vector for the classifier. This vector is called the SOM Input Vector. So the classifier looks at m packets at a time in the same order they arrive at the network port. The value chosen for m in the experiment was 10. Again, NSOM can be configured for different values if so desired. V. Neighborhood Structures of the SOM Both linear and diamond structures were considered while defining neighborhoods and the diamond structure gave better classification performance. For Linear structure, the winning neuron was updated along with a neighborhood distance of R, representing the number of neighbor neurons to update. In this case a number of R = 1 was chosen. For Diamond structure the winning neuron was updated along with a neighborhood distance of R. The
neighboring neurons in this case were the top, bottom, left and right neurons of the winning neuron, which resembles a diamond-like structure. In this case a value of R = 1 was chosen, which means that four neurons would be updated in addition to the winning neuron, given a central neuron. The process of updating the weight vector for the winning neuron, shown in red in Figure 5, will also update the weight vectors for the four neighboring neurons, shown in yellow in the same figure, according to the equation from section III:
[
]
m k (t +1) = m k (t ) + α (t )hc (t , k ) x(t ) − mk (t )
In this experiment there were 25 output neurons that are used to cluster m = 10 packets. In the case of the diamond structure they are virtually arranged as a 5x5-matrix plane. The SOM implementation chosen was a Kohonen Net with the winning neuron representing the one with the shortest distance as related to the input vector. The starting value of the learning parameter was chosen to be α = 0.6. This value decrements by 0.5 in each successive epoch until convergence.
Figure 5: SOM structure and training vectors layout
After v successive input vectors are collected, and normalized, the process of classification is started until convergence is reached. A value of v = 5 was chosen in this experiment. When convergence is reached, meaning that no further changes are taking place in the winning neurons between successive epochs, the winning neuron values and their locations are sent to a graphical tool that displays these values in a twodimensional form. The display maintains the old values as well as the newer ones to show the clustering and accumulation effects. During this time, another set on n packets are stored from the network interface into a file as the following batch. On heavy network loads, few packets could be dropped and could practically go by without reaching the classifier, but it is believed that their would not be much risk involved with this situation, since it is difficult for an attacker to finish an DoS attack with very few packets involved. Limitations of NSOM Network intrusions in practice could take many forms and involve several attack techniques. Most of these attacks exploit the vulnerabilities of the networking infrastructure including routers, servers and operating systems. A denial of service attack typically floods a given victim with a large number of packets such as SYN floods and ICMP floods, possibly with spoofed IP addresses to hide the identity of the attacker. The victim’s resources will be quickly consumed trying to service these requests and will soon be unable to service legitimate users of the system, thereby denying them service. DoS attacks are taken one step further by using a compromised set of hosts to attack a single victim using massive floods of packets with spoofed IP addresses. This is called a Distributed DoS attack (DDoS). In a DDoS attack, a malicious user at one host crafts one or many ICMP echo requests to a broadcast address of an amplification site with a spoofed source IP of the target host. Many amplification hosts can magnify the intensity of the attack [10]. DoS attacks and its more powerful variation, DDoS attacks, are old techniques but are still very effective and commonly used. DDoS attacks are sometimes very difficult to detect using existing Intrusion Detection Systems since these systems can not easily tell legitimate users packets from spoofed ones. NSOM is best suited for detecting both DoS and DDoS attacks since these attacks manifest in large numbers, which affect the
clustering process. On the other hand, NSOM is not suitable for detecting other types of attacks especially the ones involving very few packets and stealth attacks in general. These attacks, with very few packets, will not have any significant effect on the clustering process, thereby will not provide for any detection mechanism. VI. Results To test NSOM, sample results were first obtained statically by collecting samples representing normal network traffic as well as simulated DoS attacks. The output of the classifier was examined for each case and it was noticed that all normal network traffic was clustered roughly between neurons 5 and 16. When the classifier was subjected to various simulated DoS attacks, such as frequent SYN packets and heavy ping (ICMP req) packets, it was noticed that neuron activities began to be scattered much outside the normal cluster window as indicated in Figure 6 and Figure 7. The new range for activated neurons was expanded to cover between neurons 0 to 18 indicating a possible attack.
Figure 6: Output of classifier for normal traffic. X-axis represents output neuron number. Y-axis represents its distance from input vector.
When the results were more stable, NSOM was tested using real-time traffic. Network data were collected, classified and graphically displayed constantly in real-time. Similar behavior as with static testing was noticed. It is interesting to note that the Y values, on the graph, of the attack neurons were much higher than those for normal ones. Since the Y values represent the distance of the winning neurons with respect to the input vector, it can be concluded that these high Y value neurons represent uncommon and irregular behavior and therefore a possible attack.
Figure 7: Output of classifier for a simulated DoS attack The results support the initial hypothesis that similar network traffic that take place routinely, that is from/to common IP addresses and common protocol type patterns, could be classified by a close set of relatively fixed neurons. Thereby, abnormal behavior that could be a result of a DoS or DDoS attack will be characterized by a different set of neurons that span a larger area on the output neuron map.
VII. Conclusion The implementation of a prototype system for classifying real-time network traffic using SelfOrganizing Maps (SOM) for the purpose of intrusion detection of DoS attacks was described. The motives behind using unsupervised learning for this purpose was presented, along with data collection and preprocessing procedures, how time was represented and the technique for displaying the classification results. The structure of the SOM was discussed along with how testing was conducted. The results showed that NSOM was able to classify simulated DoS network attacks graphically as opposed to normal traffic by showing that the clustering of neurons was very different between the two.
Acknowledgements. Work reported in this paper is supported in part by the US AFOSR award F49620-01-1-0327 to the Center for Digital Security, University of California, Davis. References [1] Axelsson S., “Intrusion Detection Systems: A Survey and Taxonomy”. Technical report 99-15, Department of Computer Engineering, Chalmers University of Technology, Goteborg, Sweden, March 2000. [2] Kohonen T., “Self-Organizing Maps”. New York, Springer-Verlag, 1995. [3] Lichodzijewski P., Zincir-Heywood A.N., Heywood M.I., “Dynamic Intrusion Detection Using Self Organizing Maps”. 14th Annual Canadian Information Technology Security Symposium, May 2002 [4] Debar H., Becker M., Siboni D., “A Neural Network Component for an Intrusion Detection System”. Proceedings of the 1992 IEEE Computer Society Symposium on Research in Security and Privacy, Oakland, CA May 1992 [5] Anderson D., Frivold T., Valdes A., “NextGeneration Intrusion Detection Expert System (NIDES). Technical Report SRICSL-95-07, Computer Science Laboratory, SRI International, Menlo Park CA , May 1995 [6] Porras P., Neumann P., “EMERALD: Event monitoring enabling responses to anomalous live disturbances”. Proceedings of the 20th
National Information Systems Security Conference, Baltimore, Maryland 1997 [7] Smaha S., “Haystack: An Intrusion Detection System” Proceedings of the IEEE forth Aerospace Computer Security Applications Conference, Orlando, Florida, 1988 [8] Rhodes B., Mahaffey J., Cannady J., “Multiple Self-Organizing Maps for Intrusion Detection”. Proceedings of the NISSC 2000 conference, Baltimore M.D. 2000. [9] Girardin L., “An Eye on Network IntruderAdministrator Shootouts”. Proceedings of the Workshop on Intrusion Detection and Network Monitoring, Santa Clara, CA, USA, April 9-12, 1999. [10] Northcutt S., Novak J., “Network Intrusion Detection: An Analyst Handbook”. Second Edition, September 2000, New Riders Publishing.