Annales Geophysicae, 23, 2377–2384, 2005 SRef-ID: 1432-0576/ag/2005-23-2377 © European Geosciences Union 2005
Annales Geophysicae
Numerical simulation of mid-latitude ionospheric E-region based on SEEK and SEEK-2 observations T. Yokoyama1,3 , M. Yamamoto1 , S. Fukao1 , T. Takahashi2 , and M. Tanaka2 1 Research
Institute for Sustainable Humanosphere, Kyoto University, Kyoto, Japan Science Laboratory, Tokai University, Kanagawa, Japan 3 now at: Solar-Terrestrial Environment Laboratory, Nagoya University, Aichi, Japan 2 Information
Received: 20 December 2004 – Revised: 10 June 2005 – Accepted: 13 July 2005 – Published: 13 October 2005 Part of Special Issue “SEEK-2 (Sporadic-E Experiment over Kyushu 2)”
Abstract. Observational campaigns of the mid-latitude ionospheric E-region with sounding rockets and ground-based instruments were conducted in 1996 (SEEK) and 2002 (SEEK2). Both of them were successfully conducted to bring important findings about the mid-latitude E-region and quasiperiodic (QP) VHF radar echoes. The observational results in the SEEK and the SEEK-2 are compared with numerical simulations and discussed in this paper. While sporadicE (Es )-layers are actually formed by the observed neutral wind, it is difficult for the constant wind shear to produce the sharp Es -layer gradient. However, once they are formed in the lower E-region, they cannot easily be dissipated by the simple diffusive motion. The polarization electric field, calculated under the condition at the rocket launch time, shows similar amplitude and structure to the measurement around the Es -layer altitude. The structure of the plasma density and the electric field above the Es -layer observed in the SEEK-2 showed a wave-like pattern up to an altitude of 150 km. Considering a mapping of the polarization electric field generated within the Es -layers, gravity waves are the possible source of the wave-like structure of the measured electric fields and sub-peaks of the electron density above the main Es -layers. Fluctuation of the measured magnetic field is reproduced by Hall or field-aligned current driven by the polarization electric field. The current theoretical models for QP echoes and the polarization electric field are basically verified by the discussion in this paper. Keywords. Ionospheric irregularities – Mid-latitude ionosphere – Numerical simulation studies
1 Introduction Quasi-periodic (QP) echoes associated with sporadic-E (Es ) layers in the mid-latitude E-region have been intensively Correspondence to: T. Yokoyama (
[email protected])
studied since the first discovery with the MU radar (Yamamoto et al., 1991). QP echoes tend to appear above about an altitude of 100 km in the post-sunset period during the summertime and usually have striated structures in range-time-intensity (RTI) plots. Most plasma irregularities in the mid-latitude E-region are believed to be produced by gradient-drift instability induced by steep plasma density gradient of Es -layers (e.g. Ecklund et al., 1981). Recent studies have proposed that the polarization electric field associated with horizontal inhomogeneity of an Es -layer plays an important role in the generation of QP echoes (Haldoupis et al., 1996; Tsunoda, 1998; Maruyama et al., 2000). Altitude-modulated or inhomogeneous structure of Es -layers has observationally been shown in association with the appearance of QP echoes (Ogawa et al., 1998, 2002). Electrical coupling between the E and the F -regions should also be important for the generation of the polarization electric field (Cosgrove and Tsunoda, 2003, 2004; Cosgrove et al., 2004; Yokoyama et al., 2004a). Neutral dynamics in the lower thermosphere should also be important for the E-region plasma irregularities. Kagan and Kelley (1998, 2000) and Kagan (2002) first proposed wind-driven gradient-drift and thermal mechanisms for E-region irregularities. Kagan and Kelley (1998) showed that both sides of an Es -layer can be unstable by neutral wind shear to produce the Es -layer. Larsen (2000) suggested that the shear instability should frequently occur at the lower E-region and modulate Es -layers to initiate gradient-drift instability. Two observational experiments with sounding rockets and ground-based instruments were conducted in 1996 and 2002, which are called the SEEK (Sporadic-E Experiment over Kyushu) and the SEEK-2 campaigns, respectively (Fukao et al., 1998; Yamamoto et al., 2005). Two sounding rockets were successfully launched in each campaign (S-310-25 and S-310-26 in the SEEK, and S-310-31 and S-310-32 in the SEEK-2), and brought important findings about the midlatitude E-region. Electron density measurements revealed that the Es -layers were not deeply modulated, as suggested
2378
T. Yokoyama et al.: Simulation based on SEEK and SEEK-2
by Woodman et al. (1991) and Tsunoda et al. (1994) but horizontally stratified around 100 km and that several subpeaks were detected above the main Es -layer (Yamamoto et al., 1998; Wakabayashi et al., 2005). Neutral wind velocity measured by trimethyl aluminum (TMA) release experiments showed a maximum magnitude of 150 m/s and a strong shear, which was in good agreement with the altitude of the main Es -layer (Larsen et al., 1998, 2005). The measured electric field in the SEEK exceeded 10 mV/m with small-scale fluctuations of 5–10 mV/m below 130 km (Pfaff et al., 1998). In the SEEK-2, on the other hand, the fluctuated electric field was detected only below 108 km, with the maximum amplitude of about 5 mV/m (Pfaff et al., 2005). At higher altitudes, there was sinusoidal variation of the electric field with a wavelength of 15–20 km in both measurements. Pfaff et al. (1998) interpreted the variation as due to atmospheric gravity waves. It has been confirmed with numerical simulations that the large polarization electric field can be generated in association with inhomogeneous Es -layers or a neutral wind shear (Hysell et al., 2002; Cosgrove and Tsunoda, 2003; Yokoyama et al., 2003, 2004a). QP structures of plasma density in the E-region can be produced through the polarization electric field by atmospheric gravity waves, even if the Es -layer does not initially contain inhomogeneous structures (Yokoyama et al., 2004b). However, quantitative comparison between rocket measurements and numerical simulations has never been conducted. In this paper, we study the generation of QP echoes in the mid-latitude E-region, comprehensively based on the direct measurements in the SEEK and the SEEK-2 and numerical simulations. We pay attention to the striking observational results during the QP echo appearance from SEEK and SEEK-2:
tively. The momentum equation for each species is written as
1. neutral wind shear associated with Es -layers (Larsen et al., 1998, 2005), 2. sub-peaks of electron density above the main Es -layers (Yamamoto et al., 1998; Wakabayashi et al., 2005),
qj kB T ∇Nj (E + V j × B) − + νi (U − V j ) = 0, Mj M j Nj
where the subscript j denotes the species (NO+ , Fe+ , and electrons), q is the charge including its sign, M is the mass, E is the electric field, V is the velocity, B is the geomagnetic field with |B|=4.6×10⁻⁵ T, kB is the Boltzmann constant, T is the plasma temperature, N is the density, ν is the collision frequency with neutrals, and U is the neutral wind velocity. Gravity and inertial terms are neglected. The continuity equations of the ion species are calculated separately, which are written as ∂NFe+ + ∇ · (NFe+ V Fe+ ) = 0 ∂t
(2)
∂NNO+ + ∇ · (NNO+ V NO+ ) = P − αNNO+ Ne , ∂t
(3)
where P and α are the production rate and the recombination coefficient of NO+ , respectively (Yokoyama et al., 2004b), and Ne (=NFe+ +NNO+ ) is the electron density. Production and recombination of Fe+ are neglected and only the transport of Fe+ is taken into account. The polarization electric field is obtained to satisfy a divergence that is free of current as ∇ · J = ∇ · [eN (V i − V e )] = 0
4. fluctuation of the magnetic field.
2
Model description
The numerical model applied in this study is based on that of Yokoyama et al. (2004b), who uses the three-dimensional Cartesian coordinate in which the geomagnetic field is in the meridional-vertical plane with a dip angle of 45◦ . The integrated F -region conductivity is applied at the top boundary (140 km) and periodic boundary conditions are applied in both horizontal directions. Positive ions are divided into metallic and molecular species of Fe+ and NO+ , respec-
(4)
where, for simplicity, the motion of positive ions V i is treated as a single fluid by assuming in Eq. (1) that V j =V i , Nj =Ne , and Mi =(MFe+ NFe+ +MNO+ NNO+ )/Ne . MSISE90 and IRI-95 models are used for background and boundary conditions of the neutral atmosphere and the ionosphere (Hedin, 1991; Bilitza et al., 1993). 3 3.1
3. wave structure of the electric field (Pfaff et al., 1998, 2005), and
(1)
Numerical results and comparison with observations Formation of Es -layer
At first we simulate the formation and diffusion of Es -layers by applying the neutral wind observed in SEEK and SEEK-2 with a grid spacing of 250 m. The top panel of Fig. 1 shows the neutral wind observed in SEEK, which is interpolated for the simulation grid points. The initial NO+ density is chosen at a pre-sunset period from the IRI-model, while Fe+ is assumed to have a broad Gaussian distribution with a peak at 102 km (dotted lines in the middle panel of Fig. 1). The middle panels of Fig. 1 show time variation of Fe+ and NO+ density produced by the neutral wind shown in the top panel. Fe+ is accumulated by the neutral wind at 102 and 117 km, where the zonal wind changes from eastward to westward with increasing altitude. These Fe+ peaks are well correlated to the plasma density structures observed in SEEK. Since the vertical motion of ions due to the zonal wind is large at higher altitude, the smaller zonal wind shear at 117 km (10 m/s/km)
T. Yokoyama et al.: Simulation based on SEEK and SEEK-2 can produce the comparable plasma density gradient to that at 102 km (60 m/s/km). NO+ , on the other hand, is largely influenced by the recombination process (right-hand side of Eq. (3)). At the peaks of Fe+ , NO+ density depleted because of enhanced recombination due to the increased Ne . In order to see a diffusion effect on plasma density, plasma is left for 1 h with stopping the neutral wind after a 30 min accumulation, as shown in the bottom panels of Fig. 1 (the solid lines in the middle panels correspond to the dotted lines in the bottom panels). Since diffusion is inversely proportional to the ion-neutral collision frequency, diffusion of the peak of Fe+ at 117 km is much faster than that at 102 km. While the peak density after 1 hour at 117 km is decreased to 45% of the initial value, the peak at 102 km is still 83%. Once Es -layers are formed at around 100 km, they can persist for several hours and cannot easily be dissipated by the simple diffusive motion. NO+ , on the other hand, reached chemical equilibrium within the first 20 min and kept the nighttime background density of the order of 103 cm−3 . Compared with the electron density measured by the rockets (Yamamoto et al., 1998), the main peak detected at around 100 km is reproduced by the main zonal wind shear. The peak and background densities are also comparable to the observed values. However, many sub-peaks detected with the rocket above 100 km could not be reproduced by the simulation as long as the neutral wind did not vary for 30 min. The plasma density structure above the main Es -layer is not simply formed by the local wind shear but, for example, by polarization electric fields, as discussed later (e.g. Yokoyama et al., 2003). Figures 2 and 3 show the neutral wind observed in the SEEK-2 (Larsen et al., 2005) and plasma density profiles produced by the simulation for the upleg and downleg, respectively. Since the neutral wind was obtained only up to 110 km, we linearly extrapolated the wind by assuming no wind at 120 km. Although the neutral wind profiles from the upleg and downleg look quite different, plasma densities produced by both winds show similar structures, namely, the main peak at 106 km and the sub-peak at 101 km. Another sub-peak is produced at 98 km by the extremely large zonal wind shear observed in the downleg. While the reproduced multi-peak structure looks consistent with the electron density measurement around the main Es -layer (Wakabayashi et al., 2005), a sharp gradient of the Es -layer cannot be reproduced in the simulation. It is inferred that the main Es -layers observed in both rocket experiments should be produced by the zonal wind shear which was also observed with rockets. However, the plasma density profiles cannot fully be reproduced only by applying the constant neutral wind. The spatial and time variation of the neutral wind which is expected from the upleg and downleg in SEEK-2 should play an important role in producing Es -layers. 3.2
Amplitude of polarization electric field
Yokoyama et al. (2004a) have shown that neutral winds generate polarization electric fields effectively in the lower Eregion when an Es -layer contains zonally-elongated higher-
2379
Fig. 1. Neutral wind profiles observed in SEEK which are interpolated for the simulation grid points (top), plasma density profiles produced by the neutral wind every 10 min (middle), and diffusion of the plasma after stopping the neutral wind every 20 min (bottom).
density plasma clouds. We can verify this mechanism by comparing the neutral wind and the electric field data from the SEEK-2 campaign with those of our numerical simulation. As mentioned above, the observed neutral winds and electron density profiles are qualitatively consistent with each other. We use a simple model of a horizontal structure of Es -layers that is the same as that used by Yokoyama et al. (2004a), and scale its plasma density and altitude to fit to the
2380
T. Yokoyama et al.: Simulation based on SEEK and SEEK-2
Fig. 2. Same as top and middle panels of Fig. 1 but for the upleg of the SEEK-2.
Fig. 3. Same as Fig. 2 but for the downleg of SEEK-2.
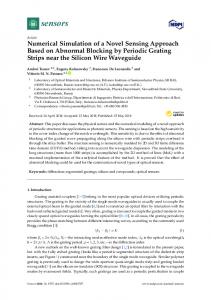
background Es -layer during the SEEK-2 rocket experiment. The Es -layer is then located at 103 km and the plasma density is set to satisfy the critical frequency fo Es =7.2 MHz and the blanketing frequency fb Es =2.2 MHz, which were derived from the simultaneous ionogram at Yamagawa, 40 km west of the rocket range. The neutral wind observed with the TMA release experiment during the upleg is applied. Other conditions are adopted from the IRI-model at the rocket launch time. The grid spacing is 500 m which is the same as Yokoyama et al. (2004a). Figure 4 shows the generated polarization electric fields on the meridional-vertical plane (top) and the horizontal plane (bottom). Background gray scales represent plasma density in the sliced 2-D planes, and arrows represent the polarization electric fields. The value shown at the upper right corner indicates the maximum value which corresponds to the longest arrow. Since the southward neutral wind is dominant at the Es -layer altitude, the polarization electric fields are mainly directed northward and slightly westward, with a maximum amplitude of 5.5 mV/m through the same mechanism as Yokoyama et al. (2004a). This behavior roughly agrees with the observed electric field around 100 km by the S-310-31 rocket (Pfaff et al., 2005). In Fig. 4, we can find that the electric fields are oppositely directed at
western and eastern edges of the plasma cloud. From the experiment, Pfaff et al. (2005) reported some sudden changes in the direction of the electric field at 115, 128, and 139 km, which may be due to the steep plasma density gradient at the edge of the plasma cloud. The southwestward or southeastward electric field observed above 108 km, however, cannot be explained only by assuming this simple plasma structure and the uniform neutral wind. The observed complicated electric fields imply that Es -layers contain various shapes of plasma clouds. Considering the large variability of the neutral winds during the upleg and downleg in SEEK-2 (Larsen et al., 2005), we should expect that neutral winds are not horizontally uniform but turbulent, with a scale of several tens of kilometers. Spatial structure of the Es -layers should also be essential to determine the polarization electric field. 3.3
Modulation by gravity waves
Yokoyama et al. (2004b) showed that gravity waves generated in the troposphere can modulate an Es -layer significantly and produce polarization electric fields of several mV/m. We use this simulation result to discuss an electricfield mapping effect above the main Es -layers. Figure 5
T. Yokoyama et al.: Simulation based on SEEK and SEEK-2
Electric Field 0 [sec] y = 30 [km]
2381
Electric Field 3600 [sec] z = 120 [km]
Plasma Density
140 0.00550272
0.00283652
130
South -- North [km]
Altitude [km]
150 120 110 100
[cm-3]
5x10³
100
2x10³ 103
50
90 80 0
4x10²
10
^ 20 30 40 South -- North [km]
50
Electric Field 0 [sec] z = 103 [km]
3 4 5106 60 10 10 10 -3 [cm ]
Plasma Density
45
2x10²
50
100 150 West -- East [km]
Fig. 5. Plasma density distribution (background) and the polarization electric field (arrows) on the horizontal plane at 120 km at 3600 s, after applying the gravity waves propagated from the lower atmosphere. (Reproduced from Yokoyama et al. (2004b).)
0.00546572
40 South -- North [km]
0 0
35 30 25 20 15 15
20
^ 25 30 35 West -- East [km]
40
3 4 5106 45 10 10 10 -3 [cm ]
Fig. 4. Electric field generated with the condition obtained in the SEEK-2 campaign. The plasma cloud is assumed as to be a rod-like structure, as used in Yokoyama et al. (2004a). Background grayscale contours represent plasma density in the sliced 2-D planes, and arrows represent the polarization electric fields.
shows the polarization electric fields generated in the Es layer mapped to the upper E-region and the produced plasma density structure aligned from northwest to southeast. The horizontal domain was 192 km×192 km with a grid spacing of 1 km. Such polarization electric fields are expected to give the vertical wave-like structure of the electric fields and the multi-peak of the plasma density observed in SEEK and SEEK-2. Figure 6 shows an example of a profile of the polarization electric field obtained from the simulation at t=3600 s of Yokoyama et al. (2004b) (Fig. 5). The polarization electric field, especially in the meridional component, shows sinusoidal modulation above 110 km. The polarization electric fields generated by gravity waves at the lower E-region map along the geomagnetic field, then the highaltitude variation is produced. Since the geomagnetic field is
Fig. 6. Profiles of each component of the electric field obtained from the simulation at t=3600 s of Yokoyama et al. (2004b).
assumed to be inclined 45◦ , the vertical wavelength can be interpreted as the horizontal one, corresponding to the horizontal structure of the plasma density shown in Fig. 5. This structure of the polarization electric field looks very similar to the observed electric fields. It is thus confirmed that the variation of electric fields should be due to the horizontal structure of gravity waves. Figure 7 shows a profile of the plasma density obtained from the simulation at the same position of Fig. 6. While the main Es -layer is formed by the zonal wind shear at 105 km, another peak is formed at 130 km by the polarization electric field. At altitudes of 95, 97, 100, 110, 114, 122 km, there are step-like structures in the profile. Considering the coarse vertical resolution of the simulation, they can be an indication of minor peaks of the
2382
T. Yokoyama et al.: Simulation based on SEEK and SEEK-2 Magnetic Field 0 [sec] y = 30 [km]
Plasma Density
140 4.46224e-09
Altitude [km]
130 120 110 100 90 80 0
Fig. 7. A profile of the plasma density obtained from the simulation at t=3600 s of Yokoyama et al. (2004b).
10
^ 20 30 40 South -- North [km]
50
3 4 5106 60 10 10 10 -3 [cm ]
Magnetic Field 0 [sec] z = 110 [km]
Plasma Density
40 1.48791e-09
South -- North [km]
35 30 25 20 15 10 15
20
^ 25 30 35 West -- East [km]
40
3 4 5106 45 10 10 10 -3 [cm ]
Fig. 9. Magnetic field produced by the current in the case of Fig. 4. Fig. 8. Magnetic field fluctuation observed with magnetic field measurement (MGF) on board the S-310-31 rocket. Black arrows indicate the interference from the calibration signals of other instruments on board the same rocket.
the current J from Amp`ere’s law as ∇ × B = µJ .
(5)
The magnetic vector potential A is defined as Es structures. In SEEK-2, several minor peaks of electron density were detected above the main Es -layer (Wakabayashi et al., 2005), which can be produced by polarization electric fields.
B = ∇ × A. Combining these two equations, ∇ × (∇ × A) = ∇(∇ · A) − ∇ 2 A = µJ .
3.4
Fluctuation of magnetic field
The magnetic field measurement (MGF) on board S-310-31 detected the fluctuations, as shown in Fig. 8. Major fluctuations of the magnetic field are found at 102 km in the upleg, and at 107 km in the downleg. Minor fluctuations of ±1∼2 nT distribute wide above the main Es -layer altitudes. Here we investigate whether such magnetic-field fluctuations are physically meaningful or not. From the simulation we calculate the current associated with the polarization electric field shown in Fig. 4. The magnetic field B is generated by
(6)
(7)
Assuming ∇·A=0, we obtain ∇ 2 A = −µJ ,
(8)
where A is obtained from J in the simulation by solving the Poisson Equation (8), then B is calculated from Eq. (6). Figure 9 shows the calculated magnetic field in the case of Fig. 4. In the meridional-vertical plane (top), the counterclockwise magnetic field due to the eastward Hall current is generated around the plasma cloud. The maximum amplitude of 4.5 nT is well comparable to the fluctuation detected in SEEK-2, as
T. Yokoyama et al.: Simulation based on SEEK and SEEK-2
2383
shown in Fig. 8. In the horizontal plane at 110 km (bottom), rotating magnetic field due to the field-aligned current is generated with a maximum of 1.5 nT. The magnetic-field fluctuations of several nanoteslas detected in SEEK-2 are physically meaningful, and strongly supports the proposed polarization mechanisms. The Hall current which flows within the Es layers is coupled with the upper E-region and even with the F -region via the field-aligned current.
larger in the small 6PF case, up to the upper E-region. From the ionosonde in Yamagawa, the critical frequencies of the F -layer were 5.1 MHz and 8.8 MHz during the electric field measurements of SEEK and SEEK-2, respectively. The difference in the measured electric fields in SEEK and SEEK-2 and the plasma density in the F -region are consistent with the numerical results of Yokoyama et al. (2004a). However, Yokoyama et al. (2004a) also showed that generation of the polarization electric field is strongly affected by the structure of the Es -layers itself. We need to take the horizontal structure of the Es -layers into consideration in a future study. The sub-peaks of the electron density detected with the rocket measurements should be related to the mapping of the polarization electric field. The electric field can easily produce a plasma density structure at an altitude of about 120 km, where the Pedersen mobility of ions is maximum (Yokoyama et al., 2003). Given that all of the sub-peaks above the main Es -layer are produced by the polarization electric field mapped from the Es -layer, the vertical structure of plasma density is regarded as the horizontal structure of the polarization electric field. It can be due to the horizontal structure, or spatial periodicity on the horizontal plane of the Es -layer which may be produced by shear instability or gravity waves (Bernhardt, 2002; Yokoyama et al., 2004b). Such spatial periodicity can be a source of the QP radar echoes, as well as wave structures of the electric field and sub-peaks of the electron density.
4
Discussion
The two rocket observations confirmed that Es -layers and strong wind shears actually existed at the lower E-region when QP echoes were observed from the ground with VHF radars. We also confirmed by simulation that the observed wind shear accumulates plasma at the shear node and that once Es -layers are formed at the lower E-region, they are not easily dissipated by the simple diffusive motion. However, only the constant zonal wind shear cannot produce sharp density gradient effectively because of frequent collisions with neutrals, then ionization and distribution of atomic metals with a long lifetime should be important for the formation of Es -layers. Direct vertical transport of plasma via collisions, for example, gravity waves or shear instability may also be important. When gravity waves propagate up to the E-region altitudes, the amplitude increases exponentially with decreasing of the atmospheric density, then the gravity waves should modulate the existing Es -layers. Shear instability may also modulate Es -layers directly in the lower Eregion (Larsen, 2000; Bernhardt, 2002). Although we do not have exact observational evidence whether shear instability can actually occur or not, the TMA trace released in SEEK-2 showed the billow-like structure which strongly supports occurrence of the instability (Larsen et al., 2005). Such vertical transport of plasma can produce altitude-modulated or inhomogeneous structures within Es -layers (Ogawa et al., 1998) and polarization electric fields which can modulate the upper E-region (Yokoyama et al., 2004b). Comparing between the electric field measured in SEEK and SEEK-2, the amplitude frequently exceeds 10 mV/m and sometimes reaches more than 20 mV/m in SEEK, which is more than twice that measured in SEEK-2 (Pfaff et al., 1998, 2005). Fluctuating electric fields with large amplitude are seen up to 130 km in SEEK while up to 108 km in the SEEK-2. Considering these small-scale electric fields as those mapped from the lower E-region, the mapping distance was shorter in SEEK-2 for small-scale fluctuation. It may be expected that solar activity variation, that is, variation of conductivity of the F -region makes the difference in the electric field profiles. Yokoyama et al. (2004a) suggested that field-line integrated Pedersen conductivity of the F -region (6PF ) strongly affects the generation of the polarization electric field at the E-region and mapping along the geomagnetic field. They showed from numerical simulations that a mapping distance is much shorter in the large 6PF case, and an amplitude of the polarization electric field can be
5
Conclusions
The observational results from SEEK and SEEK-2 campaigns have been quantitatively discussed with numerical simulations. Es -layers which are essential for gradient-drift instability are produced by zonal neutral wind shears. Inhomogeneous Es -layers can be a source of large polarization electric fields because of the difference between ion-neutral and electron-neutral collision frequencies. The generated polarization electric field maps along the geomagnetic field up to the F -region and can produce a field-aligned plasma density structure up to 120 km. The mechanism was also confirmed by the comparison between the rocket measurement of the magnetic field and our numerical simulation. The F -region conductivity can strongly affect the mapping efficiency and the amplitude of the polarization electric fields. The sub-peaks of electron density above the main Es -layer observed with the rockets can be due to the mapped polarization electric field. Shear instability or gravity waves are the possible sources of the wave structure of the electric field and the sub-peaks of electron density. The mechanism to produce strong neutral winds and shears in the lower thermosphere is still unknown, however. The neutral wind measurements suggests that the shear instability actually occurs in the E-region (Larsen et al., 1998, 2005). More comprehensive studies that include the neutral atmosphere, the Eregion, and the F -region, are required in future.
2384
T. Yokoyama et al.: Simulation based on SEEK and SEEK-2
Acknowledgements. Computation in the present study was performed with the KDK system of Research Institute for Sustainable Humanosphere (RISH) at Kyoto University as a collaborative research project. This work is supported by The Ministry of Education, Culture, Sports, Science and Technology of Japan under Grantin-Aid for JSPS Fellows 14001700. Topical editor M. Pinnock thanks T. Maruyama and another referee for their help in evaluating this paper.
Larsen, M. F., Yamamoto, M., Fukao, S., and Tsunoda, R. T.: SEEK 2: Observations of neutral winds, wind shears, and wave structure during a sporadic E/QP event, Ann. Geophys., 23, 2369– 2375, 2005. Maruyama, T., Fukao, S., and Yamamoto, M.: A possible mechanism for echo-striation generation of radar backscatter from midlatitude sporadic E, Radio Sci., 35, 1155–1164, 2000. Ogawa, T., Sekito, N., Nozaki, K., and Yamamoto, M.: Height comparison of mid-latitude E-region field-aligned irregularities and sporadic E-layer, Geophys. Res. Lett., 25, 1813–1816, 1998. Ogawa, T., Takahashi, O., Otsuka, Y., Nozaki, K., Yamamoto, M., and Kita, K.: Simultaneous middle and upper atmosphere radar and ionospheric sounder observations of mid-latitude E-region irregularities and sporadic E-layer, J. Geophys. Res., 107(A10), 1275, doi:10.1029/2001JA900176, 2002. Pfaff, R., Yamamoto, M., Marionni, P., Mori, H., and Fukao, S.: Electric field measurements above and within a sporadic-E layer, Geophys. Res. Lett., 25, 1769–1772, 1998. Pfaff, R., Freudenreich, H., Yokoyama, T., Yamamoto, M., Fukao, S., and Mori, H.: Electric field measurements of DC and long wavelength structures associated with sporadic-E layers and QP radar echoes Ann. Geophys., 23, 2319–2334, 2005. Tsunoda, R. T.: On polarized frontal structures, type-1 and quasiperiodic echoes in mid-latitude sporadic E, Geophys. Res. Lett., 25, 2641–2644, 1998. Tsunoda, R. T., Fukao, S., and Yamamoto, M.: On the origin of quasi-periodic radar backscatter from mid-latitude sporadic-E, Radio Sci., 29, 349–365, 1994. Wakabayashi, M., Ono, T., Mori, T., and Bernhardt, P. A.: Electron density and plasma waves measurement in mid-latitude sporadicE layer observed during the SEEK-2 campaign, Ann. Geophys., 23, 2335–2345, 2005. Woodman, R. F., Yamamoto, M., and Fukao, S.: Gravity wave modulation of gradient drift instabilities in mid-latitude sporadic E irregularities, Geophys. Res. Lett., 18, 1197–1200, 1991. Yamamoto, M., Fukao, S., Woodman, R. F., Ogawa, T., Tsuda, T., and Kato, S.: Mid-latitude E-region field-aligned irregularities observed with the MU radar, J. Geophys. Res., 96, 15 943– 15 949, 1991. Yamamoto, M.-Y., Ono, T., Oya, T., Tsunoda, R. T., and Larsen, M. F.: S. Fukao, and M. Yamamoto, Structures in sporadicE observed with an impedance probe during the SEEK campaign: Comparisons with neutral-wind and radar-echo observations, Geophys. Res. Lett., 25, 1781–1784, 1998. Yamamoto, M., Fukao, S., Tsunoda, R. T., Pfaff, R., and Hayakawa, H.: SEEK-2 (Sporadic Experiment over Kyushu 2) – Project outline and significance, Ann. Geophys., 23, 2295–2305, 2005. Yokoyama, T., Yamamoto, M., and Fukao, S.: Computer simulation of polarization electric fields as a source of mid-latitude field-aligned irregularities, J. Geophys. Res., 108(A2), 1054, doi:10.1029/2002JA009513, 2003. Yokoyama, T., Yamamoto, M., Fukao, S., and Cosgrove, R. B.: Three-dimensional simulation on generation of polarization electric field in the mid-latitude E-region ionosphere, J. Geophys. Res., 109(A01309), doi:10.1029/2003JA010238, 2004a. Yokoyama, T., Horinouchi, T., Yamamoto, M., and Fukao, S.: Modulation of the mid-latitude ionospheric E-region by atmospheric gravity waves through polarization electric field J. Geophys. Res., 109(A12307), doi:10.1029/2004JA010508, 2004b.
References Bernhardt, P. A.: The modulation of sporadic-E layers by KelvinHelmholtz billows in the neutral atmosphere, J. Atmos. SolarTerr. Phys., 64, 1487–1504, 2002. Bilitza, D., Rawer, K., Bossy, L., and Gulyaeva, T.: International reference ionosphere in: Past, present, and future, Adv. Space Res., 13, 3, 3–23, 1993. Cosgrove, R. B. and Tsunoda, R. T.: Simulation of the nonlinear evolution of the sporadic-E-layer instability in the nighttime mid-latitude ionosphere, J. Geophys. Res., 108(A7), 1283, doi:10.1029/2002JA009728, 2003. Cosgrove, R. B. and Tsunoda, R. T.: Instability of the E−F coupled nighttime mid-latitude ionosphere, J. Geophys. Res., 109(A04305), doi:10.1029/2003JA010243, 2004. Cosgrove, R. B., Tsunoda, R. T., Fukao, S., and Yamamoto, M.: Coupling of the Perkins instability and the sporadic E-layer instability derived from physical arguments, J. Geophys. Res., 109(A06301), doi:10.1029/2003JA010295, 2004. Ecklund, W. L., Carter, D. A., and Balsley, B. B.: Gradient drift irregularities in mid-latitude sporadic E, J. Geophys. Res., 86, 858–862, 1981. Fukao, S., Yamamoto, M., Tsunoda, R. T., Hayakawa, H., and Mukai, T.: The SEEK (Sporadic-E Experiment over Kyushu) campaign, Geophys. Res. Lett., 25, 1761–1764, 1998. Haldoupis, C., Schlegel, K., and Farley, D. T.: An explanation for type 1 radar echoes from the mid-latitude E-region ionosphere, Geophys. Res. Lett., 23, 97–100, 1996. Hedin, A. E.: Extension of the MSIS thermosphere model into the middle and lower atmosphere, J. Geophys. Res., 96, 1159–1172, 1991. Hysell, D. L., Yamamoto, M., and Fukao, S.: Simulations of plasma clouds in the mid-latitude E-region ionosphere with implications for type I and type II quasiperiodic echoes, J. Geophys. Res., 107(A10), 1313, doi:10.1029/ 2002JA009291, 2002. Kagan, L. M.: Effects of neutral gas motions on mid-latitude E region irregular structure, J. Atmos. Solar-Terr. Phys., 64, 1479– 1486, 2002. Kagan, L. M. and Kelley, M. C.: A wind-driven gradient drift mechanism for mid-latitude E-region ionospheric irregularities, Geophys. Res. Lett., 25, 4141–4144, 1998. Kagan, L. M. and Kelley, M. C.: A thermal mechanism for generation of type-2 small-scale irregularities in the ionospheric Eregion, J. Geophys. Res., 105, 5291–5303, 2000. Larsen, M. F.: A shear instability seeding mechanism for quasiperiodic radar echoes, J. Geophys. Res., 105, 24 931–24 940, 2000. Larsen, M. F., Fukao, S., Yamamoto, M., Tsunoda, R. T., Igarashi, K., and Ono, T.: The SEEK chemical release experiment: Observed neutral wind profile in a region of sporadic-E, Geophys. Res. Lett., 25, 1789–1792, 1998.