International Conference on Recent Advances in Nonlinear Models – Structural Concrete Applications CoRAN 2011 H. Barros, R. Faria, C. Pina and C. Ferreira (Eds)
NUMERICAL STUDY OF THE FLEXURAL BEHAVIOUR OF PRECAST PRESTRESSED HIGH STRENGTH CONCRETE BEAMS S. M. O. Gomes1,4, P. A. L. Fernandes2,4, D. Dias-da-Costa1,5 and E. N. B. S. Júlio3,4 1
Department of Civil Engineering, University of Coimbra, Rua Luís Reis Santos, Coimbra, 3030-788, Portugal e-mail:
[email protected];
[email protected] 2
Department of Civil Engineering Polytechnic Institute of Leiria Campus 2 – Morro do Lena – Alto do Vieiro, 2411-901 Leiria, Portugal e-mail:
[email protected] 3
Department of Civil Engineering and Architecture, Instituto Superior Técnico, Technical University of Lisbon, Av. Rovisco Pais 1, 1049-001 Lisboa, Portugal e-mail:
[email protected] 4
5
ICIST, Av. Rovisto Pais, 1049-001 Lisboa, Portugal
INESC Coimbra, Rua Antero de Quental 199, 3000-033 Coimbra, Portugal
Key words: Beam, High Strength Concrete, Finite Element Analysis, Flexural. Summary: This manuscript presents a finite element model developed to study the flexural behaviour of precast prestressed HSC beams using the commercial software ‘Abaqus’. The material behaviour was simulated with: i) a plastic damage model for concrete; and ii) an elastic-plastic model for reinforcement with perfect bonding. The numerical model was validated by means of experimental results, being observed a good agreement. 1 INTRODUCTION The use of Precast High Strength Concrete (HSC) has experienced an overwhelming increase in a different variety of fields. However, regarding the Portuguese context, most existing options still use concrete of a relatively reduced compressive strength (e.g. C40/50), leading to less efficient cross sections and slenderness ratios. Consequently, it was developed an experimental study aiming to assess the viability of producing prestressed HSC beams in Portugal1. The new solutions of HSC beams have several advantages such as a significant reduction of weight and cross section dimensions, for the same span, and an increased durability1-4. These elements also present high compressive strength at early age, allowing the precast industry to increase the productivity1. A numerical study of the flexural behaviour of precast prestressed HSC beams is herein presented. The three-dimensional numerical model was validated by means of experimental
237
S. Gomes, P. Fernandes, D. Dias-da-Costa and E. Júlio
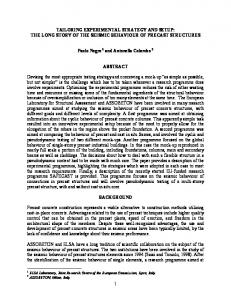
results. 2 EXPERIMENTAL TESTS Two half-scale models of precast prestressed HSC beams, with 20 m span, were subject to flexural tests as shown in Figure 11.
(a)
(b) 1
Figure 1: Experimental tests : (a) set-up; and (b) failure.
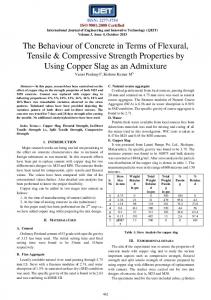
The cross section is ‘I’- shaped (see Figure 2). The passive longitudinal reinforcement is composed of 21ࢥ5, whereas the transversal reinforcement is ࢥ5//0.150 m. The active reinforcement is composed by 12 3/8" prestressed bounded strands at the bottom. There are also 2 3/8" unbounded post-tension strands at the top to ensure decompression after realising the prestress. The pre and post-tension of, respectively, 1430 MPa and 1160 MPa, were applied at 5 days of age. The flexural tests of both beams were performed at 106 and 131 days of age1.
Figure 2: Cross section1.
2 238
S. Gomes, P. Fernandes, D. Dias-da-Costa and E. Júlio
3 NUMERICAL ANALYSIS 3.1 Material properties The numerical analysis was performed using Abaqus/Standard. A plastic damage model was adopted for concrete, which is capable of simulating tensile cracking and compressive crushing5. The compressive behaviour was considered to be linear elastic until reaching the compressive strength of the material. This procedure is justified by the stress-strain curve experimentally obtained for the HSC, which is almost linear up to failure1,4. The compressive strength and the Young's modulus were obtained in the experimental work, being respectively 124 MPa and 58 GPa at 28 days of age1. The tensile strength was computed according to Eurocode 26, being 5.5 MPa. The fracture energy was determined according to Model Code 907 and is 163 N/m. According to the authors’ experience, these codes allow having a first estimate for the material properties that could not be experimentally obtained, requiring only the compressive strength. The steel reinforcement was assumed to be linear elastic-perfectly plastic. The Young’s modulus and yield stress were experimentally measured1 and the corresponding values are i) 192 GPa and 604 MPa for the passive reinforcement; and ii) 200 GPa and 1915 MPa1 for the active reinforcement. 3.2 Numerical model The three-dimensional model was implemented using finite elements with: i) 8 nodes and reduced integration to simulate the concrete; and ii) 2 nodes to simulate the reinforcement. A perfect bond between concrete and steel was also assumed. A viscosity parameter of 10-9 was used aiming to improve convergence without compromising results. The boundary, load conditions and adopted mesh are illustrated in Figure 3.
(a)
(b) Figure 3: Schematic representation of the model: (a) boundary and load conditions assuming symmetry; and (b) adopted mesh.
3 239
S. Gomes, P. Fernandes, D. Dias-da-Costa and E. Júlio
4 RESULTS The numerical and experimental load vs. vertical displacement curves are shown in Figure 4, whereas load vs. strain curves are shown in Figure 5, both at the mid-span. Convergence difficulties occurring during steel yielding and concrete cracking prevented the model to provide results above 120 kN. After this point, and due to the observed linear behaviour, the failure load was analytically extrapolated by assuming the failure of the strands, leading to 132 kN. These results are shown in Figure 4 using red dashed line, and are similar to experimental results. It is highlighted that this is a reference for what should be numerically obtained if the model could converge. In spite of these numerical difficulties, the numerical model agrees well up to 120 kN. 160 140
Load (kN)
120 100 80 60 40
Experimental 1 Experimental 2 Numerical
20
950
900
850
800
750
700
650
600
550
500
450
400
350
300
250
200
150
100
50
0
0
Vertical displacement at mid-span (mm) Figure 4: Load vs. displacement curves at mid-span. 160 140
Load (kN)
120 100 80 60
upper reinforcement middle reinforcement bottom reinforcement Numerical Experimental
40 20 0 -2,0
0,0
2,0
4,0
H [‰]
6,0
8,0
10,0
Figure 5: Load vs. strain curves for longitudinal reinforcement at mid-span.
4 240
12,0
S. Gomes, P. Fernandes, D. Dias-da-Costa and E. Júlio
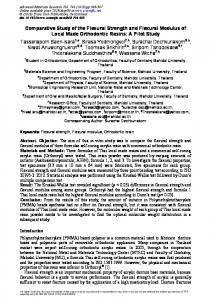
The numerical crack pattern is represented in Figure 6 where it has been assumed that a crack is initiated when the maximum plastic strain is positive. It can be observed that cracking first appears at the bottom-surface at 75 kN and propagates in the web at 90 kN. It is highlighted that the experimentally observed crack propagation begun at the bottom-surface around 60~70 kN, then propagating in the web at 99 kN1. When propagation occurs, the cracks have a longitudinal spacing around 150 mm. This value is similar to what was experimentally observed (see Figure 7).
(a) lateral bottom (b) lateral bottom (c) lateral bottom (d) lateral bottom (e) Figure 6: Numerical crack pattern at the lateral-surface and bottom-surface of the beam: (a) monitored area; (b) 75 kN; (c) 90 kN; (d) 105 kN; and (e) 120 kN.
(b)
(a) 1
Figure 7: Experimental crack pattern : (a) at the bottom-surface of the beam (60~70 kN), and (b) at the lateralsurface (99 kN).
5 241
S. Gomes, P. Fernandes, D. Dias-da-Costa and E. Júlio
5 CONCLUSIONS From the numerical model developed to simulate the flexural behaviour of prestressed precast HSC beams, can be already drawn that the obtained results are promising since a good agreement is observed until the point where convergence was possible.
Several improvements are expected to be implemented in the near future to overcome the convergence difficulties. The solution may require adopting a quasi-static analysis using Abaqus/Explicit. The three-dimensional model will then be applied to simulate the shear tests that have been performed with the two halves of the beams resulting from the flexural tests. The numerical model require four stages of analysis: i) simulation of the flexural test up to failure; ii) unloading stage before performing the shear tests; iii) applying the new boundary conditions; and iv) the simulation of the shear tests up to failure. 6 ACKNOWLEDGMENTS The authors acknowledge the financial support of the Portuguese Science and Technology Foundation (FCT), project number PTDC/ECM/098497/2008, entitled INTELLIGENT SUPER SKIN - Enhanced Durability for Concrete Members. REFERENCES [1] P.A.F. Fernandes, Long Span High Strength Concrete Beams - Viability, Design, Production and Behavior, Ph. D. thesis, University of Coimbra, Coimbra (2005) [in Portuguese]. [2] M. Caldarone, High-Strength Concrete - A practical guide, Taylor & Francis (2009). [3] N.M. Hawkins, D.A. Kuchma, Application of LRFD Bridge Design Specifications to High-Strength Structural Concrete: Shear Provisions, Washington, D. C., University of Illinois (2007). [4] P.A. Mendis, "Design of high strength concrete members : state-of-the-art", Prog. Struct. Eng. Mat., 5, 1-15 (2003). [5] Hibbitt, Karlsson, Sorensen, Abaqus Analysis User's Manual (2010). [6] CEN, EN 1992-1-1: Eurocode 2: design of concrete structures – Part 1-1: General rules and rules for buildings, European Committee for Standardization (CEN) (2004). [7] CEB/FIP, Model Code 90-Design Manual, Comité Euro-International du Béton, Thomas Telford (1991).
6 242