Mar 12, 2014 - Functional Mock-up Interface (FMI) is a standard to combine dynamic .... cond: 1 cond: 4. Figure 1: A piece of a running Grafchart application.
On Extending JGrafchart with Support for FMI for Co-Simulation Alfred Theorin Charlotta Johnsson Department of Automatic Control, Lund University, Lund, Sweden
Abstract Grafchart is a graphical programming language which extends Sequential Function Charts (SFC), the PLC standard languages for sequential, parallel, and general state-transition oriented automation applications. SFC is widely used and accepted for industrial automation. Grafchart adds higher level features to SFC such as hierarchical structuring, reusable procedures, and exception handling to make it convenient to implement and maintain large applications. Functional Mock-up Interface (FMI) is a standard to combine dynamic system models for technical system developed in various tools. Tools can export models as Functional Mock-up Units (FMUs) which can be combined with other FMUs to compose the whole system. In this paper adding FMI for Co-Simulation support to JGrafchart, a free implementation of the Grafchart language, is conceptually evaluated. It is discussed how JGrafchart fits into the FMI for CoSimulation framework and potential ways to implement this are discussed. Keywords: Grafchart; FMI; Co-Simulation; FMI for Co-Simulation; Modelica
overviewable and maintainable [2]. Functional Mock-up Interface (FMI) is a recent standard [3] which aims at combining dynamic system models developed in various tools. Modelica [4], the state of the art language to express dynamic behavior of technical systems, promotes this standard and the number of tools supporting FMI is growing rapidly. A tool can export a model as a Functional Mock-up Unit (FMU) which can then be combined with other FMUs to compose the whole system. The FMI standard consists of two parts, namely FMI for Model Exchange and FMI for Co-Simulation. The difference is that for FMI for Co-Simulation a FMU also includes an individual solver to simulate its behavior. In this paper adding FMI for Co-Simulation support to JGrafchart, a free implementation of the Grafchart language, is conceptually evaluated. In Section 2 FMI for Co-Simulation is described, in Section 3 the Grafchart and JGrafchart basics are covered, and Section 4 motivates the need to connect JGrafchart to FMI for Co-Simulation and discusses possible ways to implement this. Finally, future work is discussed in Section 5.
1
2
Introduction
Grafchart is a graphical programming language which extends Sequential Function Charts (SFC), one of the IEC 61131-3 [1] PLC standard languages for sequential, parallel, and general state-transition oriented applications. SFC is supported by most large industrial automation systems, for example 800xA by ABB, SIMANTIC S7 by Siemens, RSLogix 5000 by Rockwell Automation, DeltaV by Emerson, and CENTUM CS by Yokogawa. SFC is widely used and accepted for industrial automation, but is a low level programming language and thus implementing larger applications in SFC is inconvenient. Grafchart adds high level features such as hierarchical structuring, reusable procedures, and exception handling which makes it convenient to implement large applications that are DOI 10.3384/ECP140961257
FMI for Co-Simulation
FMI for Co-Simulation is a standard which enables simulation of coupled technical systems with focus on time-dependent problems. It is designed for both standalone FMUs and FMUs which are FMI wrappers for simulation tools. A co-simulation is executed from a given starting time to a stop time which is not necessarily prespecified. There is an FMI master which coordinates the co-simulation and there are FMU slaves, each corresponding to one model or subsystem. Each slave has a pre-specified set of inputs and outputs which are known by the master. The master is responsible for initialization of the slaves and for handling the coupling between them by getting and setting their inputs and outputs.
Proceedings of the 10th International ModelicaConference March 10-12, 2014, Lund, Sweden
1257
Extending JGrafchart with Support for FMI for Co-Simulation
The co-simulation is executed for one time interval at a time, known as a communication step, during which each slave executes independently. Between the communication steps are the communication points where the master communicates the inputs and outputs between the slaves. Slaves can specify their desired communication step size and the communication step size may also vary during the co-simulation provided that all slaves support this. A communication step may also fail. Then a new communication step of different size may be attempted if all slaves support redoing communication steps. It is the master which decides the communication steps and what to do when one fails. The standard does not define an FMI master algorithm, and the level of sophistication is decided by the one who implements the master. What the standard does define is the API, a set of slave capabilities, and rules for how these may be used. An FMU is described by an XML metadata file which primarily contains the inputs and outputs and co-simulation capabilities such as support for redoing communication steps and support for variable communication step size.
3
Grafchart
S var = 7;
cond == 4 S var = 12;
S var = 7;
cond == 4 S var = 12;
var: 7
var: 12
cond: 1
cond: 4
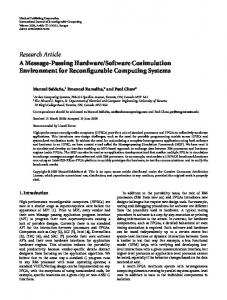
Figure 1: A piece of a running Grafchart application. The left part shows one application state and the right part shows a later application state. is inactive. t is how many scan cycles the step has been active since the previous activation if the step is active. For inactive steps t is 0. s works the same as t but counts seconds instead of scan cycles. Grafchart supports basic SFC functionality such as alternative and parallel paths, see Figure 2. At any time only one alternative path may contain active steps. On the other hand, parallel paths are executed in parallel and will contain active steps at the same time. To create alternative paths a step is connected to several transitions. To create parallel paths a Parallel Split is added to split the execution. A Parallel Join is used to merge the execution again when the parallel paths are completed.
Grafchart has the same graphical syntax as SFC with steps and transitions, where steps represent the possible application states and transitions represent the change of application state. Associated with the steps are actions which specify what to do. Associated with Alternative paths each transition is a Boolean guard condition. It is a state machine related language which has been develParallel paths b !b oped particularly with automation in mind and with focus on scalability. Parallel Split A part of a running Grafchart application is shown in Figure 1. Here two steps are connected by a transition and there are two variables, namely var and cond. c d In the left part of the figure, the upper step has just been activated which involved executing its S action, thus setting var to 7. An active step is indicated by Parallel Join a black dot, known as a token. The upper step will remain active until the guard condition of the transie f tion becomes true, that is, until cond gets the value 4. When the guard condition becomes true, shown in the right part of the figure, the upper step is deactivated g and the lower step is activated which means that var is set to 12. Steps also have additional properties, namely x, t, Figure 2: A Grafchart application showing how to exand s. x is true if the step is active and false if the step press alternative and parallel paths. 1258
Proceedings of the 10th International ModelicaConference March 10-12, 2014, Lund, Sweden
DOI 10.3384/ECP140961257
Poster Session
In Figure 1 only the S action type is used. S actions are executed on step activatation. SFC also supports several other action types (action qualifiers) which have other semantics. Grafchart supports fewer action types. However, these are more general and can, among other things, be used to implement the semantics of all action types of SFC. The main action types in Grafchart are S (executed on step activation), P (executed periodically while step is active), X (executed on step deactivation), and N (sets a boolean variable to true (false) on step activation (deactivation)). Additional constructs such as hierarchical structuring, reusable procedures, and exception handling have been added in Grafchart which makes it convenient to implement large applications that are overviewable and maintainable [2]. With reusable components, code duplication is avoided. Reusable code can be put in a Grafchart Procedure which can then be called from any number of Procedure Steps and Process Steps, see Figure 3. The difference between Procedure Steps and Process Steps is that Procedure Steps wait for the call to complete before the application can proceed while Process Steps do not.
its condition is true. Firing a transition involves deactivating the immediately preceding steps and activating the immediately succeeding steps. Grafchart applications are, like SFC, executed periodically, one scan cycle at a time. The execution model of a scan cycle is described by the following sequence: 1. Read inputs. 2. Mark fireable transitions. 3. Remove mark for conflicting transitions of lower priority. 4. Fire marked transitions. 5. Update step properties t and s. 6. Execute P actions. 7. Mark variables subject to N actions. 8. Update marked variables. 9. Sleep until the start of the next scan cycle. The execution model has the property that an activated step always remains active for at least one scan cycle. Note that the execution model does not give a completely deterministic execution. For example the firing order of transitions affects which step’s S and X actions are executed first. Another example is which step’s P actions are executed first. The application is not allowed to depend on the execution order in these cases.
ProcedureStep
3.2
b
ProcessStep Procedure
c
JGrafchart
JGrafchart is a free Java based integrated development environment for the Grafchart programming language which can be downloaded from http://www.control. lth.se/Research/tools/grafchart.html. It is a research tool used in for example the EU/GROWTH project CHEM for control in process industry [5], the EU FP7 project ROSETTA for robotic assembly [6], and a master’s thesis for modeling of avionics systems [7].
Figure 3: A Procedure can be called from Procedure 3.2.1 Inputs and Outputs Steps and Process Steps. Each Procedure Step and Process Step specify which Procedure to call when ac- JGrafchart can be connected to external environments through a multitude of customizable input/output (I/O) tivated. integration capabilities and can thus be used to control external real and simulated processes. This is used in education, for example in laboratory exercises on se3.1 Execution Model quential and batch control, and to control real indusGrafchart has a well defined execution model which trial processes. One I/O possibility in JGrafchart is the CustomIO, ensures sufficiently deterministic execution behavior. A transition is enabled when all immediately preced- that is, the I/O elements Digital In, Digital Out, Anaing steps are active. An enabled transition is fireable if log In, and Analog Out as well as inverted variants DOI 10.3384/ECP140961257
Proceedings of the 10th International ModelicaConference March 10-12, 2014, Lund, Sweden
1259
Extending JGrafchart with Support for FMI for Co-Simulation
for the Digital In/Out. At the beginning of each scan cycle each In I/O is read from the external environment. An Out I/O is written to the external environment whenever assigned. How the I/O interact with the external environment depends on the chosen I/O implementation. A custom I/O implementation is created by implementing a set of Java interfaces. With a custom implementation it is possible to communicate with practically any external environment. However, it is limited to Boolean and Real values. There is also generic support for communicating with Devices Profile for Web Services (DPWS) devices using the DPWS4J toolkit [8]. Devices and their supported operations are automatically discovered and can be called directly. Another I/O possibility is the SocketIO elements. JGrafchart then connects to a TCP server and communicates Boolean, Real, Integer, and String values over a socket with the message protocol: ’|’ ’\n’. The TCP server is responsible for the interaction with the external environment. SocketIO is often powerful enough to allow creation of external adapters to other communication protocols. It has for example been used to integrate JGrafchart with a multitude of tools and protocols, among others prototypes for Simulink [7], DPWS [9], LabComm, and OPC UA support. It would be useful to also support code generation to be able to export JGrafchart applications as FMUs. Code generation has previously been added to JGrafchart [10, 11] but, due to the current JGrafchart code base design, the results have been limited and fragile. Currently JGrafchart only supports interpreted execution. To execute an application it must first be compiled. The compiler checks if the application is valid and prepares it for execution by attaching additional data. Applications are then executed directly in an interpreted manner using the same Java instances as the editor. JGrafchart is currently being split into three standalone parts, namely editor, compiler, and executor. This makes it possible to add robust code generation capabilities.
fied model in Java. It is also possible to implement simulations of simple processes directly in JGrafchart [12]. However, there is much potential for improvement in terms of effort for specifying the simulated model, quality of the models, support for inspecting simulation results, and time required to simulate, especially for more complicated physical systems. Extending JGrafchart with support for FMI for Co-Simulation gives more and better opportunities to connect JGrafchart to other tools. There is also a need to efficiently develop and test JGrafchart control applications before using them to control the real system. This may save a lot of time as many industrial systems have slow dynamics and running a simple test on the real system could take days. With a good model of the system the development time could be considerably reduced, and the quality of the control application will be higher as there is less resistance in the development process. Industrial systems are often dangerous and running a proper simulation first could be essential for safety reasons. For the batch tank in our laboratory exercise, the simulated process is 10 times as fast as the real process. Special code is required to add support for this which both makes it fragile and susceptible to errors as it is possible to run the control application in the wrong mode, for example in simulation mode against the real system. With a simulation environment that does not run according to wall clock time, it can be run faster and without the special code. It is also important to verify that the system behaves properly when controlled by a JGrafchart application. JGrafchart executes periodically and only sees the sampled behavior. When controlling a continuous system, the behavior between the sampling points may also be of interest. Also, currently JGrafchart applications are always executed according to wall clock time. With a large or complex simulated system the JGrafchart application might execute faster than the rest of the system can be simulated.
Support for state machines were introduced in Modelica 3.3 [13] providing a proper way to implement hierarchical state machines directly in Modelica. On one hand, JGrafchart does not provide the mutual hier4 JGrafchart with FMI Support archical structuring propery with data flow that Modelica state machines do [13], but on the other hand it 4.1 Motivation supports powerful high level language features such as In one of our laboratory exercises, JGrafchart is used object orientation, hierarchical structuring, code reuse, to control both a simulated and a real batch tank. and exception handling. Additionally it is based on an The simulated process is implemented as a simpli- industrial automation language. 1260
Proceedings of the 10th International ModelicaConference March 10-12, 2014, Lund, Sweden
DOI 10.3384/ECP140961257
Poster Session
4.2
Integration
JGrafchart supports the data types Real, Integer, Boolean, and String which correspond to the FMI data types fmiReal, fmiBoolean, fmiInteger, and fmiString. Both variables, lists (arrays), and I/O in JGrafchart use only these data types. The state of a JGrafchart application is described by the variable, list, and I/O values as well as which steps are active, how long they have been active, and currently active procedure calls. The number of simultaneous procedure calls and the list sizes are not limited and there are no semantics to limit this. However, there are no list I/O and procedures are not allowed to contain I/O so this is not an issue for FMI for Co-Simulation. As the I/O in the JGrafchart application are the means of connecting it to external components, these would ideally be the FMU inputs and outputs. The mapping for CustomIO and SocketIO is straightforward. DPWS on the other hand is based on method calls instead of data and need some configuration to be able to expose the methods as data instead. Thus it is best to exclude DPWS, at least during prototyping. JGrafchart applications are executed periodically, one scan cycle at a time, as described in Section 3.1. The execution can be modeled as discrete events at the beginning of each scan cycle. During the rest of the scan cycle nothing happens. Ideally, there would be communication points just before and just after the beginning of each scan cycle. With a sufficiently small communication step size this should work fine for all JGrafchart applications, regardless of scan cycle time. This could be requested by setting the stepSize attribute of the DefaultExperiment element in the FMU XML. JGrafchart applications are currently always executed according to wall clock time and it is not possible to get and set the execution state as there has been no need for this before. However, it should be possible to extend JGrafchart with the possibility to get and set the current execution state to support redoing communication steps.
4.3
Architecture
This section discusses various ways to connect a JGrafchart application to an FMI master.
JGrafchart application executes as usual, with the FMI master getting and setting its I/O. As discussed before, the co-simulation must then be able to keep up with and synchronize with JGrafchart’s wall clock time execution. The main advantage with this approach is that no modifications to JGrafchart are necessary, it would be sufficient to create an FMU compatible CustomIO or TCP server for SocketIO. This is a suitable approach for FMU integration prototyping but it does not improve matters for systems with slow dynamics. FMI
CustomIO SocketIO Hardware-in-the-loop
Figure 4: Overview of connecting JGrafchart as a hardware-in-the-loop.
4.3.2
Generic FMI Wrapper
Another approach is to implement a generic FMI wrapper for JGrafchart and extend JGrafchart with support for external clocks, see Figure 5. It is a small effort to add this feature. The same FMI wrapper would be possible to use with all JGrafchart application but the wrapper would expose different inputs and outputs to the FMI master depending on the JGrafchart application. This approach only requires slightly more effort than the hardware-in-the-loop approach and gives more benefits as the co-simulation no longer executes according to wall clock time. For this approach it is suitable to also add support for playback and to be able to inspect individual scan cycles of the JGrafchart application during the co-simulation. To add these features should only be a moderate effort, it could be as simple as trace printouts or as advanced as interactive scan cycle stepping. Compared to the hardware-in-the-loop case, the main drawback is that modifications to JGrafchart are required. However, these additions are great additions in general and are not solely useful for FMI for Co-Simulation. For example they open up possibilities for integration with other tools and improves JGrafchart’s debugging capabilities. FMI
CustomIO SocketIO
4.3.1 Hardware-in-the-loop
Figure 5: Overview of connecting JGrafchart with a The simplest way is to consider the JGrafchart applica- generic FMI wrapper. tion as a hardware-in-the-loop, see Figure 4. Then the DOI 10.3384/ECP140961257
Proceedings of the 10th International ModelicaConference March 10-12, 2014, Lund, Sweden
1261
Extending JGrafchart with Support for FMI for Co-Simulation
4.3.3 Standalone FMU The last approach discussed in this paper is to generate a standalone FMU for a JGrafchart application, see Figure 6. The FMU is then self-contained and does not rely on JGrafchart running in parallel. This is a clean and portable approach but requires the most effort and might make it harder to inspect the co-simulation results. Until the JGrafchart compiler is standalone, the implementation would also be fragile. FMI
CodeGen
ing and there are several alternative ways that it could be implemented. The next step is to implement a prototype to verify that it works in practice. A suitable first attempt would be a hardware-in-the-loop approach using an unmodified version of JGrafchart and utilizing its CustomIO and/or SocketIO capabilities. However, this does not improve matters for slow systems. A desirable future solution would either be the Generic FMI Wrapper or the Standalone FMU.
Acknowledgements
The authors are members of the LCCC Linnaeus CenFigure 6: Overview of using code generation to create ter and the eLLIIT Excellence Center at Lund University. a standalone JGrafchart FMU. A hybrid approach is to use a generic FMI wrapper with both JGrafchart and the JGrafchart application embedded as additional FMU resources, see Figure 7. Then the FMU is standalone but no code generation is required. The main drawback with this approach is that the FMUs would be roughly 20 MB larger.
References [1]
IEC. IEC 61131-3: Programmable controllers – Part 3: Programming Languages. Tech. rep. International Electrotechnical Commission, 1993.
[2]
Alfred Theorin. Adapting Grafchart for Industrial Automation. Licentiate Thesis ISRN LUTFD2/TFRT--3260- -SE. Department of Automatic Control, Lund University, Sweden, 2013-05.
Figure 7: Overview of exporting a standalone FMU with integrated JGrafchart and JGrafchart application.
[3]
FMI Development Group. Functional Mockup Interface for Model Exchange and CoSimulation – 2.0 Release Candidate 1. Tech. rep. Modelica Association, 2013-10.
4.4
[4]
Modelica Association. Modelica. URL: https:// www.modelica.org/ (visited on 2013-12-08).
[5]
Karl-Erik Årzén, Rasmus Olsson, and Johan Åkesson. “Grafchart for Procedural Operator Support Tasks”. In: Proceedings of the 15th IFAC World Congress, Barcelona, Spain. 2002-07.
[6]
Andreas Stolt. Robotic Assembly and Contact Force Control. Licentiate Thesis ISRN LUTFD2/TFRT- -3256--SE. Department of Automatic Control, Lund University, Sweden, 2012-12.
[7]
Anna Benktson and Sofia Dahlberg. Modeling of Avionics Systems using JGrafchart and TrueTime. Master’s Thesis ISRN LUTFD2/TFRT- 5907--SE. Department of Automatic Control, Lund University, Sweden, 2012.
FMI
Export
Implementation
The FMI API is defined for C and FMUs are distributed with C source code and/or binary executables for supported platforms. JGrafchart is written in Java and is platform independent. However, the FMU itself can be implemented in any language which is able to interact with C code, that is, practically any language. There are language specific wrappers for FMI, for example PyFMI for Python [14] and JFMI for Java [15] which uses JNA [16] to interface with native code. Which language is chosen is less important and up to the one who implements the FMU. However, the CustomIO implementation must be written in Java.
5
Future Work
Extending JGrafchart to support FMI for CoSimulation is only conceptual so far. It looks promis1262
Proceedings of the 10th International ModelicaConference March 10-12, 2014, Lund, Sweden
DOI 10.3384/ECP140961257
Poster Session
[8]
SOA4D Forge. DPWS4J Core. URL: https : / / forge . soa4d . org / projects / dpws4j/ (visited on 2013-12-07).
[9]
Alfred Theorin, Lisa Ollinger, and Charlotta Johnsson. “Service-oriented Process Control with Grafchart and the Devices Profile for Web Services”. In: Service Orientation in Holonic and Multi Agent Manufacturing and Robotics. Ed. by Theodor Borangiu, Andre Thomas, and Damien Trentesaux. Vol. 472. Studies in Computational Intelligence. Springer Berlin Heidelberg, 2013-01, pp. 213–228. ISBN: 978-3-64235851-7. DOI: 10 . 1007 / 978 - 3 - 642 - 35852 4_14. URL: http://dx.doi.org/10.1007/978- 3642-35852-4_14.
[10] Isolde Dressler. Code Generation from JGrafchart to Modelica. Master’s Thesis ISRN LUTFD2/TFRT--5726--SE. Department of Automatic Control, Lund University, Sweden, 2004-03. [11] Ana Llorente. Code Generation from JGrafchart to ATMEL AVR. Master’s Thesis ISRN LUTFD2/TFRT--5749- -SE. Department of Automatic Control, Lund University, Sweden, 2005-01. [12] Alfred Theorin and Charlotta Johnsson. “An Interactive PID Learning Module for Educational Purposes”. In: Submitted to The 19th World Congress of the International Federation of Automatic Control (IFAC). 2014-08. [13] Hilding Elmqvist et al. “State Machines in Modelica”. In: Proceedings of 9th International Modelica Conference, Munich, Germany, September. 2012, pp. 3–5. [14] JModelica.org. PyFMI. URL: http : / / www . jmodelica . org / page / 4924 (visited on 2013-12-08). [15] The Regents of the University of California. JFMI - A Java Wrapper for the Functional Mock-up Interface. URL: http : / / ptolemy. eecs . berkeley. edu / java / jfmi / index . htm (visited on 2013-12-08). [16] Todd Fast, Timothy Wall, Liang Chen. Java Native Access (JNA). URL: https : / / github . com / twall/jna (visited on 2013-12-08).
DOI 10.3384/ECP140961257
Proceedings of the 10th International ModelicaConference March 10-12, 2014, Lund, Sweden
1263