2034
IEEE TRANSACTIONS ON INSTRUMENTATION AND MEASUREMENT, VOL. 55, NO. 6, DECEMBER 2006
On-line Nonintrusive Measurement of Particle Size Distribution Through Digital Imaging Robert M. Carter, Yong Yan, Senior Member, IEEE, and Peter Lee, Member, IEEE
Abstract—This paper presents the further development in the design and implementation of an innovative optical instrumentation system that can measure the size distribution of particles in a pneumatic suspension. A low-cost charge-coupled device (CCD) camera is used to capture the images of the particulate flow field, which is illuminated by a low-cost laser sheet generator. The particle size distribution is then determined by processing the particle images through the use of novel processing algorithms. Experimental results obtained on a small scale particle flow test rig have demonstrated that the system is capable of measuring the size distribution of pneumatically conveyed particles with repeatability better than 1% for a volumetric concentration up to 2%. A relative comparison is made between the on-line imaging technique and the widely accepted laser diffraction based particle sizing method. In addition to laboratory scale testing, results obtained in an industrial setting are presented and compared favorably with off-line reference values. Index Terms—Auto-thresholding, digital imaging, image segmentation, particulate flow, particle size, pneumatic conveying.
I. INTRODUCTION
P
NEUMATIC conveyance of particulate materials is an important technique used widely in many industries from foodstuff preparation to power generation. In order for pneumatic conveyors to achieve their full potential, in terms of conveying efficiency and the prevention of material degradation, it is necessary to measure the parameters of the flow. One of the most important parameters is the size, or size distribution, of the particles within the duct. Much research work has been carried out in the field of particulate flow metering [1] and a wide range of techniques have been developed for measuring a range of flow parameters [2]. Instruments based on techniques such as laser scattering and basic shadow imaging are available for measuring particle size distribution but they are cumbersome, expensive, and require intrusive modifications to the duct or even that impractical idealized flow conditions are available [2], [3]. It is clear that an instrumentation system must be developed that can measure particle size distribution on-line and that can be installed in a nonintrusive manner (i.e., the sensor does not modify the flow in any way). Digital imaging, though not Manuscript received June 15, 2005; revised August 11, 2006. This work was supported by the British Coal Utilization Research Association (BCURA) and the U.K. Department of Trade and Industry under a grant in aid. The views expressed are those of the authors, and not necessarily those of BCURA or the U.K. Department of Trade and Industry. The authors are with the Department of Electronics, University of Kent, Canterbury, Kent CT2 7NT, U.K. (e-mail:
[email protected];
[email protected];
[email protected]). Digital Object Identifier 10.1109/TIM.2006.887039
Fig. 1. Sensing arrangement.
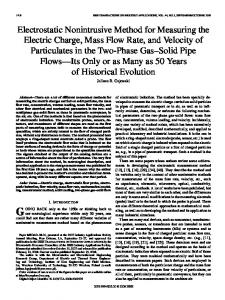
without complications when operating under realistic conditions, provides a means of achieving this and a novel digital imaging based system capable of measuring particle size distribution and volumetric concentration of particles in the manner required has been developed and described in some detail in the recent past [4]. When combined with well-established electrostatic velocity metering technology [5], it is also possible to derive absolute mass flow rate information—another parameter that is useful to industry [6]. This paper recaps the imaging concepts and processing strategies employed by the present system (for fuller details see [4]), for on-line particle size analysis, and presents discussions of these aspects along with new experimental results demonstrating the effectiveness of and exploring the repeatability achieved by the described methodology. The recent results achieved are also compared with those from an accepted off-line particle sizing instrument demonstrating the fundamental portability of measured data. The work presented, in its present form, uses novel processing algorithms along with cost-effective hardware, the combination of which has the potential to provide a practical instrumentation system well suited to operation in industrial environments. II. SYSTEM DESCRIPTION A. General Imaging Arrangement Particles flowing through a pipeline can be illuminated using a laser sheet to highlight a “slice” through the flow. Images of that slice can be acquired using a video camera. The basic concept and sensing arrangement are illustrated in Fig. 1. Such a system presents certain processing challenges that will be discussed in the next section but also provides a strong advantage over other particle interrogation techniques—since the slice illuminated by the laser is essentially a two–dimensional (2-D) image the system may be modified easily for interrogating stationary particles lying on a flat surface, as demonstrated in Fig. 2. The benefit of this lies not only in easy and accurate
0018-9456/$20.00 © 2006 IEEE
CARTER et al.: ON-LINE MEASUREMENT OF PARTICLE SIZE DISTRIBUTION
Fig. 2. Static interrogation arrangement.
calibration but also in that it is possible to produce both static and in-flight measurements using identical instrumentation for any given material—a feat that cannot be achieved by any other system since, in general, measurement techniques are only applicable to one mode of operation. This allows the fundamental effects of static versus in-flight measurement to be investigated. On a practical note it should be stressed that a rugged and cost-effective system is the goal of the present research as a device that is of practical use to industry is required. To this end low cost hardware is employed. The camera used is a monochrome device that was originally intended for the security market, offering the standard video resolution of 768 576 pixels (this is the actual working resolution of the particular charge-coupled device (CCD) in the camera—it is a “good” security camera). The lens used is a multielement glass device with full antireflective coating. A fairly narrow angle is employed and the lens was originally designed for “megapixel” applications so that distortion and vignetting effects are so minimal as to be ignored in the present application (static tests have shown intensity variations due to the lens to be lower than the noise threshold when operating on-line). B. Processing Software Once the images have been obtained, digital image processing techniques can be applied to extract information such as particle size distribution and absolute solids concentration. The processing techniques used here have been described in some detail elsewhere [4] but a brief recap for the convenience of readers will be presented. The main processing challenge lies in separating the particles from the background in a consistent and repeatable manner—inconsistent image segmentation will lead to variances in the measured particle size and, since other measurements such as concentration are simply arrived at through statistical analysis of particle sizing data, the variances will lead to cascading measurement errors. The simplest form of image segmentation is thresholding. This system is fast and easy to implement but, in order to provide good results, a very high contrast between particles and background must be present in the images—this is possible with shadow imaging but such systems require that the flow be modified to form a flat sheet and that diffuse back illumination is used. The images produced by the present, practical, system are of low contrast and are far from ideal. It can be readily appreciated that precise threshold value setting would be essential if reliable results were to be achieved. A possible alternative to thresholding would be to locate each particle in the image and then analyze its contour using advanced systematic algorithms—such an approach was ruled out for the present work as the heavy processing requirements
2035
would jeopardize both cost effectiveness and on-line operational requirements. If a consistent and repeatable method could be found for establishing a suitable threshold level then the basic threshold processing would be acceptable. This has been achieved in the present research through examining the characteristics of the images. It might easily be thought that by varying the threshold level the measured size of the particles could be varied enormously. In practice, the image behavior is more complex since there is noise in the images. This noise is used to advantage by the present method: At very low threshold levels, the noise in the image background begins to be detected as a large number of tiny particles and at high threshold levels, the noisy particles break up to produce the same effect. Thus, by counting the number of detected particles at a wide range of threshold levels it is possible to establish a range of suitable threshold values by detecting the sudden increase of particle numbers at the extremes of threshold setting. The exact value chosen within the suitable range will affect the sizing (and concentration) accuracy—it has been shown in the past that errors from this source can be kept to within 1.5% [4]. The current system, employing this automatic threshold setting method, has been found capable of achieving a basic accuracy of a few percent when used to measure particles in the 150- m to 25-mm range [4]—this is quite acceptable for an on-line industrial system. One issue of importance is that of concentration limits. The present system makes no attempt to identify overlapping particles in the images and so at higher concentrations errors may be introduced from this source. Also, high concentrations may be expected to produce unacceptably low image contrast due to effects such as secondary particle illumination through reflection and scattering. During tests it has been found that flow concentrations of up to 2–3% by volume do not suffer significantly from either source of error and while low for some industries this level of concentration is significantly higher than may be expected in industries such as electrical power generation where pulverized coal concentrations tend to remain 1% or less by volume. The present software/hardware configuration is capable of processing around six images per second. This speed is fast enough to allow the system to be used in a feedback loop for real-time control applications. In practice, such control has not yet been attempted and it has been found desirable in most instances to perform a rolling average on the results over a number of frames (between 10 and 50 depending on the flow conditions/material) but even with worst case averaging the response is measured in seconds. With the ever increasing speed of computers the sampling rate can only increase in the future, the upper limit with low-cost components being 50–60 samples per second, making the system inherently suitable for control applications. C. Laboratory Flow Rig A small particulate flow loop has been set up in the laboratory for evaluation purposes, as illustrated in Fig. 3. It is possible to vary flow velocity and concentration independently—velocity data are recorded by the electrostatic sensor [6].
2036
IEEE TRANSACTIONS ON INSTRUMENTATION AND MEASUREMENT, VOL. 55, NO. 6, DECEMBER 2006
Fig. 3. Layout of the test loop.
Fig. 4. Installation on RWE npower’s CTF.
D. Industrial Installation Industrial testing was carried out using the 0.5 MW Combustion Test Facility (CTF) that is owned and operated by RWE npower at Didcot in Oxfordshire (U.K.). This facility consists of a test furnace that is an exact but scaled down replica of those found in full-size power stations, thus allowing representative testing to be performed at reasonable cost. The pipe work on the CTF is the same diameter as that used in the laboratory scale rig and so the instrumentation system will fit either without modification. Fig. 4 shows the imaging sensor (circled) installed on the CTF. During testing a 90 : 10 mixture of pulverized coal and biomass (sawdust) was used and a sample of this was provided for static laboratory analysis. Material velocity in the CTF is similar to that established in the laboratory. III. RESULTS In order to evaluate the system laboratory tests have been carried out using sand as a test material. Full tests have been performed to establish the systems insensitivity to changes in
flow velocity and concentration—typical examples of results obtained are shown here. Fig. 5. shows an on-line size distribution measurement for this material taken at four different concentrations—it can be seen that agreement is very good with small variations between results. Fig. 6. shows a comparison between in-flight and static measurements with the current system and an in-flight reference measurement achieved using a proven laser diffraction instrument. It can be seen that the general agreement is good but that the off-line imaging distribution is narrower than either in-flight measurement. For the in-flight measurements the distribution may appear stretched at the high end due to particles that spin as they are measured, thus increasing their perceived size. At the low end there is a likelihood of (nonspinning) particles being analyzed “end on”: thus appearing minimal in size—something that could not happen with the static imaging result as particles will tend to lie on their larger surfaces. Both these effects will be made more pronounced by the fact that more particles must be analyzed by the in-flight systems than the static imager. The study of these phenomena, i.e., comparisons between static and in-flight measurements using the same measurement technique,
CARTER et al.: ON-LINE MEASUREMENT OF PARTICLE SIZE DISTRIBUTION
Fig. 5. On-line size distribution.
2037
Fig. 7. Repeatability test.
Fig. 8. Industrial test material. (a) Pulverized coal. (b) Biomass (sawdust). Fig. 6. Comparison of different approaches.
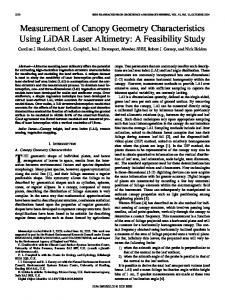
is made practical through the current research (note that size ranges used are standard ISO sieve sizes). Fig. 7 shows the repeatability of the three measurement methods by giving the standard deviation experienced when taking three readings with the same material for each system. This graph suggests that the on-line imaging system gives the best repeatability with the commercial laser diffraction system offering the worst performance. In reality, it is probable that unavoidable differences between test samples exaggerated the effect. Also the on-line imaging system would have analyzed more particles than the other two systems thus making the result more stable. The higher deviations given by the laser diffraction system may be related to the methodology’s sensitivity to nonspherical particle shapes; for the static imaging system any advantage in this area would be offset by the effects discussed in relation to Fig. 6 above. In general and despite variations between systems, the present system certainly gives good repeatability. Fig. 8 shows images (taken under static conditions) of the two materials combined for industrial trials. A size distribution recorded when operating on-line under industrial conditions is plotted in Fig. 9. The on-line results are compared with those obtained when testing the same material under static conditions (note that the 90 : 10 mixture could not be tested under static conditions due to clumping difficulties but each constituent was
Fig. 9. Industrial results.
tested separately and the images combined in the correct proportion; hence the separate images in Fig. 8(a) and (b)). The general agreement is good, with the bimodal distribution caused by the combination of two different materials being clearly visible. The lack of mid range sizes (around 200–355 m) in the static result is attributed to the tendency of the biomass particles to
2038
IEEE TRANSACTIONS ON INSTRUMENTATION AND MEASUREMENT, VOL. 55, NO. 6, DECEMBER 2006
appear larger under static conditions, as they lie on the largest face. The higher low-end peak for the static measurement is believed to be due to a slight tendency for the pulverized coal to clump under static conditions, thus increasing its average size by a small amount. IV. CONCLUSION The methodology presented here is certainly capable of achieving on-line and nonintrusive measurement of particle size distribution. Agreement between distributions taken at different concentrations is good, indicating insensitivity to changes in this parameter. When compared with accepted laser diffraction results, the agreement is also good. Another comparison made is that of on-line imaging to static off-line imaging (with the particles lying on a flat focal plane). Under these conditions, differences between in-flight and static measurements have become clear; only the present imaging approach allows direct comparison between static and on-line measurements. System repeatability is good, with neither static nor on-line imaging being worse than accepted laser diffraction methods. Clearly, the industrial results are useful, and the system is capable of operating successfully under such conditions. It is interesting to note the differences between in-flight and static measurements, a study that is only made possible through the use of an imaging based system. In general, the system presented here is promising and may represent a solution to a long-standing industrial need. ACKNOWLEDGMENT RWE npower plc is acknowledged for making test facilities available for the test work as reported and Mitsui Babcock Energy Ltd for offering useful technical advice. REFERENCES [1] Y. Yan and D. Stewart, Guide to the Flow Measurement of Particulate Solids in Pipelines. London, U.K.: The Institute of Measurement and Control, 2001. [2] ——, “Mass flow measurement of bulk solids in pneumatic pipelines,” Meas. Sci. Technol., vol. 7, pp. 1687–1706, 1996. [3] M. Pohl, “Particle sizing moves from the lab to the process,” PBE International, pp. 25–31, May 2001. [4] R. M. Carter and Y. Yan, “On-line particle sizing of pulverised and granular fuels using digital imaging techniques,” Meas. Sci. Technol., vol. 14, no. 7, pp. 1099–1109, 2003.
[5] J. Ma and Y. Yan, “Design and evaluation of electrostatic sensors for the mass flow measurement of pneumatically conveyed solids,” Flow Meas. Instrum., vol. 11, no. 3, pp. 195–204, 2000. [6] R. M. Carter and Y. Yan, “An instrumentation system using combined sensing strategies for on-line mass flow rate measurement and particle sizing,” in Proc. IMTC04, Como, Italy, May 2004, vol. 2, pp. 864–868.
Robert M. Carter received the B. Eng. degree in electronic engineering (with first class honors) from the University of Greenwich, Greenwich, U.K., in 2000 and the Ph.D. degree in digital imaging based flow instrumentation from the University of Kent, Canterbury, U.K., in 2005, respectively. He is currently a Postdoctoral Research Associate at the Department of Electronics, University of Kent. He was a part time Lecturer at the University of Greenwich before commencing his Ph.D. studies. He has published a number of papers in conference proceedings and peer reviewed journals. Dr. Carter has received a number of awards at both the undergraduate level and during doctoral level, including best presentation awards.
Yong Yan (M’04–SM’04) received the B. Eng. and M.Sc. degrees in instrumentation and control engineering from Tsinghua University, Beijing, China, in 1985 and 1988, respectively, and the Ph.D. degree in flow measurement and instrumentation from the University of Teesside, Middlesbrough, U.K., in 1992. He started his academic career in 1988 as an Assistant Lecturer at Tsinghua University. In 1989, he joined the University of Teesside as a Research Assistant. After a short period of postdoctoral research, he worked initially as a Lecturer with the University of Teesside during 1993–1996, and then as a Senior Lecturer, Reader, and Professor, respectively, with the University of Greenwich, Greenwich, U.K., during 1996–2004. He is currently a Professor of Electronic Instrumentation and the Head of Embedded Systems and Instrumentation Research Group at the University of Kent, Canterbury, U. K. He has published more than 170 research papers and has supervised more than ten Ph.D. research students to a successful completion. Prof. Yan is a Fellow of the Institute of Physics, U.K., and a Fellow of the Institute of Measurement and Control, U. K. he was awarded the achievement medal by the Institution of Electrical Engineers in 2003. He is a member of five U.K. national technical committees and expert panels.
Peter Lee (M’86) was born in Bromley, Kent, U.K., in 1959. He graduated with a B. Sc. degree in physics from the University of Sussex, Brighton, U.K., in 1981 and subsequently joined Philips Semiconductors in Southampton, U.K., where he worked as an IC designer from 1981 until 1984. In 1984 he joined Intermetall in Freiburg, Germany, where he worked on VLSI circuits for digital television. In 1987 he moved to Graz, Austria, to head the telecoms group at AMS. In 1991, he returned to England and took up a post as a temporary Lecturer at the University of Kent, Canterbury. He is currently a Senior Lecturer at the University of Kent, where he works in the Embedded Systems and Instrumentation Group. His research interests include high-speed digital design, image-processing, and embedded systems.